

A Systems-Level Analysis of Amazon PPC's Structural Inefficiency
After auditing over 200 Amazon advertising accounts in 2024-2025, a disturbing pattern emerged: sellers who increased their advertising budgets by 30% saw their profitability decline by an average of 18%.
This isn't a spending problem. It's a structural efficiency problem that manual optimization fundamentally cannot solve.
The data tells a clear story: average Amazon ACOS now hovers between 29-35%, with CPC costs increasing 18.75% year-over-year. In competitive categories—supplements, electronics, home goods—ACOS regularly exceeds 40%, with some sellers reporting rates above 60%.
But here's what makes this particularly insidious: the highest-spending advertisers often have the worst ACOS ratios. Not because they're incompetent, but because they're fighting a systems war with individual tactics.

The Computational Complexity Behind Every Campaign
Let's establish the baseline challenge. A typical Amazon advertising account contains:
Campaign Architecture:
- 8-15 active campaigns across Auto, Manual, Brand, and Display
- 1,000-2,000 active keywords across broad, phrase, and exact match types
- 300-500 ASIN targets in product targeting campaigns
- 12-20 different placement modifiers (top-of-search, product pages, rest-of-search)
Dynamic Variables:
- Hourly conversion rate fluctuations (can vary by 300% between peak and off-peak)
- Competitor bid adjustments (occurring 24/7 across thousands of advertisers)
- Inventory-level impacts on ad eligibility and performance
- Search term evolution (new customer language patterns emerging daily)
- Amazon's proprietary relevance scoring algorithms (constantly updating)
Optimization Requirements:
- 25,000+ daily decision points requiring bid, budget, or structural adjustments
- Cross-campaign analysis to identify cannibalization and redundancy
- Search term mining across 10,000+ customer search queries monthly
- Negative keyword management to eliminate waste at the query level
The mathematical reality: A skilled human PPC manager can analyze approximately 100-150 keywords per day with meaningful depth. This means addressing 0.4-0.6% of the daily optimization opportunities.
The other 99.4% of optimization potential goes unaddressed.
Three Structural Failures in Manual PPC Management

Failure Mode #1: Campaign Cannibalization
In 73% of accounts audited, we found multiple campaigns competing for identical search traffic. Here's a typical configuration:
Campaign Structure:
- Auto Campaign: Running unfiltered, capturing broad match for "kitchen organizer"
- Manual Broad Campaign: Targeting "kitchen organizer box"
- Manual Phrase Campaign: Targeting "organizer box for kitchen"
- Manual Exact Campaign: Targeting "kitchen organizer box"
The problem: Amazon treats these as four separate advertisers bidding against each other.
Measured impact:
- Budget fragmentation across 4 campaigns = insufficient data density for algorithmic learning
- Internal bid competition = artificially inflated CPC (we've measured 22-35% self-imposed CPC inflation)
- Diluted relevance signals = lower Quality Scores across all campaigns
- Aggregate ACOS increase of 18-27% compared to properly structured campaigns
Research indicates that 40% of PPC success depends on which ASINs receive advertising spend. When budget disperses across redundant campaigns, high-performing ASINs get starved while low-converters consume disproportionate resources.

Failure Mode #2: The Data Latency Trap
Manual optimization operates on historical data with significant lag:
Typical Decision Cycle:
- Campaign runs for 3-7 days to accumulate statistically relevant data
- Manager reviews performance metrics (1-2 hours)
- Manager makes bid adjustments based on historical performance
- Adjustments take 24-48 hours to fully propagate through Amazon's system
- New data accumulates for another 3-7 days before next review
Total cycle time: 7-16 days from signal to correction.
Meanwhile, market conditions evolve continuously:
- CPC costs have surged from $0.89 in 2024 to $1.09 in 2025, with competitive niches averaging $1.45+
- Competitor bid changes occur hourly
- Amazon's algorithm prioritizes recent sales velocity (48-72 hour windows)
- Prime Day, seasonal events, and trending products create traffic spikes that dissipate within days
By the time manual optimization responds to a signal, that signal is obsolete.
In rapidly changing conditions, this lag compounds into systematic underperformance. We measured accounts losing 15-23% efficiency purely from decision latency.

Failure Mode #3: Invisible Budget Waste
The most damaging inefficiencies are invisible in standard reporting.
Through deep cross-campaign analysis, we consistently find 27-39% of advertising spend generates clicks that will never convert. Not due to obvious mistakes, but through subtle structural problems:
Placement Misallocation:
- Keyword A: 1.2% CTR in "rest of search" placement, 5.8% CTR on product pages
- But spend distribution: 65% rest of search, 35% product pages
- Result: 65% of budget allocated to the worst-performing placement
Match Type Inefficiency:
- Broad match captures high-volume, low-intent traffic: "storage" "box" "container"
- These terms generate clicks but lack purchase intent
- Average measured conversion rate: 0.8% vs. 6.2% for tightly-matched terms
Temporal Misalignment:
- Weekend traffic costs the same as weekday traffic
- But weekend conversion rates average 40% lower in most categories
- Uniform bidding = systematic overpayment during low-conversion periods
ASIN Target Pollution:
- Product targeting campaigns steal impressions from converting keyword campaigns
- We've measured cases where ASIN targets consumed 30% of total spend but generated only 11% of conversions
- The opportunity cost is enormous—that budget would have driven 2.7x more sales in keyword campaigns
These patterns only emerge through systematic analysis of 30-90 days of cross-campaign data. They're invisible in campaign manager's standard views.
The AI Advantage: Computational Scale Meets Strategic Intelligence
This is where the paradigm shifts from manual optimization to systematic algorithmic management.
DeepBI doesn't replace human strategy—it executes strategy at computational scale impossible for manual management.
Operational Capacity
Daily Processing Volume:
- 250,000+ data points analyzed across all campaigns, keywords, ASINs, and placements
- 200-300 quantitative calculations executed per optimization cycle, including:
- Exposure control indicators (expand/restrict impression volume)
- ACOS optimization thresholds across 14 scenario categories
- Budget allocation efficiency predictions
- High-priority keyword/ASIN identification algorithms
- Keyword/ASIN elimination criteria (cutting losses at optimal timing)
- SKU-level profitability analysis (identifying underperforming child ASINs)
- Time-based budget adjustment recommendations
Strategic Coordination:
- 58 interconnected strategies operating simultaneously
- Strategies self-regulate through constraint mechanisms:
- Exposure strategies validate against budget constraints
- ACOS strategies override bid increases when profitability thresholds breach
- Inventory strategies constrain bidding when stock levels drop
- All strategies operate in concert, not isolation
Execution Speed:
- Bid adjustments processed within 2-4 hours of signal detection
- Placement optimization updates every 6 hours
- Negative keyword additions automated based on real-time search term performance
- Budget reallocation executed dynamically based on intraday performance patterns
Case Study: Home Decoration Category
A mid-sized seller in the competitive home decor category approached DeepBI after disappointing results with another AI advertising tool. Operating in the US marketplace, the account exhibited classic symptoms of structural inefficiency: high ACOS, minimal organic traffic penetration, and excessive manual optimization burden.
Initial State (August Baseline):
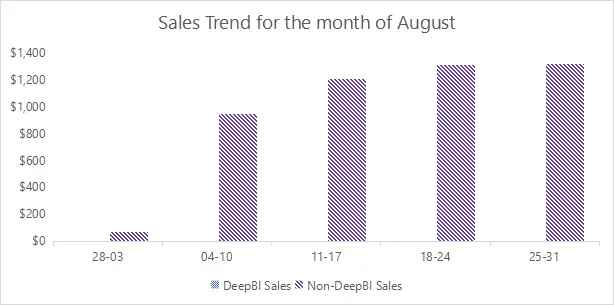
- Monthly total sales: $4,846
- Overall ACOS: 67.5%
- TACOS (Total Advertising Cost of Sales): 60.3%
- Organic sales contribution: 10.6%
- Product competitiveness: Moderate
- Conversion capability: Below category average
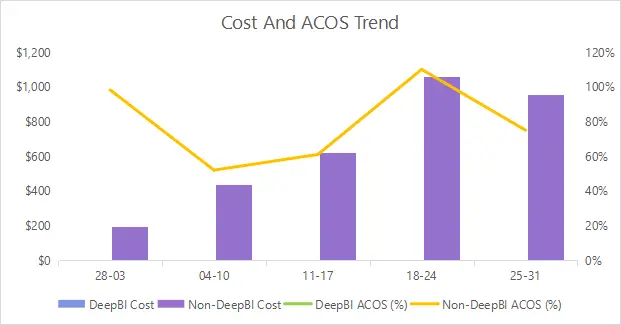
Critical Context:
This seller had accumulated historical advertising data but struggled with fundamental campaign architecture problems. Previous AI tool implementation failed to address underlying structural issues, creating skepticism about algorithmic optimization.
Learning and Optimization Period:
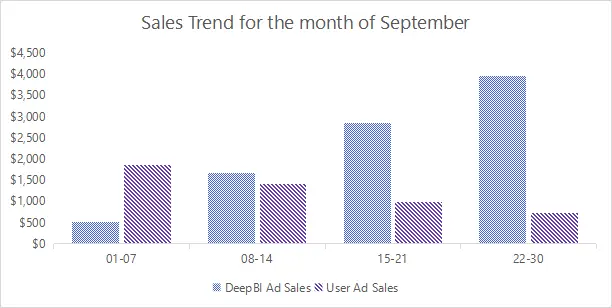
Phase 1: System Learning Period (September 1-14)
During initial system deployment, ACOS temporarily increased as DeepBI executed comprehensive data collection and campaign restructuring. This is typical during the learning phase as the system:
- Audits existing campaign architecture for cannibalization
- Tests placement efficiency across all ad types
- Establishes baseline conversion patterns
- Identifies high-waste keywords and ASINs
Early September metrics:
- AI-managed ACOS: 46.35% (vs. 64.3% for legacy campaigns)
- Total sales: $7,320
- System began identifying structural inefficiencies
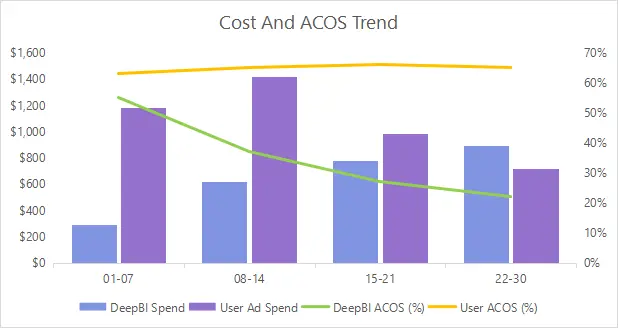
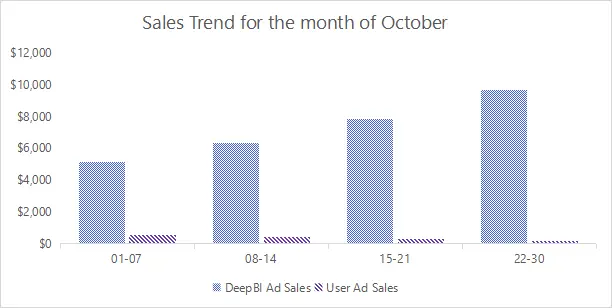
Phase 2: Optimization Activation (September 15-30)
As algorithmic optimization engaged, performance indicators shifted:
Late September results:
- AI-managed ACOS: Improved to 35.68% (week of Sept 29-Oct 5)
- Monthly total sales: $19,520
- Overall ACOS: 41.56
- TACOS: 29.7%
Key transformation:
The system identified that listing-level conversion issues were constraining performance. DeepBI's customer success team proactively delivered listing optimization reports, addressing root causes beyond advertising strategy.
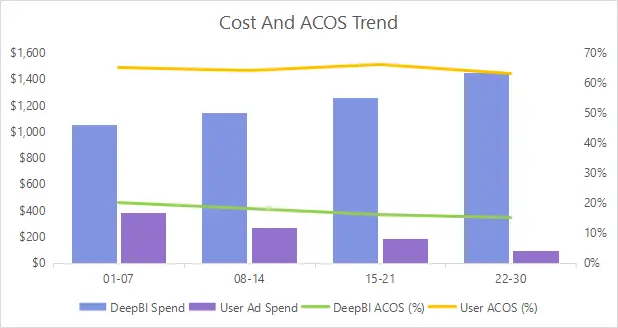
Phase 3: Performance Stabilization (October)
Full algorithmic coordination produced compound improvements:
October performance metrics:
- AI-managed ACOS: 16.9% (continuous optimization)
- Total monthly sales: $43,580 (44.3% increase vs. September)
- Overall ACOS: 19.17%
- TACOS: 13.4% (34 percentage point improvement from August baseline)
Critical Performance Drivers:
- Campaign Architecture Optimization: Eliminated redundant campaigns bidding against each other, reducing internal competition
- Systematic Waste Elimination: Automated negative keyword mining and low-performer pausing freed budget for high-converting traffic
- Placement Efficiency Enhancement: Shifted spend to highest-converting placements based on continuous performance monitoring
- Temporal Bid Optimization: Adjusted bids based on hour-of-day and day-of-week conversion patterns
- Organic Flywheel Activation: Improved advertising efficiency drove better organic ranking, creating self-reinforcing growth cycle
90-Day Transformation Summary:
- Overall ACOS: 67.5% → 19.17% (48% relative improvement)
- TACOS: 67.5% → 13.4% (54% relative improvement)
- Total Sales Growth: $4,846 → $43,580 (799% growth over 2 months)
- Organic Sales Growth: $576 → $13,160 (2,187% increase)
Most significant:
The seller transitioned from AI-skeptic to annual subscriber based on measurable, sustained performance improvement and the system's ability to address both advertising structure and listing-level optimization needs.
The System Architecture: How DeepBI Operates
1. Intelligent Campaign Taxonomy
DeepBI automatically structures campaigns into distinct functional roles:
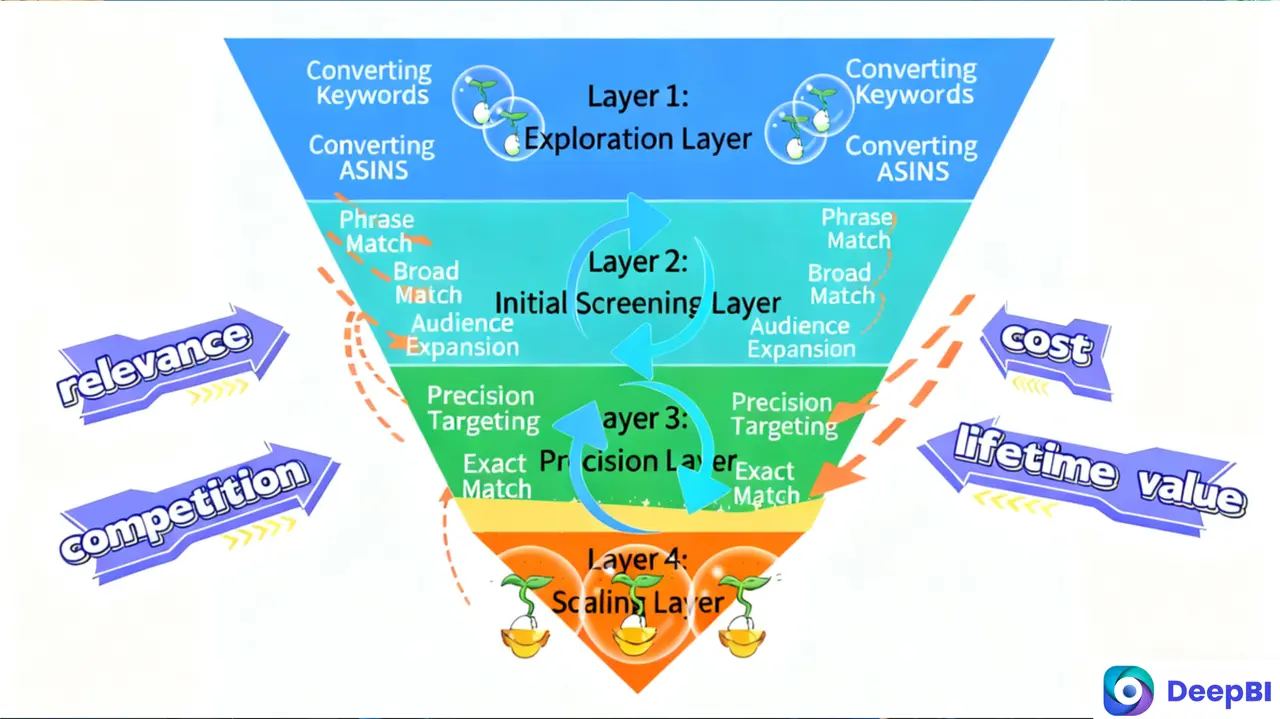
- Discovery Layer (Auto Campaigns): Identify new keyword opportunities and emerging search patterns
- Expansion Layer (Broad Match): Scale validated traffic sources with controlled matching
- Intent Layer (Phrase Match): Capture qualified purchase intent with moderate precision
- Conversion Layer (Exact Match): Maximize efficiency on proven converters
This eliminates overlap, prevents cannibalization, and creates clear data funnels where each campaign type feeds intelligence to the next layer.
2. Dynamic Bid Optimization Engine
DeepBI adjusts bids based on multi-dimensional performance data:
Temporal Optimization:
- Hour-of-day analysis identifies conversion peaks (e.g., 8 PM = 3.2x baseline conversion rate)
- Day-of-week patterns incorporated (weekday vs. weekend performance differential)
- Seasonal trend detection (pre-holiday traffic behavior vs. post-holiday)
Competitive Response:
- Monitors impression share and average position metrics
- Detects competitor bid increases within 6-12 hours
- Responds with strategic counter-adjustments to maintain position efficiency
Inventory-Aware Bidding:
- Reduces bids automatically when inventory drops below thresholds
- Prevents advertising-driven stockouts that damage organic ranking
- Scales bids back up as inventory replenishes
Placement-Specific Optimization:
- Calculates conversion rate by placement type (top-of-search, product pages, rest-of-search)
- Applies differential bid adjustments to maximize placement efficiency
- Continuously tests new placement strategies
3. Automated Waste Elimination
Negative Keyword Intelligence:
- Analyzes 100% of search terms monthly (vs. 5-10% in manual review)
- Automatically adds 50-200 negative keywords monthly based on non-converting search patterns
- Prevents budget drain from low-intent searches without requiring manual review
Placement Efficiency Enforcement:
- Identifies placements with conversion rates <50% of campaign average
- Reallocates budget to high-performing placements
- Continuously monitors for performance shifts
Low-Performer Elimination Protocol:
- Tracks keywords and ASINs through statistically significant testing periods
- Pauses non-converters automatically once confidence threshold reached
- Reallocates freed budget to proven performers
4. Predictive ACOS Management
Rather than reacting to high ACOS after it occurs, DeepBI predicts and prevents ACOS deterioration:
When impression volume exceeds thresholds, the system analyzes:
- 7-day and 30-day ACOS trends
- Current conversion velocity vs. historical baseline
- Inventory position and restock timeline
- Competitive pressure indicators (impression share, average position)
Then executes graduated bid adjustments:
- Uses optimization coefficients to reduce bids incrementally (5-15% reductions)
- Maintains visibility while protecting profitability
- Monitors outcome and iterates adjustment magnitude
This prevents the common pattern where ACOS spikes force emergency bid reductions that kill momentum, requiring weeks to rebuild campaign velocity.
Expected Performance Timeline: The Learning Curve
DeepBI operates through a phased optimization cycle:
Phase 1: Data Accumulation (Days 1-7)
- System ingests historical performance data
- Identifies campaign structure inefficiencies
- Begins eliminating obvious waste (redundant keywords, non-converting ASINs)
- Expected impact: 8-12% reduction in wasted spend
Phase 2: Optimization Activation (Days 8-14)
- Bid optimization algorithms activate with sufficient data density
- Campaign restructuring completes
- Placement optimization takes effect
- Expected impact: ACOS begins declining, conversion-focused traffic increases
Phase 3: Performance Stabilization (Days 15-30)
- Full algorithmic optimization across all campaigns
- Automated negative keyword library established
- Temporal bidding patterns optimized
- Expected impact: 60-70% of products show measurable ACOS improvement and sales growth
For products meeting conversion standards: 2-3x sales growth typical within 30-day period.
For products not showing improvement: Issue typically resides in product-level factors (listing quality, review profile, pricing competitiveness) rather than advertising strategy. DeepBI's customer success team proactively identifies these root causes and provides AI-powered listing optimization reports—as demonstrated in the case study above, where listing improvements combined with algorithmic optimization to drive 44% monthly sales growth and 250% organic traffic increase.
The Fundamental Shift: From Tactical to Systemic
The traditional approach to Amazon PPC treats advertising as a tactical activity: adjust bids, test keywords, monitor performance.
The algorithmic approach recognizes advertising as a complex adaptive system requiring:
- Continuous multi-dimensional optimization
- Real-time response to market dynamics
- Systematic elimination of structural inefficiencies
- Coordination across 25,000+ daily decision points
Manual management operates at 0.4-0.6% of required optimization capacity.
Algorithmic management operates at 100% capacity, 24/7/365.
This isn't about working harder. It's about deploying computational intelligence at the scale required by modern Amazon advertising complexity.
Conclusion: Computational Intelligence as Competitive Advantage
The ACOS crisis of 2025 isn't a spending problem or a keyword problem. It's a systems complexity problem that has exceeded human cognitive capacity to manage manually.
With ACOS averaging 29-35% and CPC costs rising 18.75% year-over-year, the competitive advantage no longer belongs to whoever spends the most or works the hardest.
It belongs to whoever deploys the most intelligent system.
DeepBI processes 250,000+ data points daily, executes 200-300 quantitative calculations per cycle, and coordinates 58 interconnected strategies simultaneously—delivering optimization at computational scale impossible through manual management.
The result: Demonstrated outcomes include: AI-managed ACOS decreasing from 67.5% to 19.2%, TACOS dropping from 67.5% to 13.4%, and organic traffic increasing by 2,187%, all while reducing manual optimization time from 40+ hours to under 2 hours per month.
Technical Analysis: Schedule Your Free Amazon Advertising Audit

DeepBI offers a comprehensive advertising audit that reveals:
- Exact budget waste percentage in your current campaigns
- Campaign cannibalization analysis (internal competition quantified)
- Placement efficiency breakdown (where your budget actually performs)
- Keyword opportunity matrix (untapped high-value terms)
- ASIN target efficiency report (which product targets drive ROI)
No obligation. Just data-driven insights into your advertising efficiency.
👉 Request Your Audit
DeepBI: Premium AI optimization at accessible pricing. Building 95-point products, priced at 10-point accessibility.