The Challenge: Unlocking Deeper Insights from Amazon Ads Data
In an increasingly competitive Amazon marketplace, rising advertising costs place immense pressure on sellers to optimize every aspect of their campaigns. While the native Amazon Ads console provides essential performance metrics, it often stops short of delivering the deep, actionable insights needed to gain a true competitive edge. Sellers can see their ACoS, clicks, and sales, but struggle to answer the critical "why" behind performance fluctuations. This surface-level view makes it difficult to move from reactive adjustments to proactive, data-driven strategy.
In real operations, this often shows up as a kind of “ad tunnel vision.” One grill accessories seller DeepBI worked with kept staring at their ad console because ACoS was high and orders were unstable. They assumed the problem had to be bids and keywords, so they cycled endlessly through campaign restructures and bid tweaks. The dashboards changed slightly from week to week, but the underlying profitability picture did not. What they lacked was not more ad knobs to turn, but a deeper lens that could connect ad spend to listing strength, conversion behavior, and competitive benchmarks.
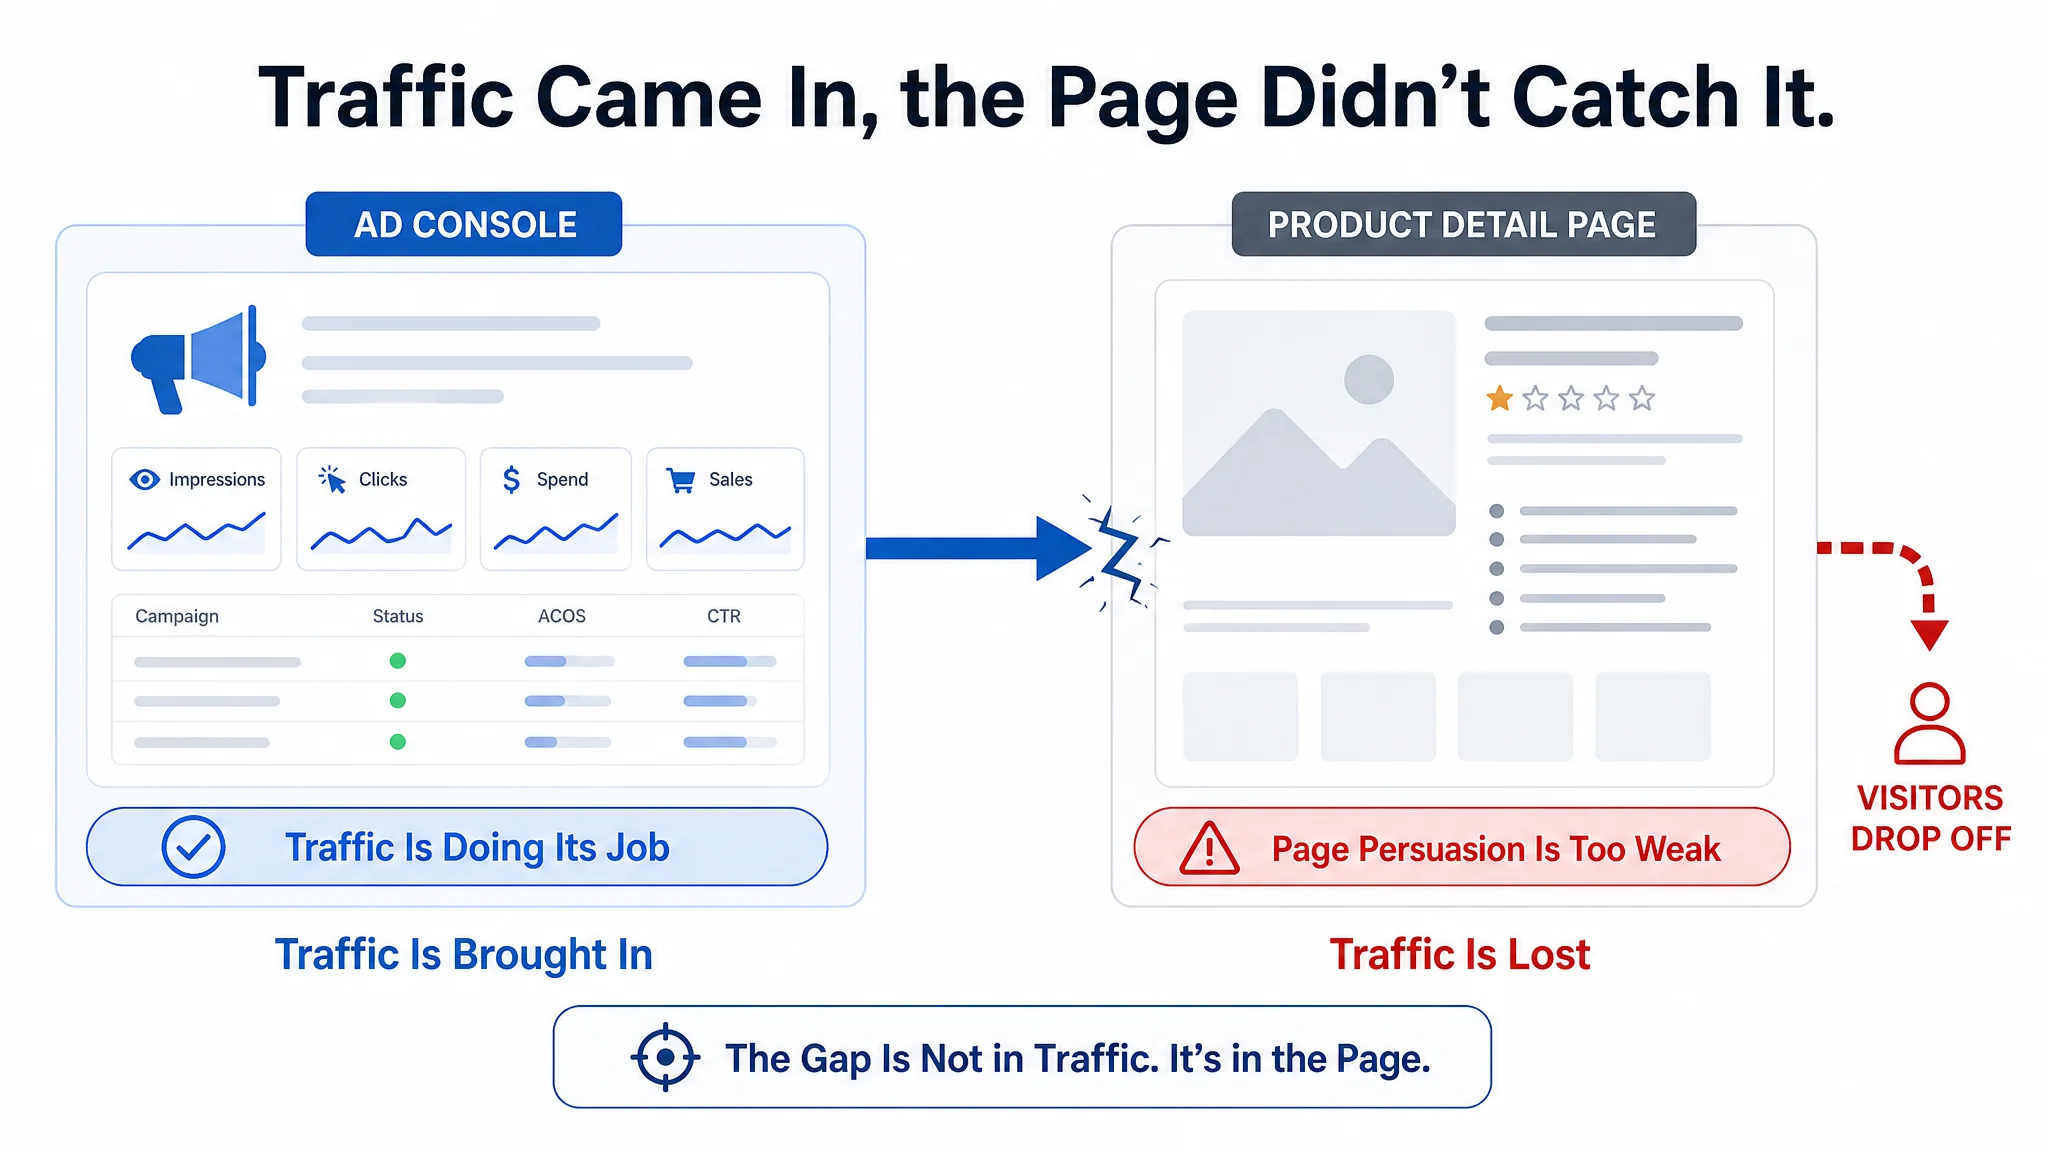
The core limitation lies in data silos. The standard reporting environment doesn't easily allow for integrating ad performance with other vital business data, such as inventory levels, pricing changes, or listing optimization timelines. For example, quantifying the precise impact of a new main image on Click-Through Rate (CTR) or linking a revised product description to an improvement in Conversion Rate (CVR) becomes a task of manual correlation and guesswork. This forces reliance on subjective judgment rather than building a reliable, data-backed feedback loop.
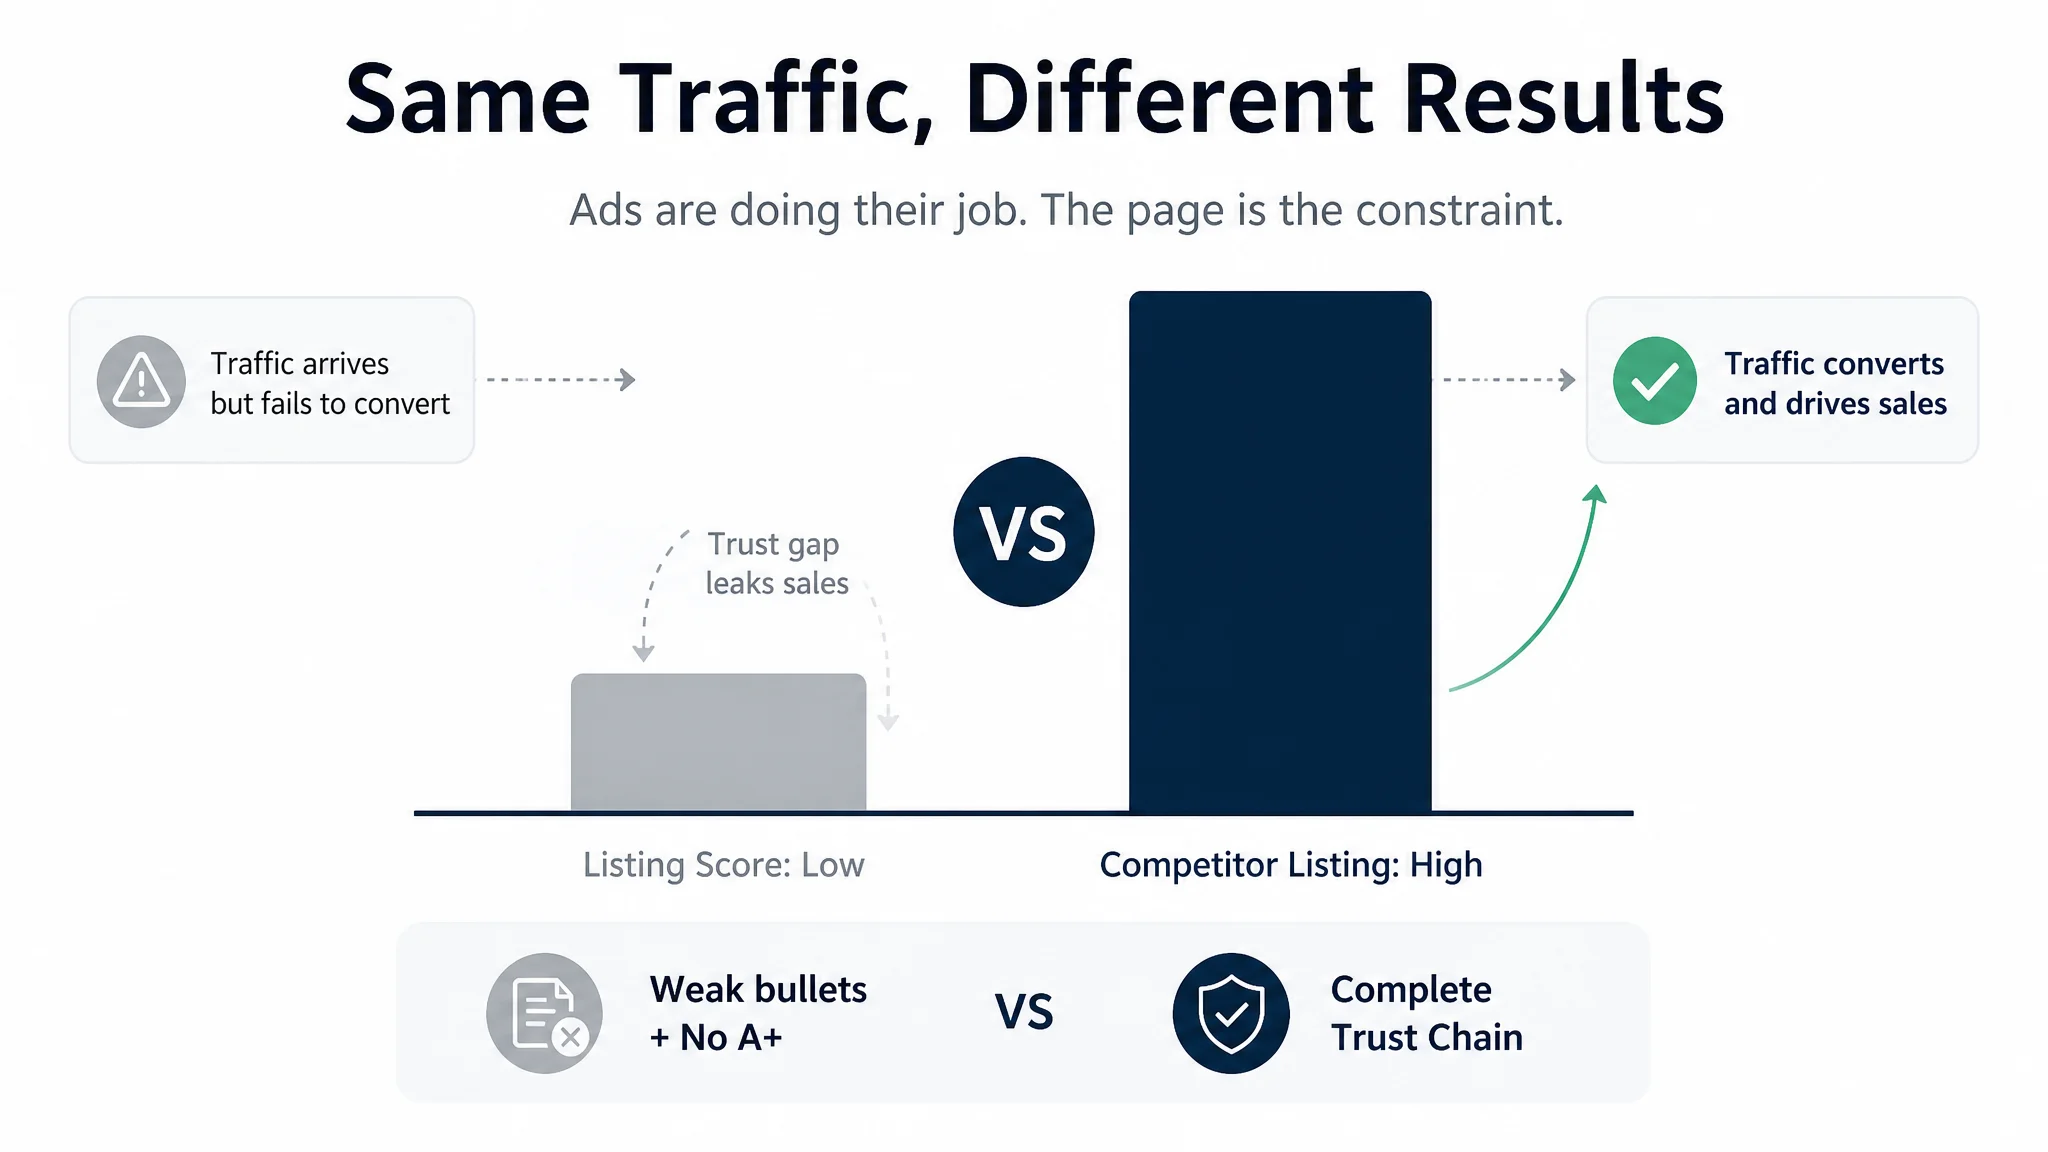
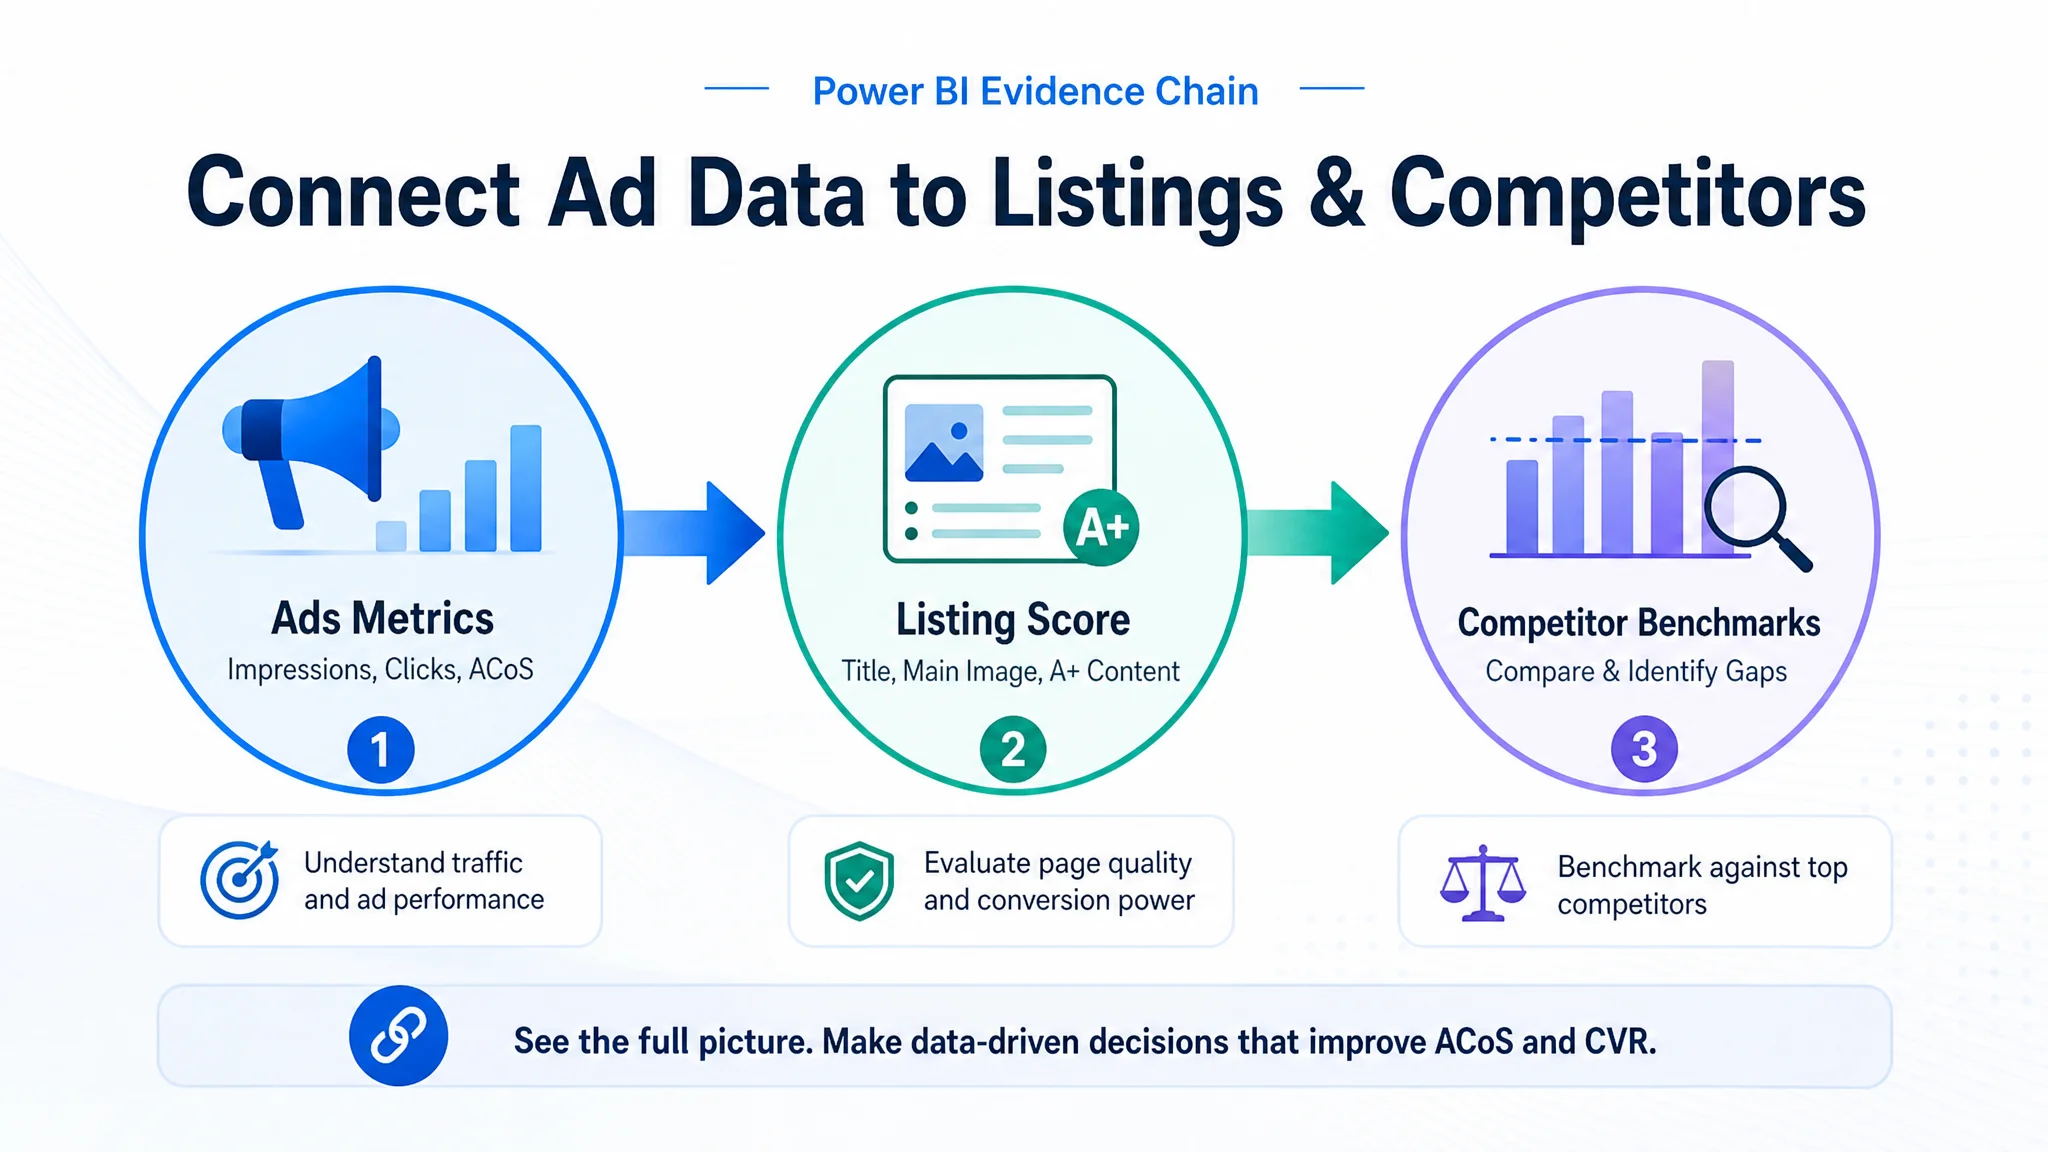
In the grill accessories case, the seller saw CTR that wasn’t disastrous, but conversion and ACoS remained poor. Without an integrated view, the team kept treating this as a pure “traffic quality” issue. Only when DeepBI overlaid ad metrics with a structured listing score—showing a 42/100 page up against an 81/100 competitor—did the pattern become obvious: ads were doing their job bringing visitors; the page was failing to convince them. That kind of insight requires data from ads, listings, and competitors to be viewed together, not in isolation.
To break through these analytical barriers, sellers require a more robust and customizable platform. This is where powerful business intelligence (BI) tools like Microsoft Power BI become indispensable. By consolidating Amazon Ads data with other key datasets, Power BI enables the creation of dynamic, interactive dashboards that uncover hidden trends, reveal complex correlations, and provide a holistic view of business performance.
Why Integrate Amazon Ads Data with Power BI Using DeepBI?
To gain a competitive edge, sellers must move beyond the standard Amazon Ads console and unlock deeper insights from their data. Integrating Amazon Ads data with a robust business intelligence tool like Power BI is the key, but the process is often manual and complex. DeepBI serves as the essential, AI-powered bridge that automates and elevates this connection, shifting your operations from being experience-driven to data-driven.
A common pattern DeepBI sees is teams reacting to symptoms in the ad console—rising ACoS, unstable sales—and immediately diving into keyword lists and bid strategies. In the grill replacement kit example, the seller did exactly that: they kept expanding and pruning keywords, splitting campaigns, and adjusting bids, convinced the bottleneck lived inside the ad account. When DeepBI ingested both their ad data and listing data into a unified model, the story changed. The system surfaced a stark 42/100 listing score against an 81/100 competitor, with especially weak bullets and zero A+ content. Once those listing weaknesses were visible alongside ACoS and CVR, it became clear that ad changes alone could never compensate for such a conversion deficit.
This integration allows you to transform raw advertising metrics into dynamic, interactive dashboards in Power BI for superior data visualization. You can achieve consolidated reporting by merging ad performance data with other critical business streams, such as sales, inventory, and financial data, creating a single source of truth for your entire operation.
Furthermore, Power BI’s advanced analytical capabilities, including DAX and M-language, enable the creation of custom calculations and predictive models that are impossible with standard reports. DeepBI’s primary role is to streamline this entire workflow. It provides automated data refreshes, eliminating tedious manual exports and ensuring your analysis is always based on the most current information. By connecting disparate data points and preparing them for sophisticated analysis, DeepBI ensures that every decision, from budget allocation to creative optimization, is backed by a rigorous data evidence chain, directly impacting KPIs like ACoS and CVR.
In the grill parts scenario, this “evidence chain” was critical. Once their Amazon Ads metrics were visualized next to listing quality scores and competitor benchmarks in Power BI, the team could see a simple but powerful narrative: impressions and clicks were acceptable, but CVR underperformed in exactly the areas where the page content was weakest—bullets and A+. That allowed them to reframe their decisions from “Which keyword to cut?” to “Which page element to fix first before spending another dollar on traffic?” That is precisely the shift from experience-driven to data-driven operations this integration is meant to create.
DeepBI's Approach to Amazon Ads Data Integration with Power BI
DeepBI provides a structured and robust framework for channeling your Amazon Ads data directly into Power BI, transforming raw performance numbers into a strategic asset. The approach is built on three core pillars: simplifying the connection, delivering comprehensive data, and ensuring reliable automation.
Streamlined Data Connection
DeepBI establishes a secure and direct link to your Amazon advertising account using Amazon's official Selling Partner API (SP-API). This method ensures data integrity and security while eliminating complex manual setup processes. The connection is designed to be straightforward, allowing sellers and marketers to sync their data with Power BI with minimal technical expertise, significantly reducing the time and resources typically required for data pipeline development.
In practice, this means teams no longer have to rely on ad-hoc CSV exports that get stitched together in spreadsheets. In the grill accessories case, the seller had been exporting campaign reports periodically and trying to match them with listing changes remembered from Slack threads and internal notes. When DeepBI connected directly via SP-API and pulled structured ad data into its own environment, it was able to align those metrics with listing elements and competitive data systematically. That clean, consistent connection was the foundation for the later Power BI models that ultimately revealed the true constraint: an underperforming product page, not a broken ad account.
Comprehensive Data Metrics and Dimensions
To enable truly granular analysis, DeepBI extracts a wide array of metrics and dimensions from your ad campaigns. This includes essential performance indicators such as impressions, clicks, ad spend, and sales, alongside critical efficiency metrics like Advertising Cost of Sales (ACoS) and Return on Investment (ROI). By providing this level of detail, from high-level campaign performance down to specific keyword data, DeepBI empowers you to build detailed, multi-faceted reports in Power BI that uncover deeper insights into your advertising effectiveness.
For example, when DeepBI decomposed the grill kit’s performance in its own environment, it could see that CTR at the keyword level was not uniformly weak. Certain search terms related to “flame tamer” and “heat plate shield” generated solid click behavior, indicating that the main image and title were at least functional. However, conversion stayed stubbornly low across those same terms. When that pattern was visualized in Power BI alongside a breakdown of listing content—showing 0 points for A+ and minimal bullet quality—it became easier to recognize that the performance drop-off happened after the click, not before it. Access to these granular metrics and dimensions is what lets you pinpoint whether a problem is primarily about traffic, targeting, or on-page persuasion.
Automated Data Refresh and Reliability
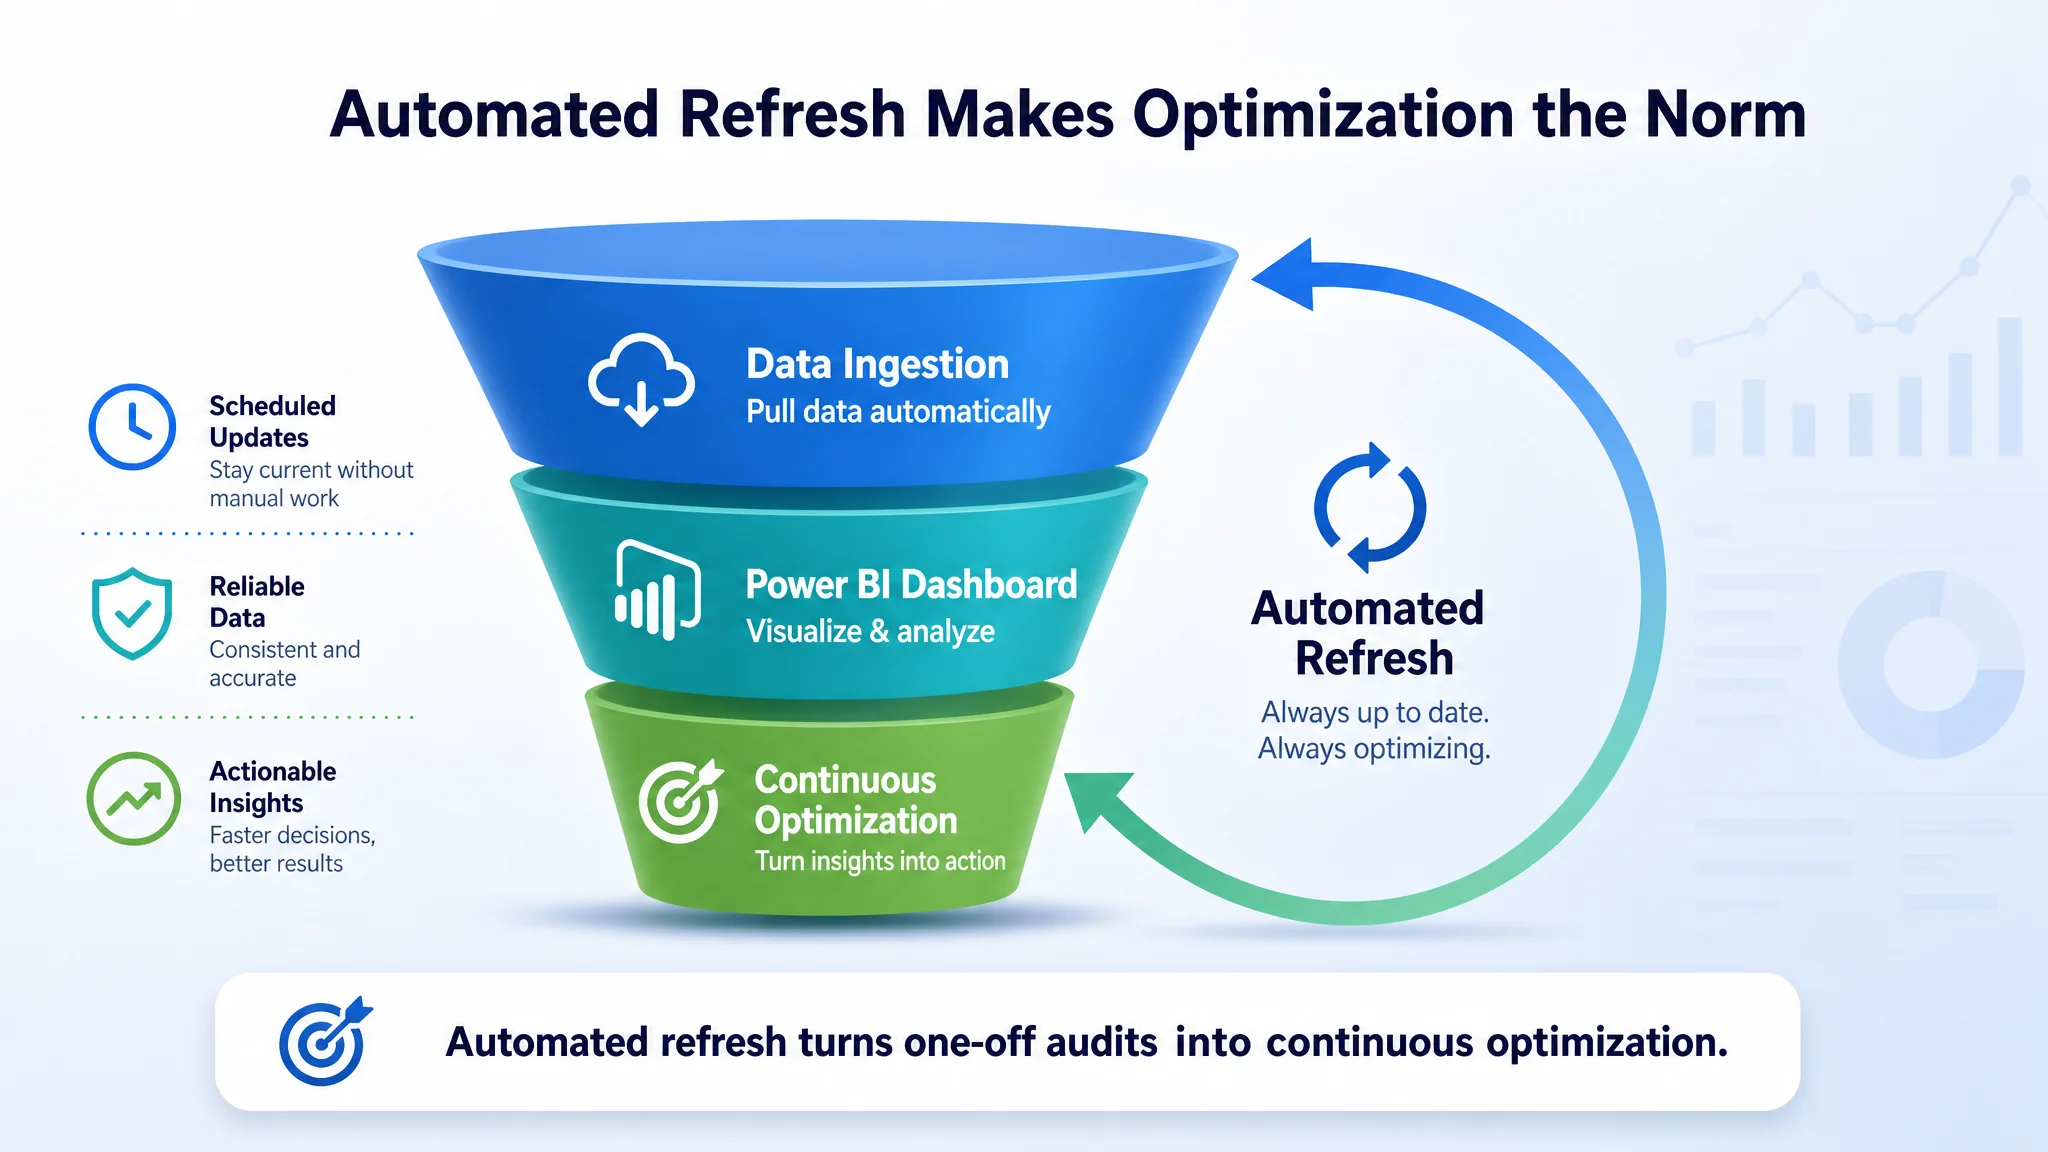
A key component of the DeepBI integration is its automated data refresh capability. The system manages a stable and reliable data pipeline that continuously updates your Power BI datasets, ensuring your dashboards reflect near real-time performance. This automation removes the need for manual data pulls and eliminates the risk of human error associated with data handling. As a result, your team can confidently make timely, data-driven decisions based on the most current and accurate information available.
For the grill accessories seller, this meant they could track the impact of listing changes—like improved bullets and a rebuilt A+ section—on CVR and ACoS without changing their reporting process every week. Once the new content went live, automated refreshes ensured that their Power BI dashboards began to reflect the evolving performance. Instead of wondering whether a small dip in ACoS was due to random fluctuation or a structural improvement, they could watch the post-click metrics trend as the page’s “conversion capacity” improved. Reliable, automated data is what turns one-off audits into continuous optimization.
Advanced Analytics with Power BI: Leveraging DeepBI's Data
Building Custom Dashboards and Reports
By channeling structured data from DeepBI into Power BI, you can move beyond standard reports and build custom analytical dashboards. This integration allows you to visualize key performance indicators (KPIs) in layouts tailored to your specific business questions. Using Power BI’s flexible interface, you can create dynamic reports with custom filters and visualizations, starting from scratch or leveraging pre-built templates to monitor critical metrics like CTR, CVR, and spend across your campaigns.
In the grill parts example, once DeepBI data was live in Power BI, the seller built a dashboard that lined up keyword-level ad metrics with listing score components. One view segmented keywords by CTR bands and plotted their corresponding CVR. Another overlaid major listing changes—such as the introduction of A+ content or reworked bullets—on a timeline of ACoS and ordered units. These custom views made it easier to see that after the listing overhaul, certain keyword clusters began converting more consistently, even without radical changes to bids. Instead of relying on gut feel (“the page looks better; performance should improve”), the team had dashboards that quantified the impact of each content iteration.
Performance Monitoring and Optimization with DeepBI's AdsQuant
DeepBI's ModuleAdsQuant provides the granular data needed for sophisticated performance analysis. Its four-layer traffic funnel model allows you to dissect keyword and ASIN targeting performance—from initial exploration and screening to precision targeting and scaling. When visualized in Power BI, this data enables you to make informed daily adjustments to bids and budgets based on recent 7-day performance metrics. This data-driven approach directly contributes to improving ACoS, maximizing ROI, and ensuring more effective ad spend.
In scenarios like the grill kit, this funnel view is particularly valuable because it helps prevent misdiagnosis. Initially, the seller treated every underperforming keyword as a targeting problem, rotating it through campaign types and bid strategies. With AdsQuant data brought into Power BI, DeepBI could classify terms by funnel stage and then compare their CTR and CVR to listing quality. Patterns emerged: exploratory keywords that generated acceptable CTR but poor CVR were not inherently “bad;” they were hitting a page that lacked a persuasive bullet structure and any A+ story. After the listing was rebuilt, the same funnel views in Power BI started to show improved conversion on those terms, confirming that the earlier issues were rooted in page content rather than keyword relevance. AdsQuant, combined with Power BI, thus becomes a way to test whether your optimization efforts should focus on bids and budgets—or on giving the traffic a better page to land on.
Cross-Channel Insights and Organic Traffic Synergy
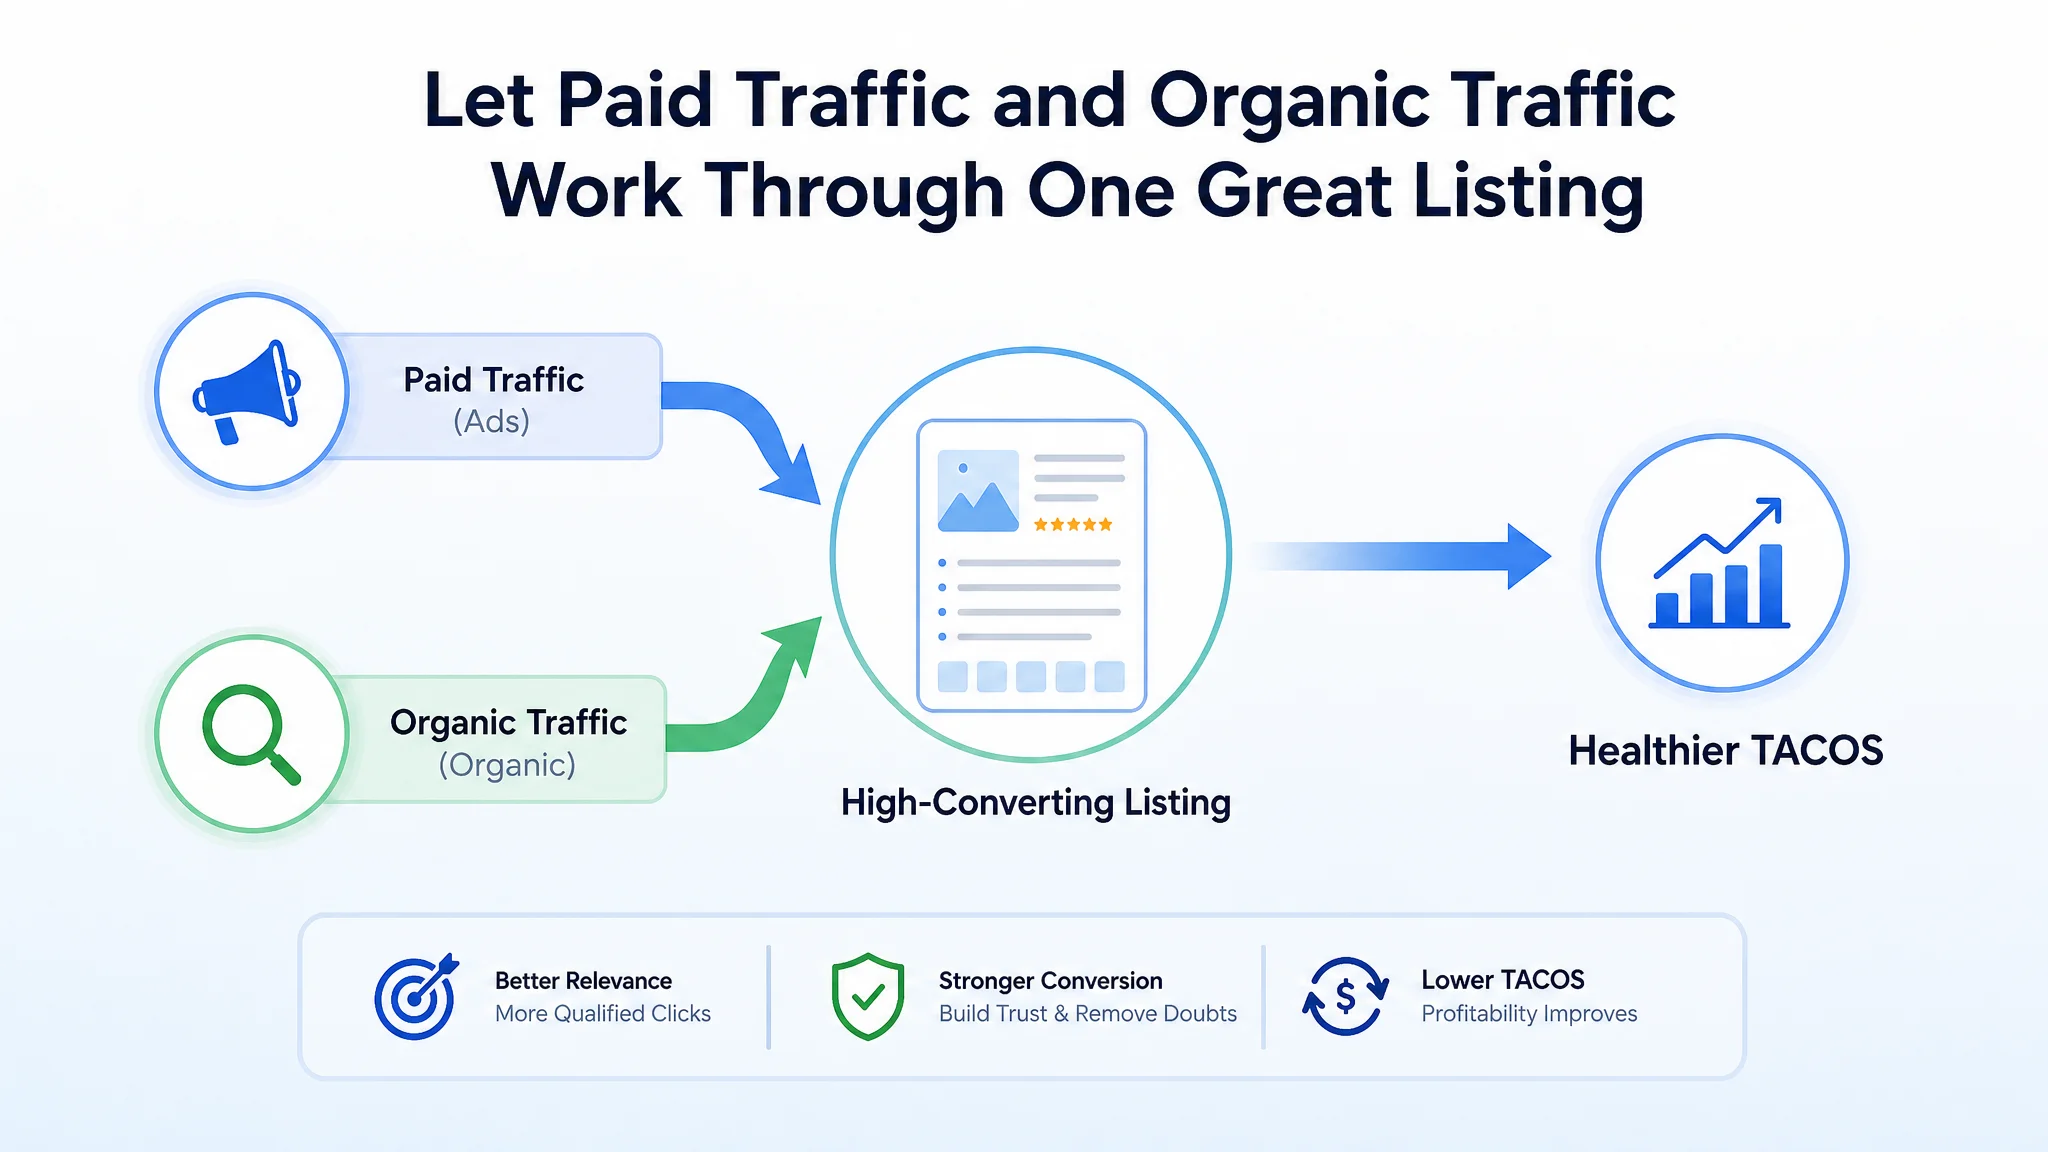
The value of DeepBI's integrated data extends beyond ad optimization. Insights gleaned from ModuleAdsQuant can powerfully inform your broader Amazon strategy. For example, by identifying high-converting keywords through ad performance analysis, you can strategically focus your efforts within ModuleOrganicTraffic to strengthen your Top of Search positions for those specific terms. This synergy between paid and organic channels helps improve your natural ranking and drive down your Total Advertising Cost of Sales (TACOS) for healthier long-term growth.
Returning to the grill accessories case, once the listing’s conversion fundamentals were improved, DeepBI could highlight which search terms were now consistently generating strong post-click behavior. Instead of continuing to pay heavily for every visit on those terms indefinitely, the seller began using DeepBI’s organic-traffic insights to support their positioning for similar queries in organic search results. Because the page now contained richer bullets and an A+ layout that explained durability, fit, and usage clearly, it had a better chance of holding high organic positions. Visualizing this relationship in Power BI—seeing how improvements in conversion led to more stable organic ranking and a healthier TACOS—helped the seller understand that ad optimization and listing optimization are two halves of the same system, not separate projects.
Step-by-Step Guide to Connecting Amazon Ads Data to Power BI via DeepBI
Integrating your Amazon advertising data into a powerful business intelligence tool like Power BI begins with establishing a secure and stable data pipeline. This process involves configuring your accounts on both platforms to ensure seamless data flow for advanced analytics and visualization.
Setting Up Your DeepBI Account
The initial step is to create and configure your DeepBI account. This involves a standard registration process where you will set up your user profile and workspace. Once your account is active, you can proceed to the data source management area to begin linking your Amazon seller profile. This foundational step ensures you have a centralized platform ready to receive and process your advertising data.
For many teams, this is also the moment when they start to centralize information that had previously been scattered. In the grill kit case, for example, the seller had historical listing versions saved in different files and conversations. When they set up DeepBI as a dedicated workspace and attached their Amazon profile, they could begin to log and align major listing changes—such as title edits or new image sets—against incoming ad and conversion data. That groundwork later made it possible, inside Power BI, to mark exactly when the page moved from a “42/100 with no A+” state toward a more competitive configuration and to analyze performance before and after.
Configuring Amazon Ads Data Source in DeepBI
To enable DeepBI to access your performance metrics, you must authorize a connection to your Amazon Ads account. This is typically done by creating a secure link via the Selling Partner API (SP-API). Within the DeepBI platform, you will navigate to the data source configuration section and select Amazon as the source. The system will then guide you through the authentication process, which requires you to grant permissions for DeepBI to retrieve key advertising reports. This connection allows the platform to pull essential KPIs like impressions, clicks, conversions, and ACoS for its internal processing and analysis.
When the grill accessories seller completed this step, DeepBI could finally see the full picture: which campaigns drove the most traffic to the underperforming listing, which keywords generated good CTR but poor CVR, and how spend was distributed across those segments. That level of detail—available through SP-API and structured by DeepBI—later fed directly into Power BI. It’s what allowed the team to stop asking “Are our ads broken?” in isolation and instead ask “How does each ad dollar perform given the current listing state compared to category benchmarks?”
Connecting DeepBI Data to Power BI
Once DeepBI has aggregated and processed your Amazon Ads data, the final step is to pipe this enriched dataset into Power BI. This is generally accomplished using a dedicated data connector or a unique API endpoint provided by DeepBI. Inside Power BI, you would use the "Get Data" function and select the appropriate source, such as a Web API or OData feed. You would then enter the connection credentials and endpoint URL supplied by your DeepBI account. After establishing the connection, you can load the data tables into Power BI's Power Query Editor for any initial transformations before building your custom dashboards.
In the grill accessories scenario, once the connection was live, the seller’s team built a few key models:
- A campaign and keyword performance table joined with listing score snapshots, so they could sort and filter by both traffic metrics and page quality.
- A time-series model that plotted ACoS, CTR, and CVR against major listing revisions (title restructure, image set update, A+ launch).
- A competitive radar chart that showed their listing score relative to the benchmark’s 81/100, alongside ad spend trends.
These views helped them see that investing in the listing first—and then gradually scaling ads—was a more sustainable path than continuing to pump traffic into a weak page. Connecting DeepBI data into Power BI is what enabled those kinds of structured, evidence-based decisions.
Best Practices for Maximizing Your Amazon Ads Analytics
Integrating your Amazon Ads data into Power BI is the first step; unlocking its full value requires a disciplined, strategic approach. To transform raw data into a competitive advantage, focus on a cycle of analysis, action, and refinement.
- Define Clear, Actionable KPIs: Move beyond vague goals. Tie specific metrics to different stages of the customer journey. For example, a low Click-Through Rate (CTR), such as below 0.35%, often indicates a problem with your main image's "visual hook." A low Conversion Rate (CVR), perhaps under 7%, may signal that your A+ content and detail page are failing to build trust and effectively communicate value. In the grill kit case, DeepBI’s listing score flagged a 0/25 in the A+ dimension and weak bullets, which matched the pattern of “CTR not terrible, but CVR consistently weak.” By defining KPIs that map directly to these stages—and visualizing them in Power BI—you can avoid blaming ads for what is essentially a page-level trust problem.
- Establish a Regular Review Cadence: Consistently monitor your performance dashboards to stay ahead of trends and issues. Go beyond default reports by leveraging Power BI’s advanced features. Use custom visuals to spot patterns that standard charts might miss, and build calculated columns or DAX measures to create bespoke metrics that reflect your unique business priorities. For the grill accessories seller, a weekly review of Power BI dashboards that combined DeepBI’s ad data and listing scores helped them see how each content change impacted CVR and ACoS over time. This cadence prevented them from reacting impulsively to short-term fluctuations and kept them focused on structural improvements.
- Implement Iterative Optimization: Treat analytics as a continuous feedback loop. When you make a change based on an insight—like updating a product's main image—track the results methodically. Monitor the impact on CTR over the subsequent 7-14 days to validate the effectiveness of your change and inform future decisions. In the grill kit example, the team did not overhaul everything at once. They restructured the title, then observed CTR changes; rebuilt bullets and tracked CVR; finally added a comprehensive A+ and watched post-click behavior again. Power BI dashboards powered by DeepBI data gave them a way to validate each step, rather than guessing whether the page was “better.”
- Maintain Strong Data Governance: The quality of your insights depends entirely on the quality of your data. Ensure accuracy and security by using official, secure API connections for data integration. This foundational practice ensures that your strategic decisions are based on reliable and trustworthy information. In cases like the grill accessories listing, relying on patched-together exports would have made it difficult to see a clear before-and-after pattern once the product page was improved. DeepBI’s structured pipeline into Power BI ensured that when the seller compared pre- and post-optimization performance, they could trust that differences were real and not artifacts of inconsistent data handling.
Taken together, these practices turn your analytics environment into a decision engine. Instead of repeatedly “fixing the ads” when ACoS spikes, you can use integrated views to confirm whether the constraint is actually upstream in keyword relevance, or downstream in listing content and overall conversion capacity.
Frequently Asked Questions (FAQs)
What types of Amazon Ads data can I integrate?
DeepBI allows you to integrate a comprehensive range of Amazon advertising data. This includes key performance indicators such as impressions, clicks, conversions, Total Advertising Cost of Sales (TACoS), and Advertising Cost of Sales (ACoS), providing a complete picture of your campaign performance directly within Power BI.
In practical terms, this means you can replicate and extend the kind of diagnostic process used in the grill accessories case: segmenting performance by campaign, keyword, or ASIN, and then aligning those segments with how strong or weak each corresponding listing is. Instead of seeing only that a campaign has “high ACoS,” you can drill into which products it supports and whether those product pages have the conversion fundamentals needed to justify more traffic.
How often is the data refreshed?
To ensure your analytics are always based on the most current information, DeepBI is capable of capturing and refreshing your Amazon Ads data in near real-time. This allows for timely decision-making and agile campaign adjustments without manual data pulls.
This near real-time refresh was crucial for the grill kit seller when they rolled out their new images and A+ content. As soon as changes went live, their Power BI dashboards began reflecting updated CTR and CVR trends. That responsiveness helped them confirm that the listing overhaul was moving them in the right direction, instead of waiting weeks to see whether their subjective impression of “a better-looking page” translated into measurable improvement.
Can I combine Amazon Ads data with other data sources in Power BI?
Yes. Once DeepBI integrates your Amazon Ads data into Power BI, you can leverage the full capabilities of the Power BI platform. This includes combining your advertising data with other business data sources, such as inventory, sales, or financial data, to create comprehensive, cross-functional dashboards.
In the grill parts scenario, the seller connected ad and listing performance to order volume and margin data. This allowed them to see not just that CVR improved after the page rebuild, but how that improvement translated into more stable revenue and a more sustainable TACOS. By layering costs, sales, and ad performance, they could evaluate whether further ad scaling made sense, given the product’s revised conversion capacity.
Is DeepBI compatible with all Amazon marketplaces?
DeepBI is designed exclusively for global Amazon sellers and supports over 20 Amazon marketplaces worldwide, including those in North America and Europe. This ensures you can consolidate and analyze your advertising performance across all the regions you operate in.
For brands selling similar SKUs across regions, this global coverage means you can compare how listing quality and ad performance interact in different markets. The underlying lesson from the grill accessories case—that you should not scale traffic into a weak page—applies whether you are selling in the US, Europe, or elsewhere, and DeepBI’s multi-market support lets you monitor that principle consistently.
What level of technical expertise is required?
DeepBI is built for business users, marketers, and brand managers, not just data engineers. The platform automates the complex and tedious aspects of data integration, transforming them into a streamlined process. This allows your team to focus on generating insights rather than managing complex data pipelines.
In the grill kit example, the team did not have to become Power BI or API specialists overnight. DeepBI handled the connection and data structuring, and the business users could then work with intuitive dashboards and listing scores to understand where their real bottlenecks were. The technical work stayed under the hood; the operational learning—“our listing doesn’t yet deserve more traffic”—was accessible to everyone involved in the account.
Conclusion: Empowering Your Amazon Advertising Strategy
Integrating Amazon Ads data into Power BI provides a powerful lens for understanding campaign performance, but insight without action is an incomplete strategy. The true competitive advantage emerges when these analytics are seamlessly translated into execution. This is where DeepBI closes the loop, transforming your data-driven discoveries into tangible improvements in your creative assets and listing content. By converting subjective operational experience into a data-driven evidence chain, you can move beyond reactive adjustments to a proactive, engineering-led optimization path.
The grill accessories seller’s journey illustrates this shift. They began by assuming “it must be the ads” and spent significant time tuning campaigns. Only when DeepBI’s scoring and integrated dashboards exposed a 42/100 listing—missing A+ content and relying on spreadsheet-like bullets—did they recognize that they were paying to expose page-level defects. After rebuilding the title logic, clarifying main images, restructuring bullets around buyer value, and designing a full A+ story, their ad traffic started to land on a page capable of converting. Power BI, powered by DeepBI data, allowed them to see and validate this transformation step by step.
This approach turns listing optimization from a manual, unpredictable process into a dynamic, iterative cycle that responds directly to market feedback. Instead of relying on trial and error, you can systematically improve the core drivers of ad performance—CTR and CVR—based on a clear understanding of your data. In the evolving landscape of e-commerce, leveraging a full-funnel intelligent system like DeepBI is no longer a luxury but a necessity for locking in a winning edge. To transform your analytics from a reporting tool into an execution engine, explore how DeepBI can become the intelligent decision-making brain for your brand—so that before you pour more budget into ads, you know your Amazon product pages truly deserve the traffic.