


Introduction: Why Amazon Statistics Matter for Sellers
Amazon is not just another sales channel for brands. It is a data-dense retail system where search ranking, advertising efficiency, fulfillment speed,, price competitiveness, review quality, and visual conversion all shape seller outcomes. For Amazon sellers, the most useful Amazon statistics are not vanity numbers; they are planning inputs. They help estimate market size, benchmark category pressure, decide whether Amazon FBA is worth the cost, and identify which operating levers can protect seller profitability.
The key lesson is simple: Amazon growth rewards sellers who turn marketplace facts into operational decisions. A seller who understands where Amazon is growing, how independent sellers perform, how Prime members behave, and which revenue segments are expanding can build a more disciplined listing, ads, and inventory strategy.
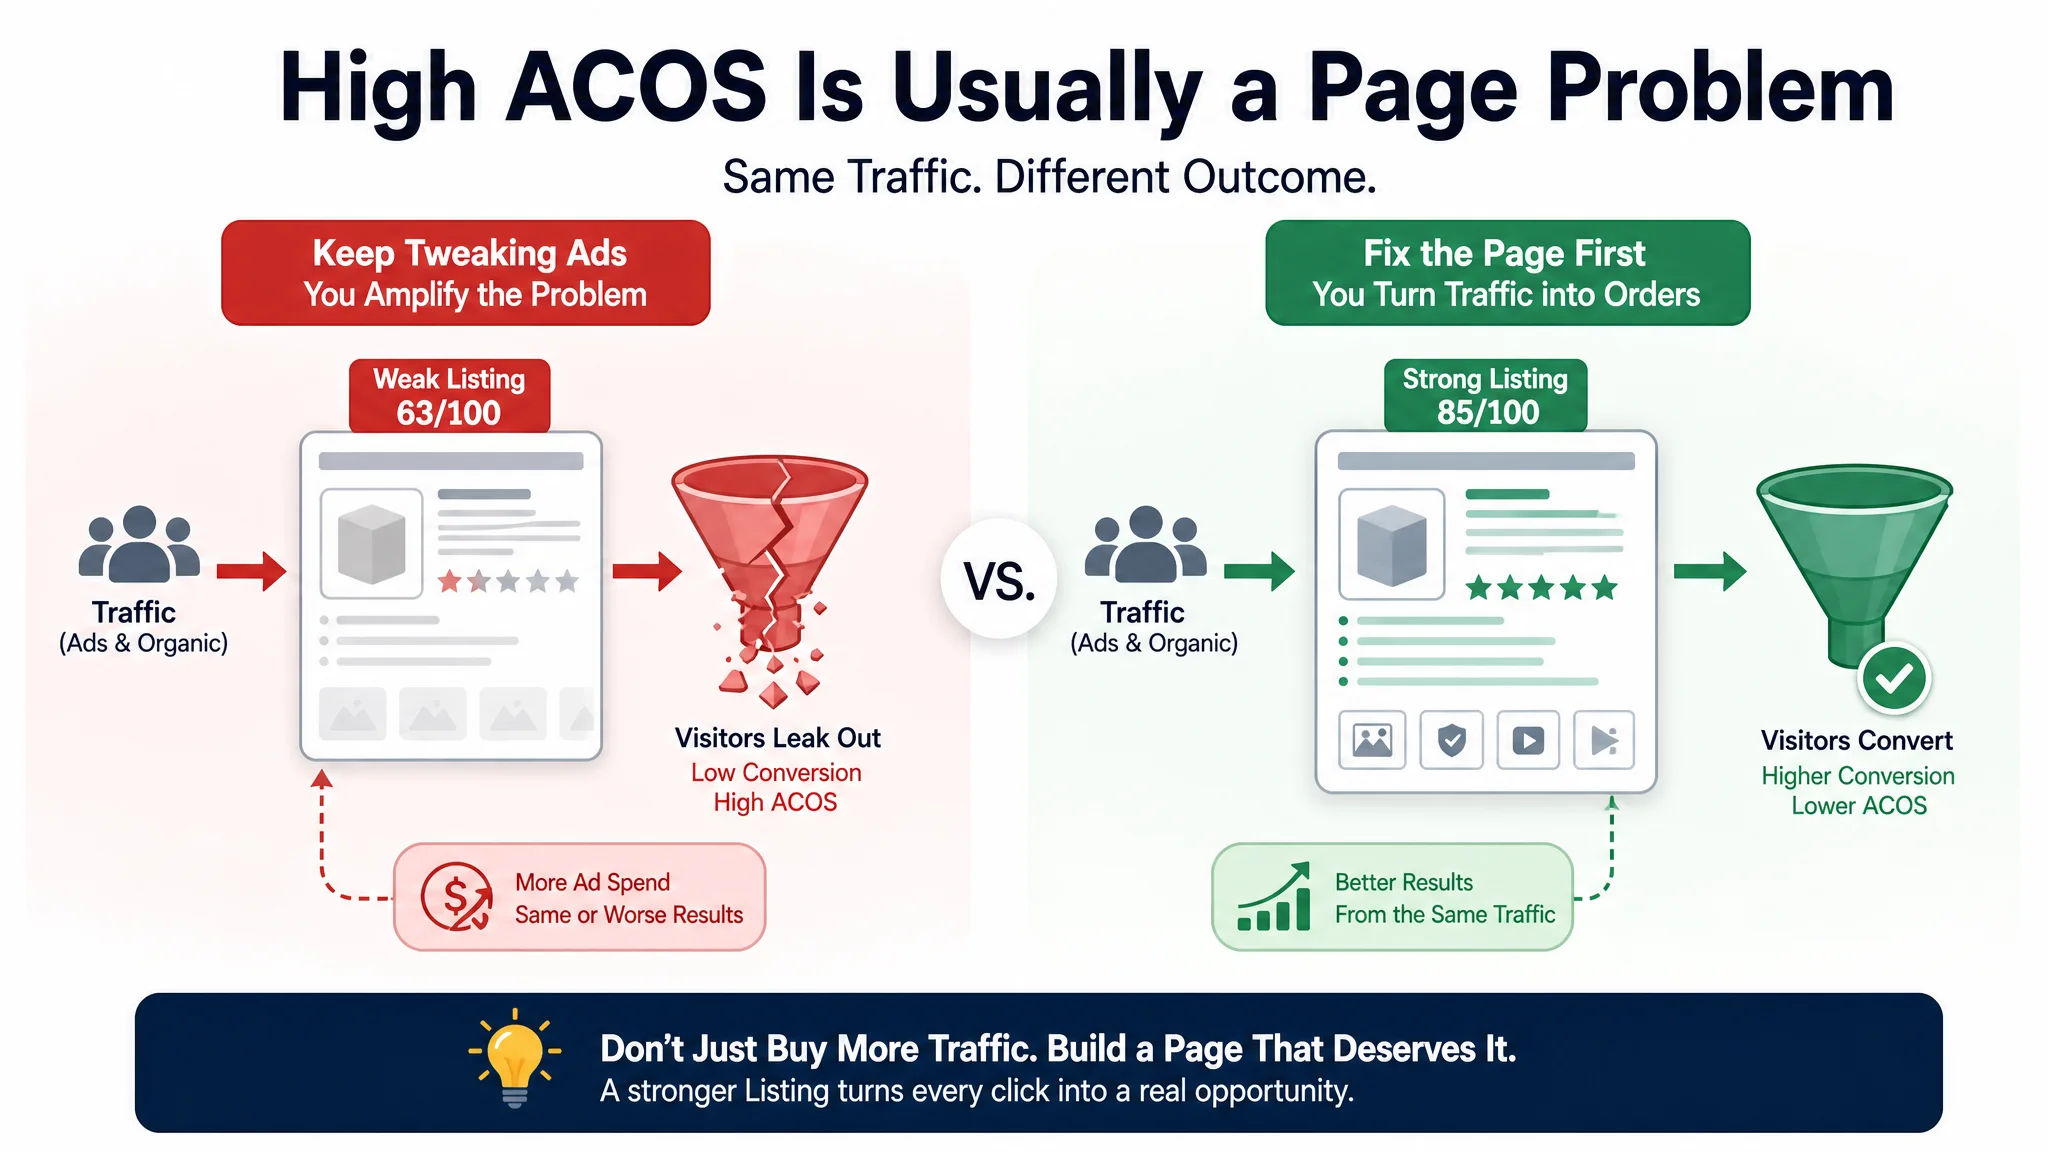
This is not just theory. In one grill-accessories project, the seller had plenty of traffic data, ad reports, and category benchmarks. But because those “facts” were never translated into a clear judgment about the product page’s real weaknesses, they kept treating high ACOS as an advertising issue instead of a conversion issue. Only when the data was reframed—showing a 20+ point gap between their Listing score and the category benchmark—did their decisions shift from “tune bids” to “rebuild the page.” That pivot turned statistics from background noise into concrete operating actions.
Amazon's Market Dominance and Global Reach
E-commerce Market Share
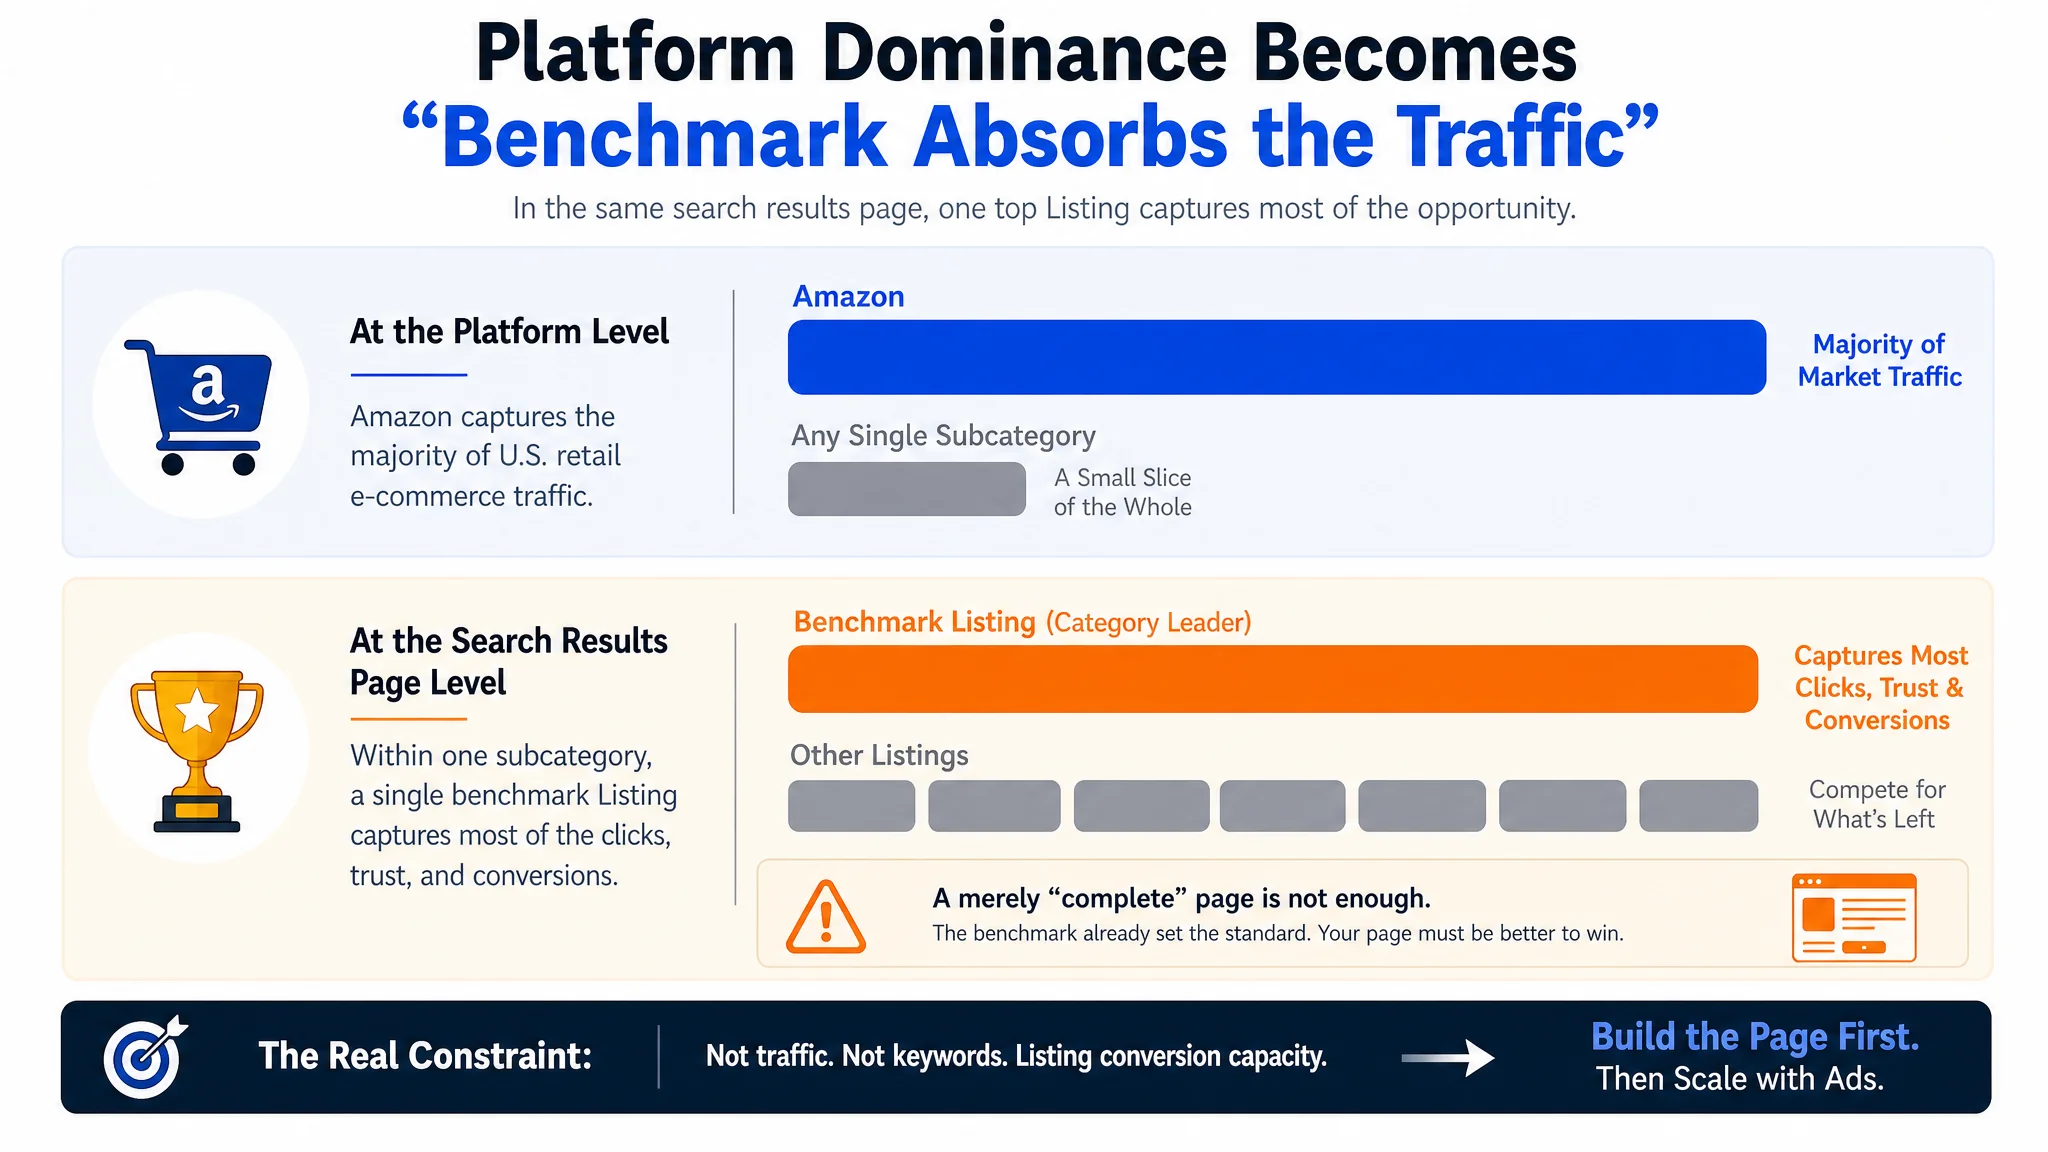
Amazon remains the largest U.S. retail e-commerce player by a wide margin. Statista's 2025 ranking puts Amazon at 40.5% of U.S. retail e-commerce market share, far ahead of Walmart at 9.2%. eMarketer's 2024 forecast similarly expected Amazon to account for 40.4% of U.S. retail e-commerce sales, equal to about $491.65 billion. Some broader market summaries use a lower estimate near 37.6%, but all credible estimates point to the same strategic conclusion: Amazon controls well over one-third of U.S. online retail.
For sellers, this market share means two things. First, Amazon is often where purchase intent concentrates. Second, competition is intense because the same traffic pool attracts brands, private-label sellers, resellers, and Amazon's own retail operation. DeepBI's Competitive Benchmark capability is useful here because it does not treat market share as an abstract macro number. It compares a seller's listing against high-competitiveness ASINs in the same marketplace and category, then highlights gaps in main image, title, bullet points, and A+ content.
In the grill-parts case, this competitive reality showed up very concretely. The seller’s Flavorizer Bar & heat-deflector kit was operating in a subcategory dominated by a single benchmark Listing that had stronger titles, more professional images, richer A+ content, and far more reviews. The marketplace wasn’t just “big”; it was structurally tilted toward whoever had the most convincing page. Once DeepBI scored both listings—63/100 for the seller vs 85/100 for the benchmark—it became obvious that in a platform where one player already sets a high standard, a merely “complete” page is not enough. Market dominance at the platform level translates into micro-level pressure on every keyword and every ASIN, which is why benchmarking is not a luxury; it’s a survival tool.
Global Footprint and User Base
Amazon also gives sellers a global expansion path, though the opportunity is uneven by marketplace. Amazon Global Selling routes sellers into major regions including North America, Europe, the Middle East, and Asia-Pacific. Amazon's India Global Selling page lists 18 global marketplaces available to Indian exporters, while seller-focused marketplace guides commonly count more than 20 active Amazon marketplaces worldwide.
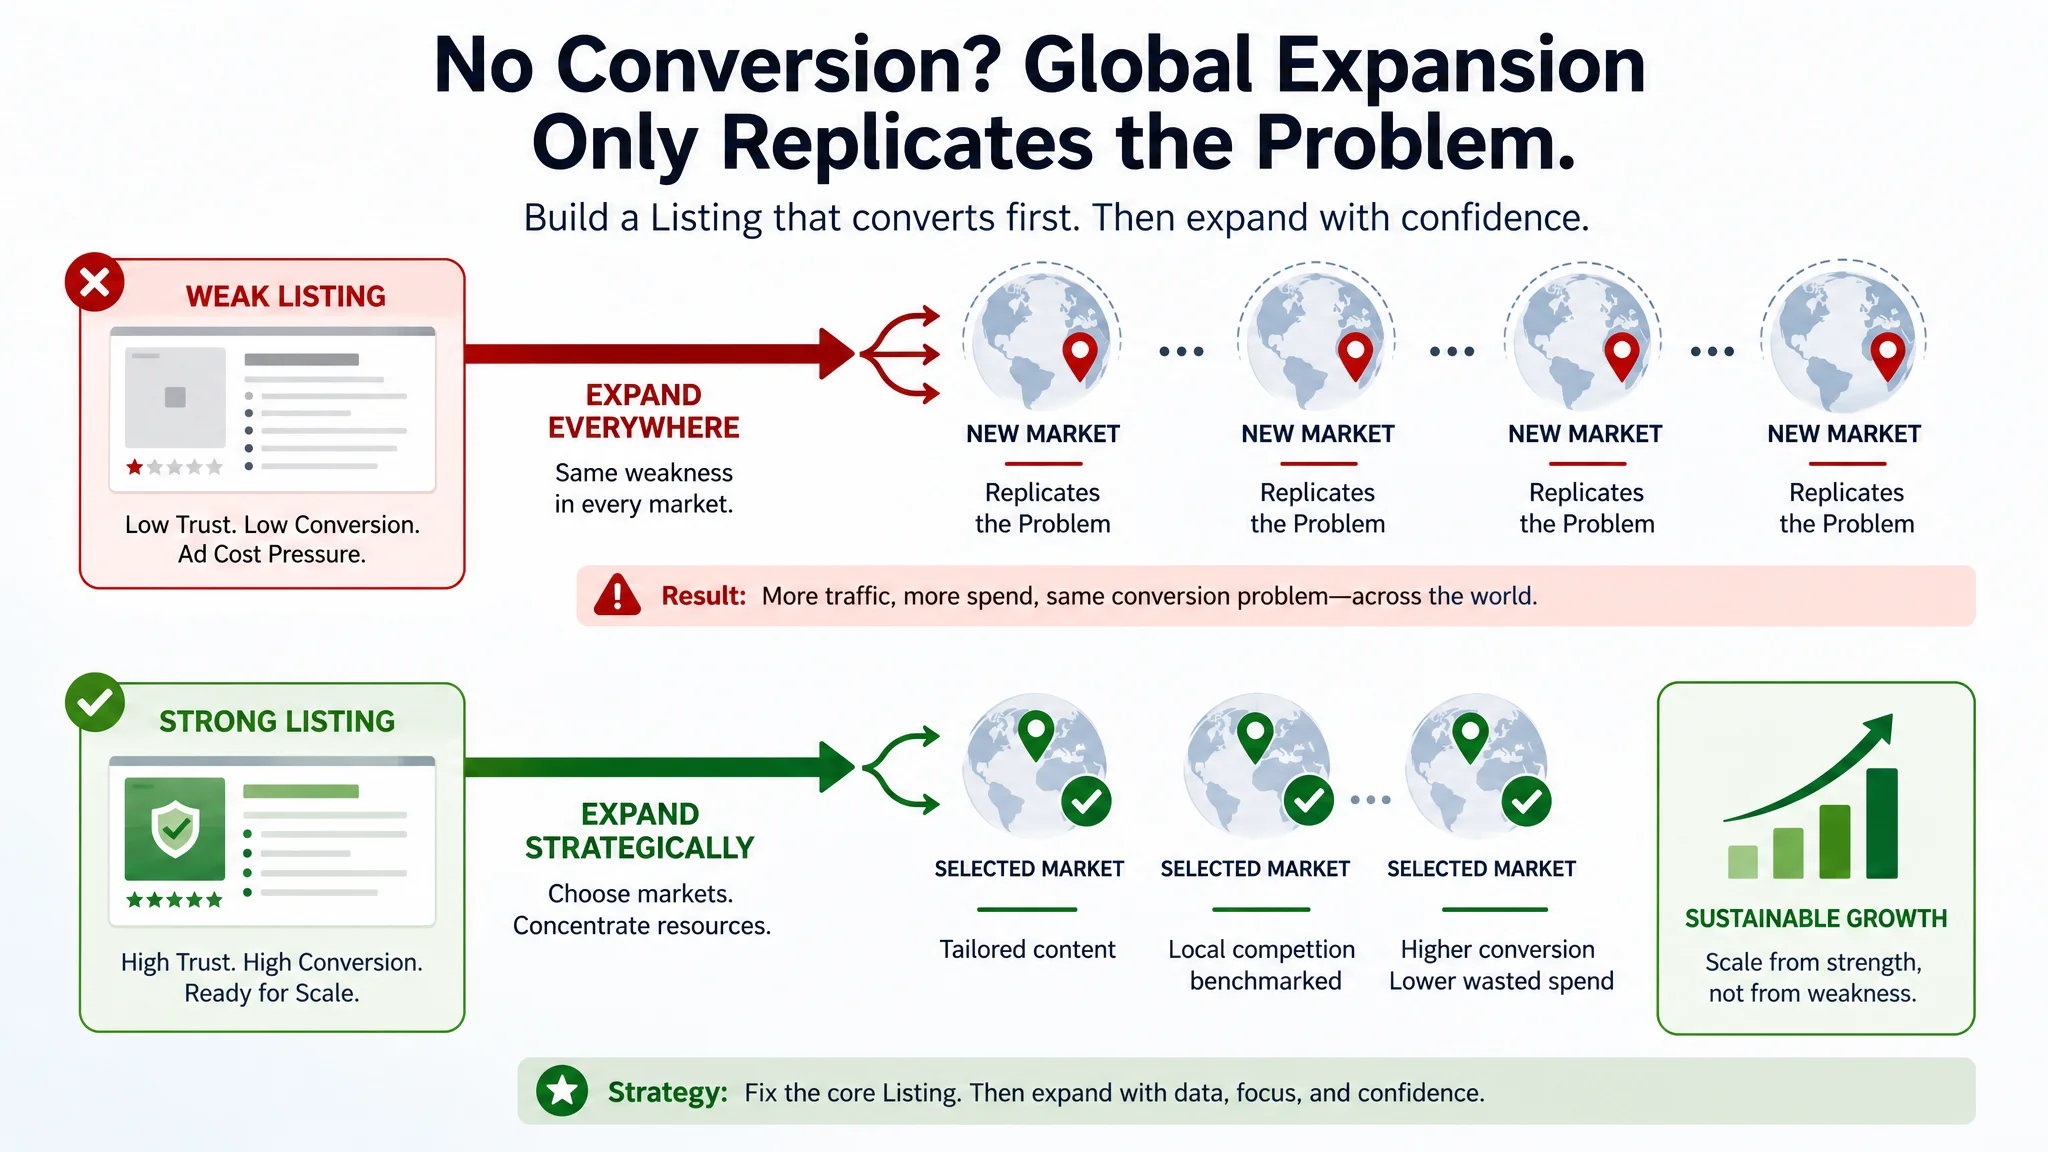
The practical point is that "global" should not mean "everywhere at once." Sellers should sequence expansion by demand, fulfillment feasibility, compliance requirements, and content localization. DeepBI supports this by normalizing marketplace-specific data such as language, currency, time zone, and local competitive benchmarks, so sellers can see whether an international opportunity is large enough to justify the operational load.
A pattern from the grill-accessories case helps illustrate this. The seller was focused on the U.S. marketplace, yet felt pressure from both local competitors and the idea of “eventually going global.” But DeepBI’s diagnosis showed that the U.S. Listing itself lagged far behind the benchmark on title clarity, visual trust, and A+ depth. Expanding to more marketplaces with the same weak page would simply replicate the same conversion problems in more regions. The insight was straightforward: until your primary-market Listing can withstand side-by-side comparison with top local competitors, “global reach” just multiplies operational stress. Data on marketplace count and regional demand only becomes useful after you know your core page can convert.
The Amazon Seller Ecosystem: Key Figures
Number of Sellers and Growth
Amazon's independent seller base is central to the marketplace. Amazon's own seller statistics report that more than 60% of sales in Amazon's store come from independent sellers, most of them small and medium-sized businesses. In its 2025 Small Business Empowerment Report coverage, Amazon also reported that U.S. independent sellers averaged more than $375,000 in annual sales and that more than 75,000 independent sellers surpassed $1 million in sales, up 36% from 2024.
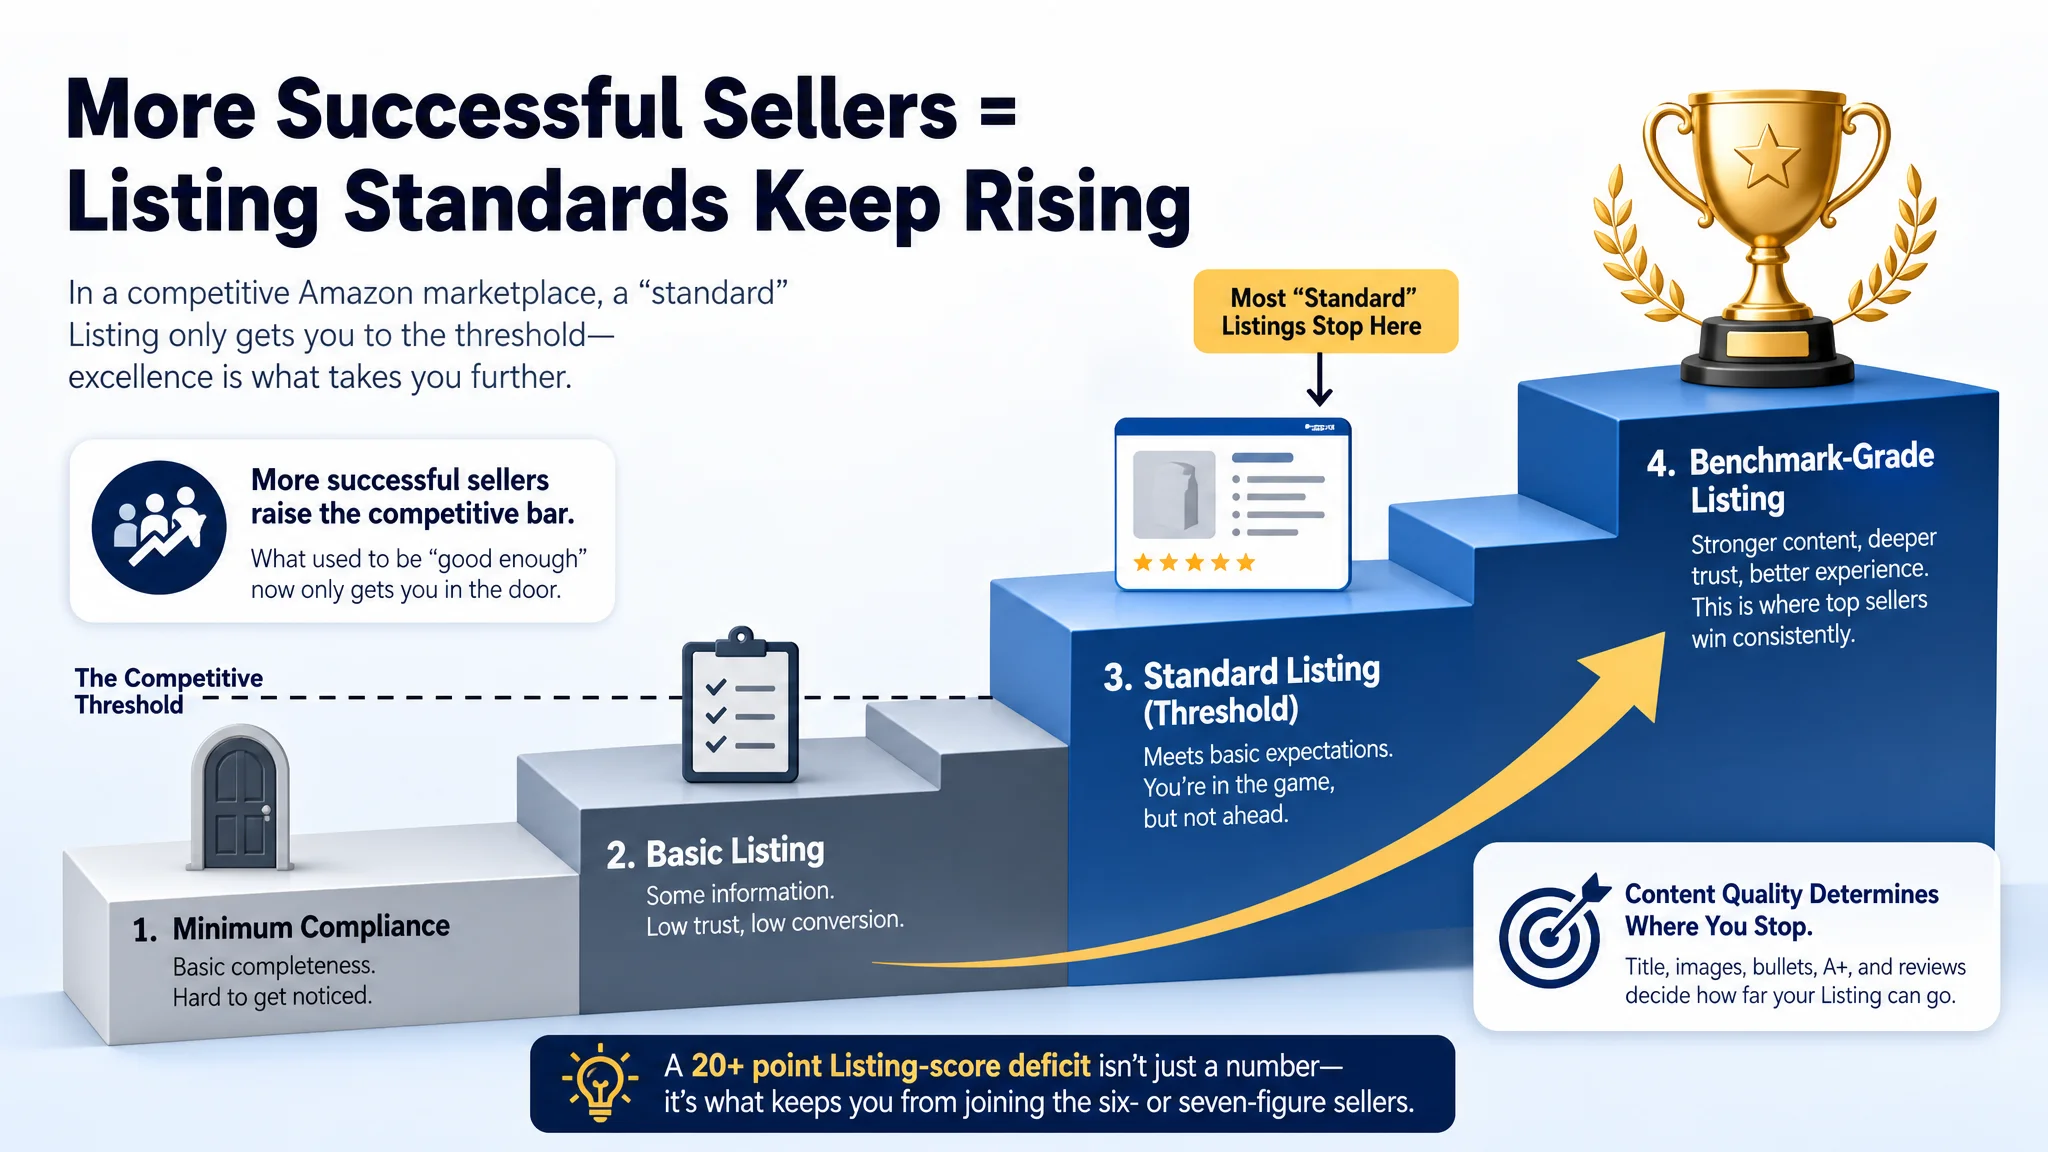
Those numbers show opportunity, but they also show why average sellers cannot rely on generic listing work. If thousands of sellers can cross seven figures, the competitive bar for images, titles, ad structure, and fulfillment consistency keeps rising.
This rising bar was exactly what the grill-part seller ran into. On paper, they were doing what many SMB sellers do: using FBA, running Sponsored Products, filling in bullets, and adding an A+ module. But in a category where the benchmark Listing had a dense A+ layout, proof-rich imagery (calipers, thickness visuals, installation scenes), and over a thousand reviews, their “standard” content translated into a 22-point Listing-score deficit. The presence of so many successful independent sellers didn’t just mean “there’s room for everyone”; it meant that what used to count as “good enough” content now only qualifies as the minimum. Without closing that content gap, the seller’s aspiration to join the six- or seven-figure group was structurally constrained, regardless of how much they adjusted bids.
Third-Party Seller Success and Profitability
Seller profitability depends on category economics, fees, advertising cost, inventory discipline, and conversion rate. Amazon's 2025 Form 10-K shows why the seller ecosystem matters financially: third-party seller services reached $172.162 billion in 2025, up from $156.146 billion in 2024. These services include commissions, fulfillment fees, shipping fees, and other seller services.
For sellers, the risk is that revenue growth can hide margin erosion. A product may sell well while profit is diluted by FBA fees, returns, coupons, CPC inflation, or poor conversion. DeepBI's Intelligent Scoring and Multi-dimensional Diagnosis are designed for that problem: they identify which listing elements are suppressing click-through rate or conversion rate, then prioritize fixes that can improve organic ranking and reduce dependence on paid traffic.
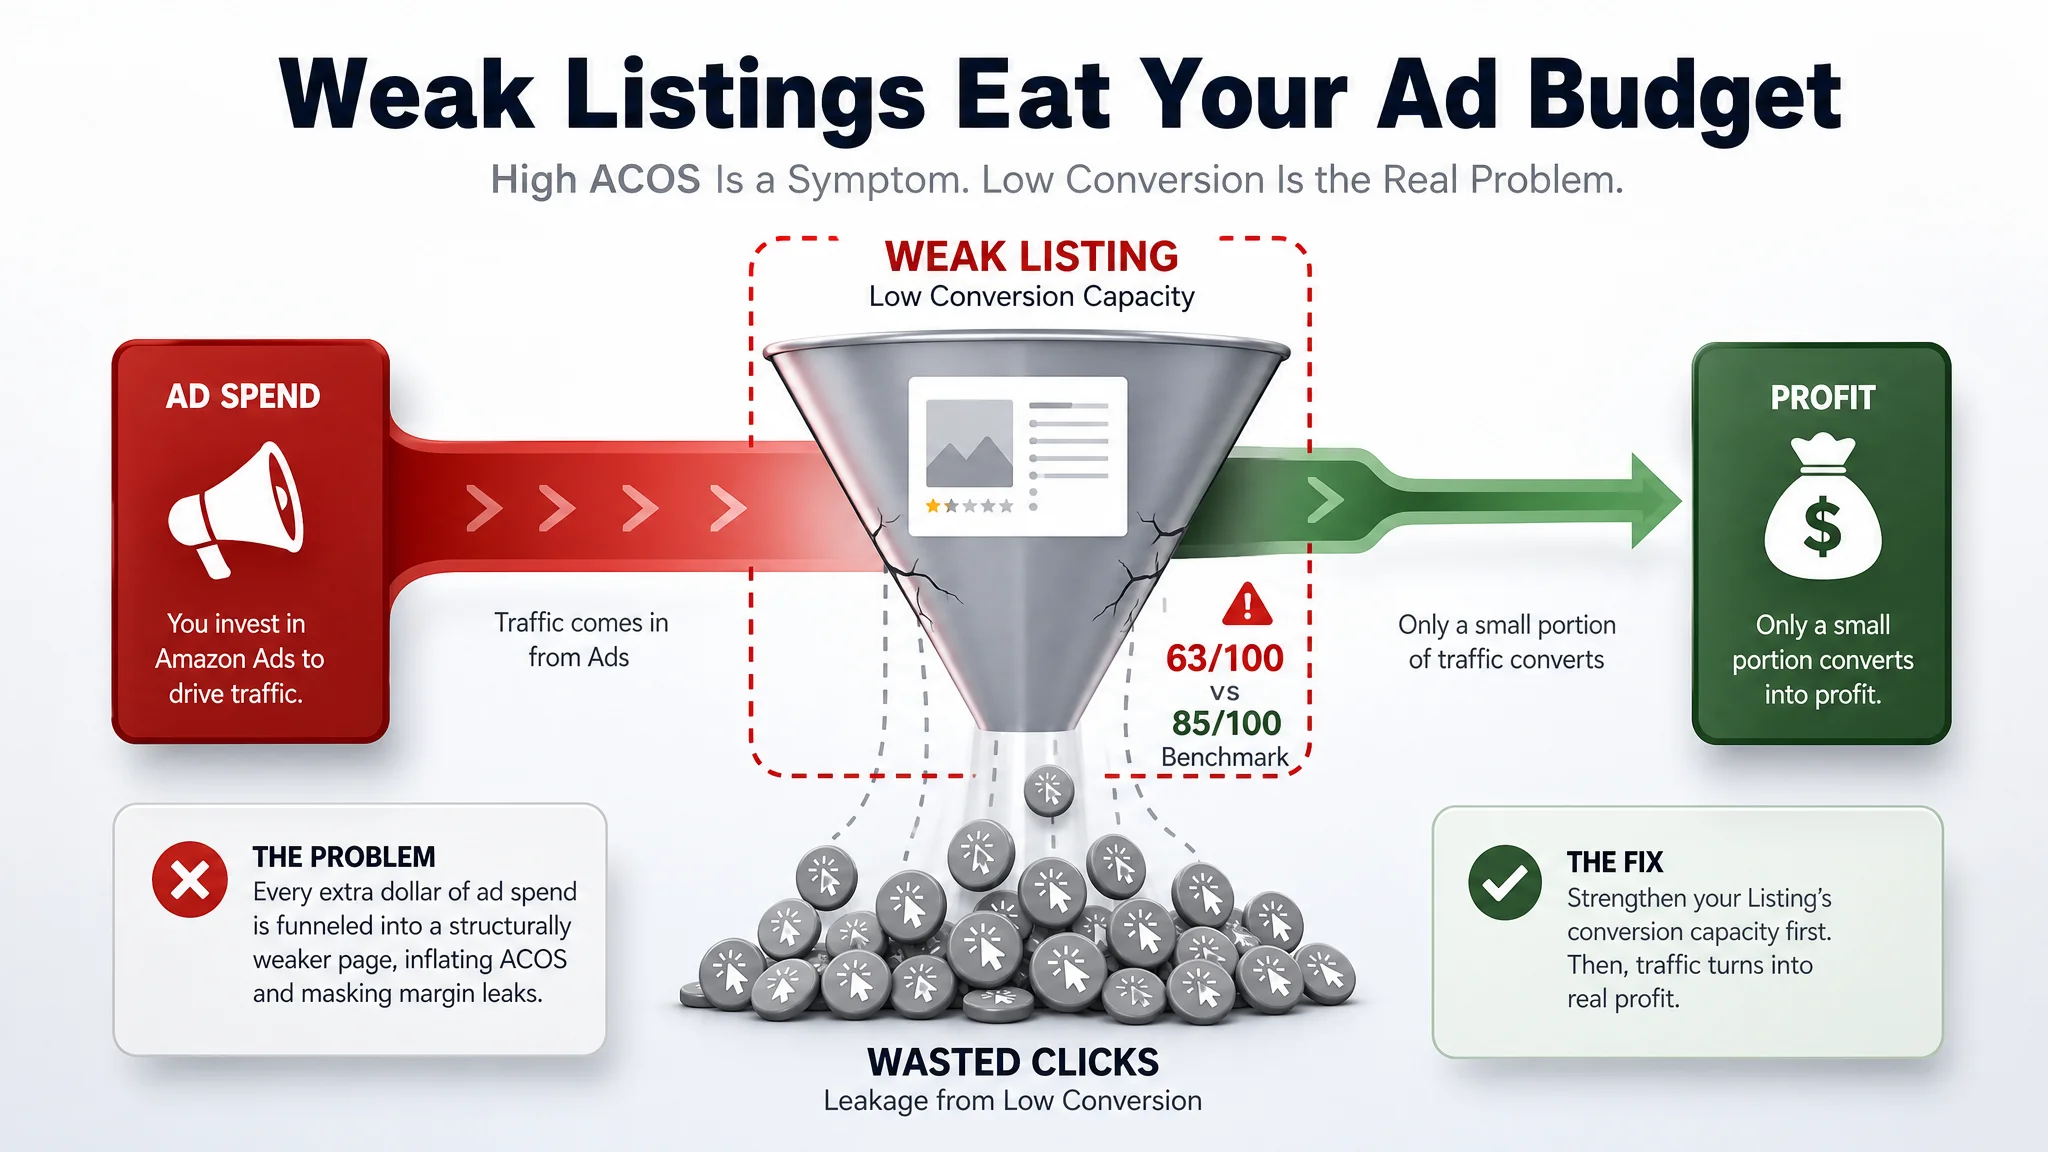
In the grill-accessories example, profitability pressure surfaced as “ads are getting too expensive.” ACOS kept creeping up, and the team assumed the root cause was rising CPCs and imperfect keyword setups. But once DeepBI overlaid Listing scores with ad performance, a different story appeared: the page’s conversion capacity was the real bottleneck. The title read like a warehouse label full of part codes instead of a buyer-facing hook, the image set looked more DIY than industrial-grade, the A+ content lacked a clear decision journey, and reviews lagged badly in both rating and volume. In that state, every extra dollar of ad spend was being funneled into a structurally weaker page, which in turn inflated ACOS and masked margin leaks. Only after recalibrating the Listing did ad spend start to translate into healthier revenue instead of just higher top-line with strained profit.
FBA Adoption and Benefits
Amazon FBA remains one of the most important operating choices for sellers because it connects fulfillment speed, Prime eligibility, customer trust, and operational scale. Third-party estimates vary, but industry seller reports consistently show FBA as the dominant fulfillment method among active Amazon sellers. The benefit is clear: sellers can outsource storage, pick-pack-ship, and customer-service workflows while aligning with Amazon customer expectations around speed and reliability.
The trade-off is cost. FBA is not automatically profitable; it is profitable when the listing converts, inventory turns, and ad spend remains disciplined. Sellers should evaluate FBA at the SKU level, not at the account level.
The grill-kit seller’s experience reinforces this SKU-level view. Their product was already using FBA, which gave them Prime eligibility and competitive delivery promises. Yet despite that fulfillment advantage, their page underperformed against the benchmark on almost every conversion dimension: title strength, main image trust, A+ proof, and review depth. FBA fees were being paid, but the Listing was not fully leveraging the trust that Prime can bring. As DeepBI’s diagnosis showed, FBA only creates economic value when the page can capture and convert the traffic that Prime status attracts. Otherwise, FBA can quietly become another fixed cost sitting behind a weak page, turning what should be an advantage into an unexamined margin drain.
Understanding Amazon Customers
Prime Membership and Purchasing Behavior
Prime is one of Amazon's strongest customer-retention engines. Amazon stated in the 2020 shareholder letter that it had 200 million Prime members worldwide. Independent research firms now estimate a larger U.S. Prime base, with CIRP estimating 200 million U.S. Prime customers as of the September 2025 quarter. Even when exact membership estimates differ, the seller implication is consistent: Prime shoppers expect speed, convenience, and low friction.
That behavior affects listings. Main images must communicate value instantly, titles must align with search intent, and A+ content must reduce purchase anxiety. DeepBI's Optimization Strategy Generation and AI Image and Text Generation can translate customer-facing gaps into concrete creative instructions, such as how to show product scale, use-case context, or differentiation in visual assets.
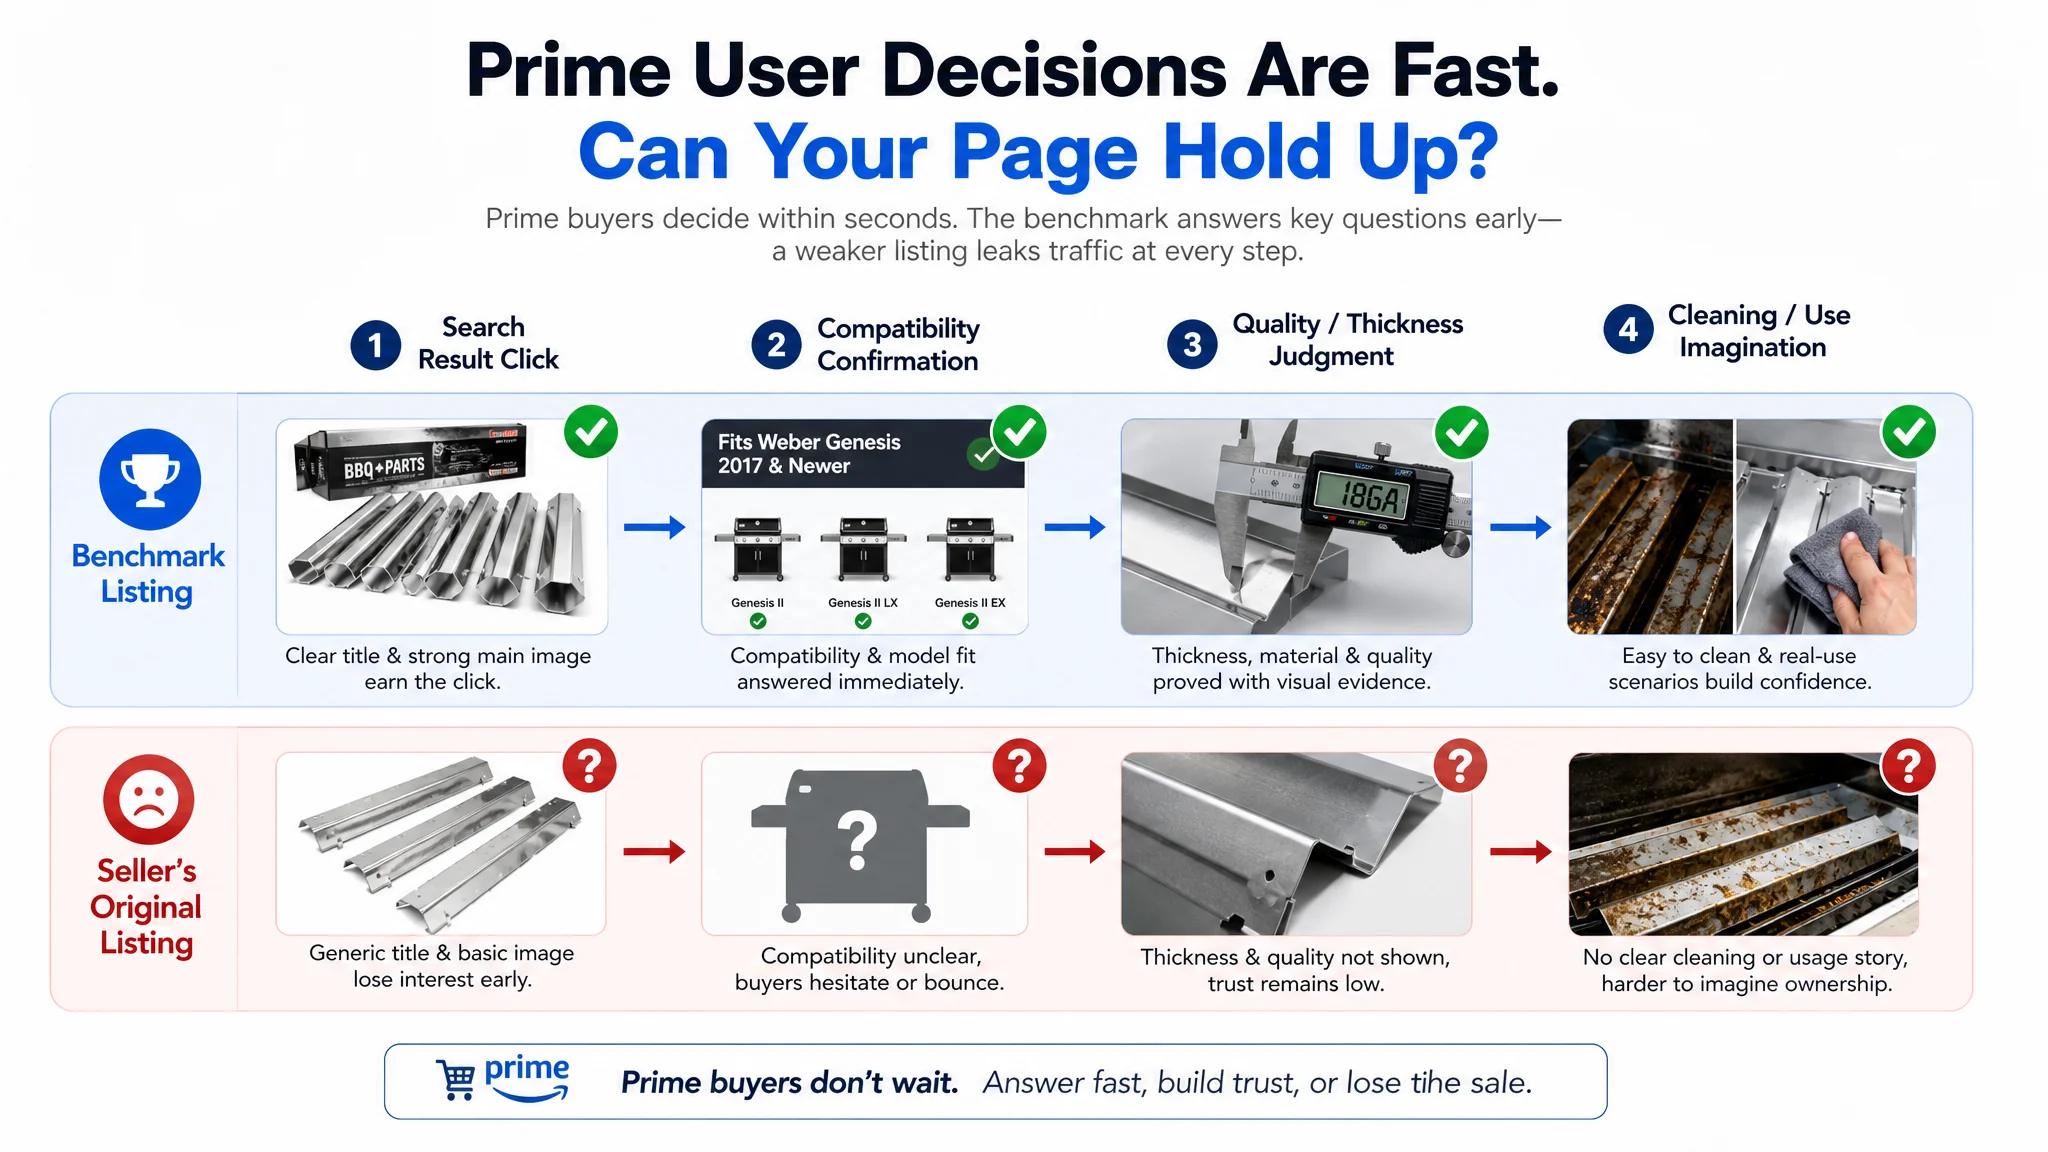
In the grill-kit project, Prime-oriented behavior showed up as intense page-level scrutiny. Customers were not just looking for a generic “Flavorizer Bars & Heat Deflectors” kit; they wanted assurance on compatibility, material quality, thickness, heat distribution, and ease of cleaning—within seconds. DeepBI’s comparison revealed that the benchmark Listing anticipated this behavior: its title clearly spelled out compatible Weber models and material specs, the main images showed in-grill installation and thickness measured with calipers, and the A+ modules visualized heat flow and before/after grill conditions. By contrast, the seller’s page gave Prime shoppers more work to do: decode part numbers, infer fit, and imagine performance from text alone. The result was predictable: even when ads brought in relevant Prime traffic, the combination of weaker visuals and vague titles caused buyers to hesitate, compare, and often select the benchmark product instead. For sellers, the lesson is that Prime customer expectations are not met by delivery speed alone; the Listing has to match that same standard of clarity and low friction.
Customer Loyalty and Trends
Amazon customers increasingly compare products across search results, ads, editorial content, social recommendations, and competitor marketplaces such as Walmart, TikTok Shop, Temu, and brand DTC sites. Loyalty is strong, but not passive. If a seller's price, delivery promise, reviews, or product page quality falls behind alternatives, the customer can switch quickly.
For Amazon sellers, the winning pattern is to combine customer behavior signals with disciplined testing. Track search terms, conversion rate, return reasons, review themes, and ad performance together. A listing update should not be judged by aesthetics alone; it should be tied to CTR, CVR, organic rank, TACoS, and sell-through.
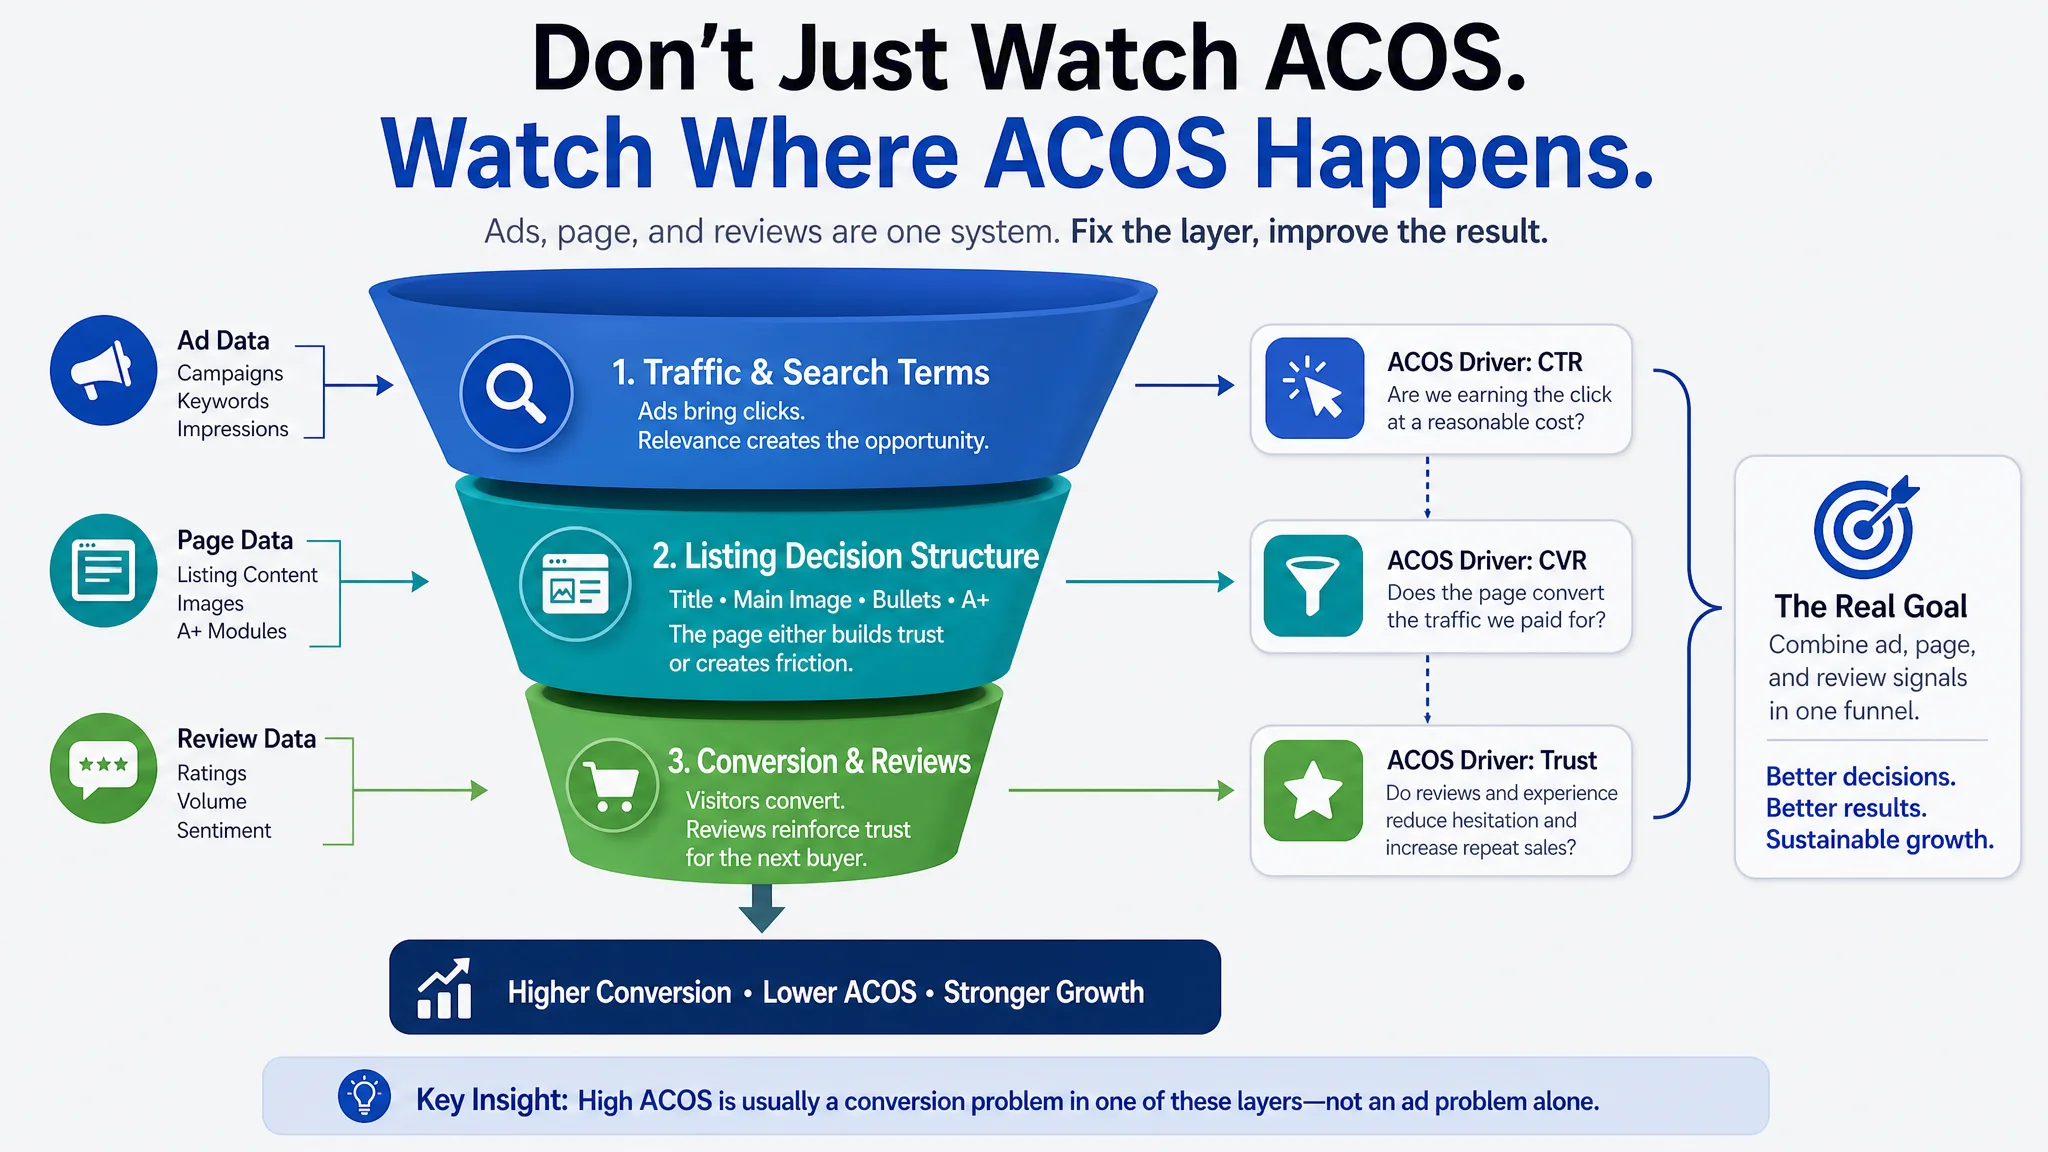
The grill-parts case illustrates what happens when this feedback loop is incomplete. The seller was monitoring ACOS and click metrics, but they weren’t systematically connecting those ad signals to on-page behavior such as bounce patterns, conversion gaps, or review sentiment. Instead, they kept iterating on keyword lists and bids, assuming that more granular targeting would eventually stabilize results. DeepBI’s multi-dimensional diagnosis forced these data streams together: Listing scores, benchmark comparisons, and ad performance all pointed to the same conclusion—this was a page-conversion failure, not a traffic-acquisition failure. Once the title logic, bullet narrative, and A+ visuals were rebuilt, the seller finally had a basis to run controlled tests: which new images lifted CTR, which bullet rewrites influenced CVR, and how review improvements changed both organic rank and paid efficiency. In other words, customer loyalty and behavior trends became actionable only when they were anchored to a structured testing framework.
Amazon's Financial Performance and Growth Drivers
Revenue and Sales Trends
Amazon's financial scale keeps expanding. In its Q4 2025 results, Amazon reported $716.924 billion in full-year 2025 net sales, up 12% from $637.959 billion in 2024. Segment sales were also broad-based: North America reached $426.305 billion, International reached $161.894 billion, and AWS reached $128.725 billion. Net income rose to $77.670 billion.
These numbers matter to sellers because Amazon is not growing only as a retailer. Its service ecosystem, advertising products, subscriptions, and cloud business all reinforce the marketplace. Sellers operate inside that system, paying for traffic, fulfillment, and visibility while trying to preserve margin.
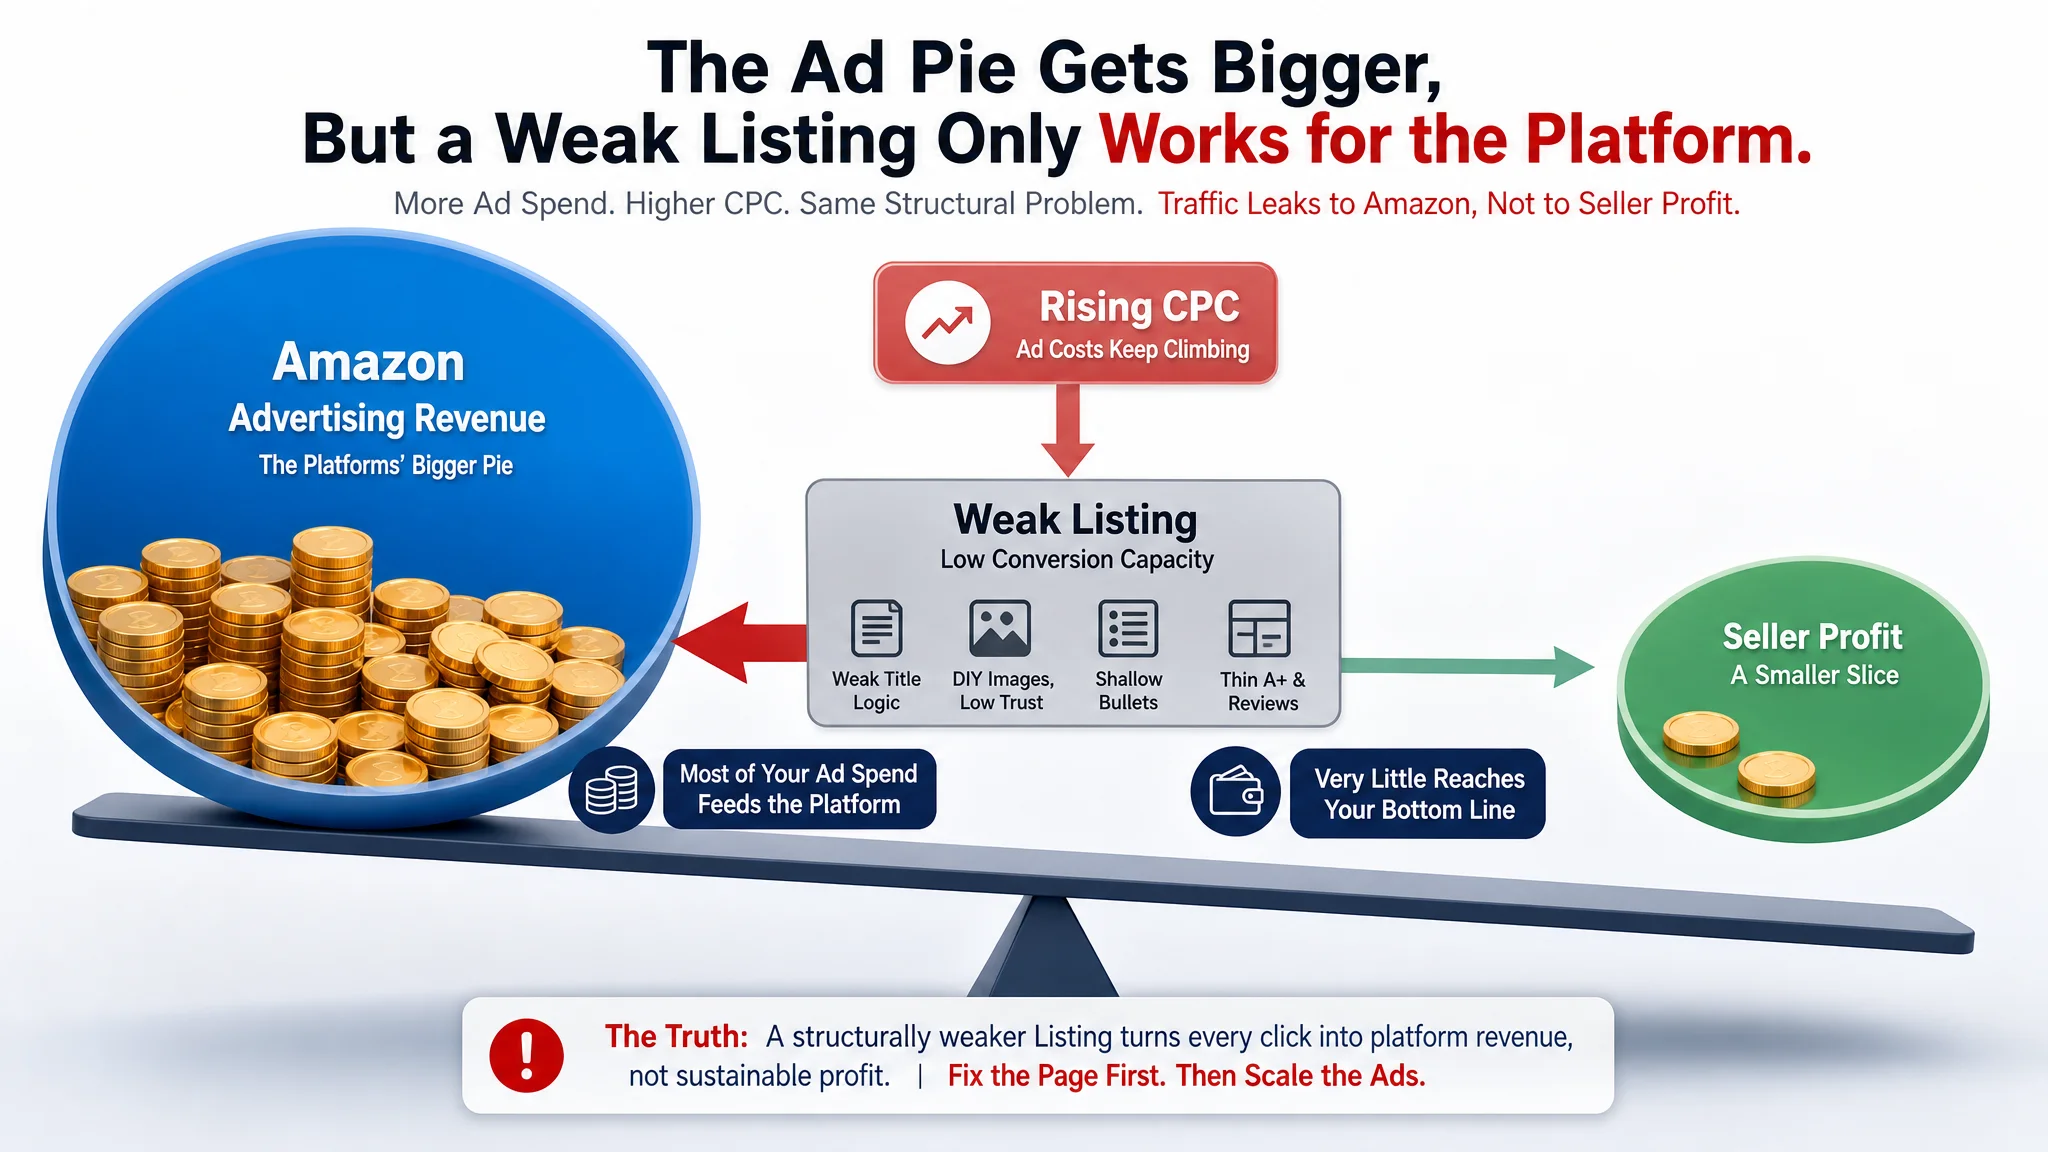
In practice, this means Amazon’s growth can amplify whatever structural issues exist in a seller’s business. In the grill-case, the growing importance of advertising as a revenue line showed up as sustained CPC pressure. As more sellers in the category embraced Sponsored Products and Sponsored Brands, the cost of each click rose—but not every seller’s page was equally ready to convert that traffic. Because the grill-kit Listing lagged behind its benchmark in both content quality and review trust, the broader growth of Amazon’s ad business translated for this seller into an uncomfortable reality: they were contributing more to Amazon’s advertising revenue than to their own bottom line. The structural imbalance—Amazon’s ecosystem scaling faster than the seller’s conversion capacity—only became visible once DeepBI’s diagnosis quantified the Listing gaps.
Key Growth Segments
Amazon's 2025 Form 10-K breaks net sales into groups that sellers should watch closely:
- Online stores: $269.287 billion
- Third-party seller services: $172.162 billion
- Advertising services: $68.635 billion
- Subscription services: $49.619 billion
- AWS: $128.725 billion
The most seller-relevant trend is the growth of third-party seller services and advertising services. Advertising services rose from $56.214 billion in 2024 to $68.635 billion in 2025, which signals that sponsored ads, display, and video advertising are becoming a larger part of Amazon commerce. For sellers, this means organic traffic and paid traffic can no longer be managed separately.
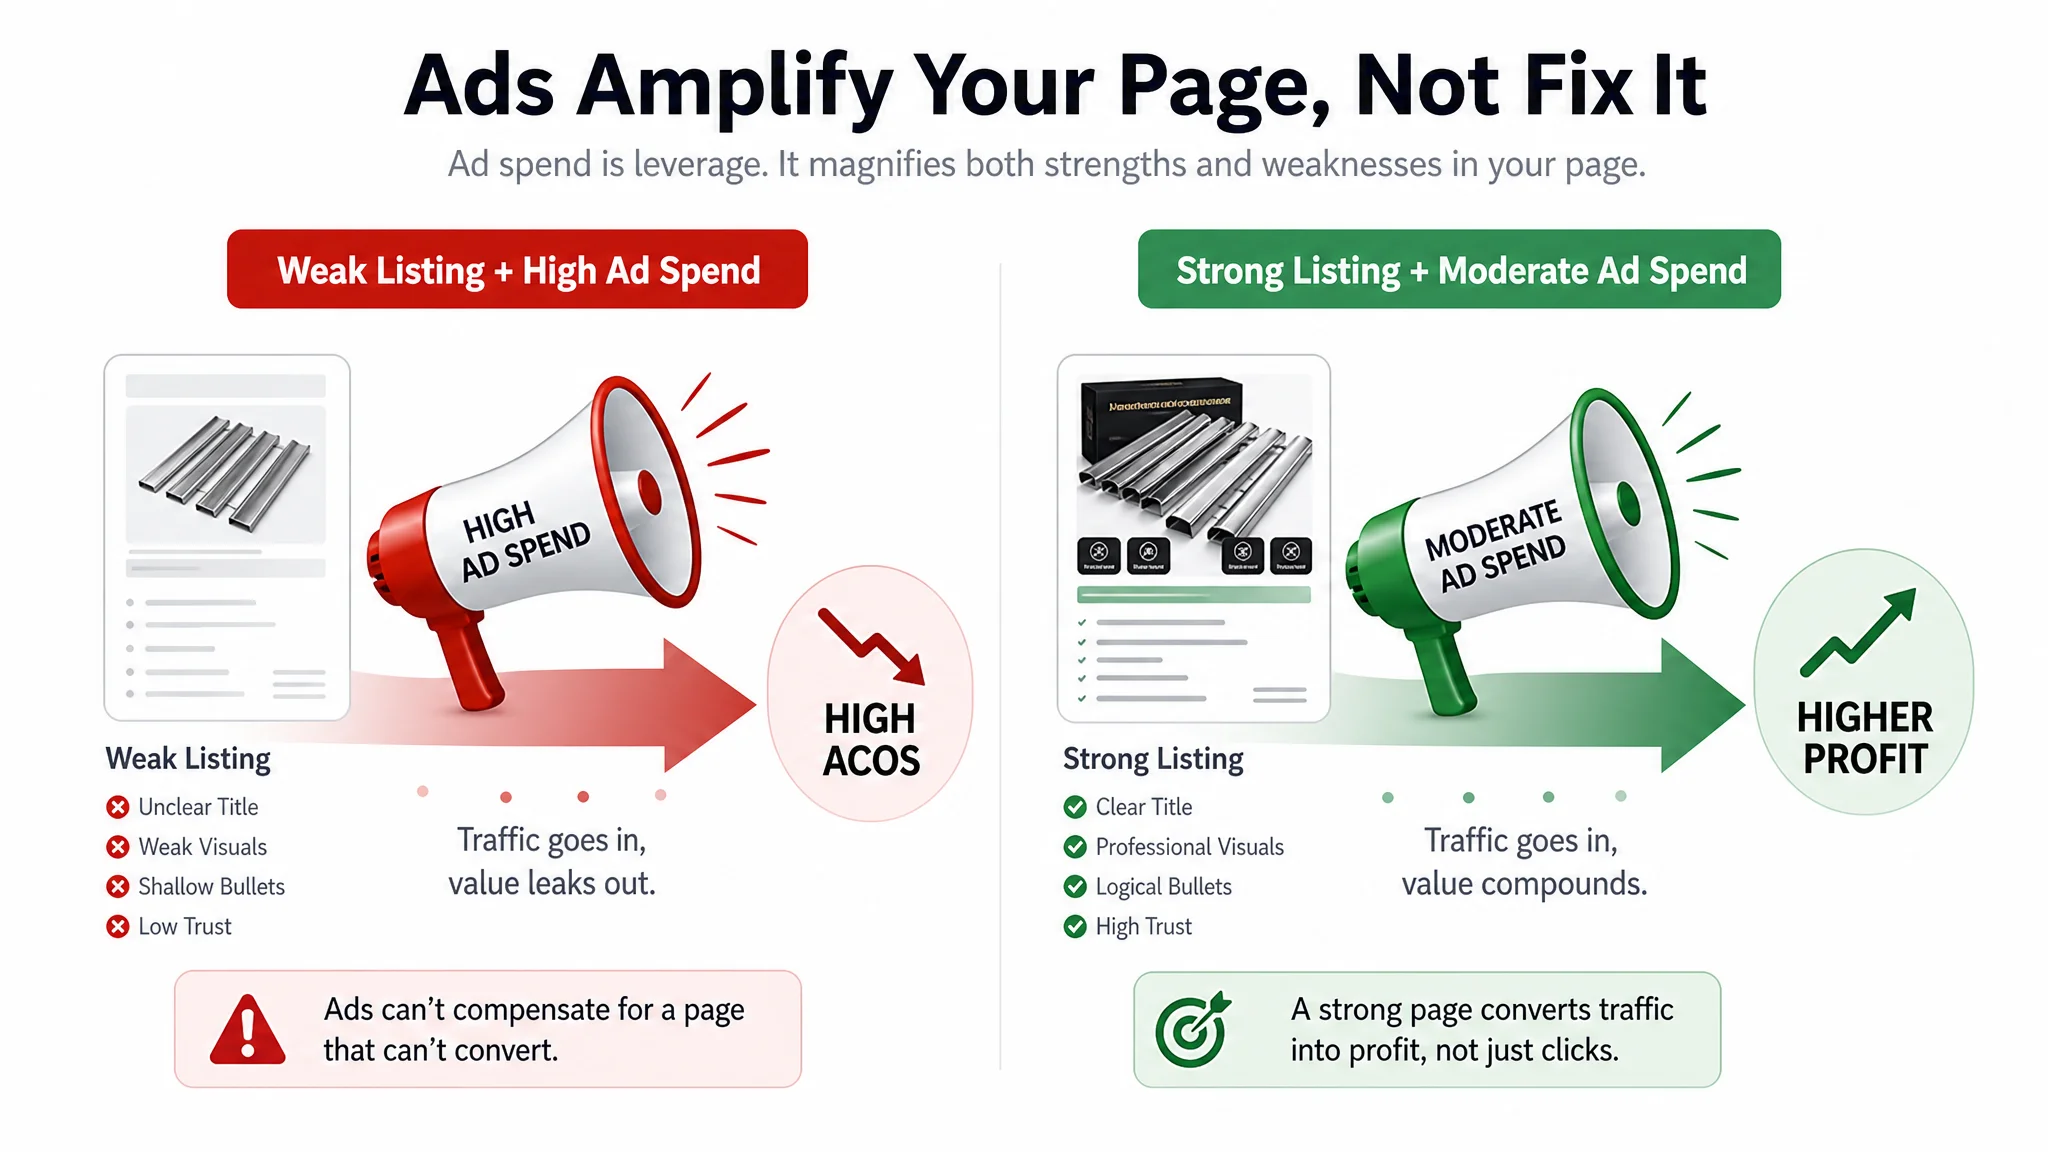
The grill-parts seller’s misdiagnosis—treating high ACOS as purely an ads problem—was a direct byproduct of this environment. As advertising becomes a larger revenue driver for Amazon, sellers naturally feel that “better ads” must be the answer. In this case, the team kept refining campaigns—experimenting with long-tail keywords, adjusting bids, and expanding negative lists—while their Listing score sat 22 points behind the benchmark. DeepBI’s side-by-side scoring made it clear that the page itself was consuming traffic: a warehouse-like title, DIY-looking main images, underpowered A+ modules, and a review gap all combined to suppress conversion. Once the Listing was strengthened, advertising and organic visibility began to work as a single system instead of competing levers. The broader growth of Amazon’s advertising services thus became a reminder: ad spend is leverage, but it magnifies both strengths and weaknesses in your page.
Navigating the Competitive Landscape and Future Opportunities
Competition and Market Dynamics
Amazon's own risk disclosures describe competition from physical retailers, e-commerce platforms, social networks, search engines, logistics providers, advertising companies, and AI-enabled discovery channels. That broad competitive set matches what sellers feel daily: Amazon is powerful, but customer discovery is fragmenting.
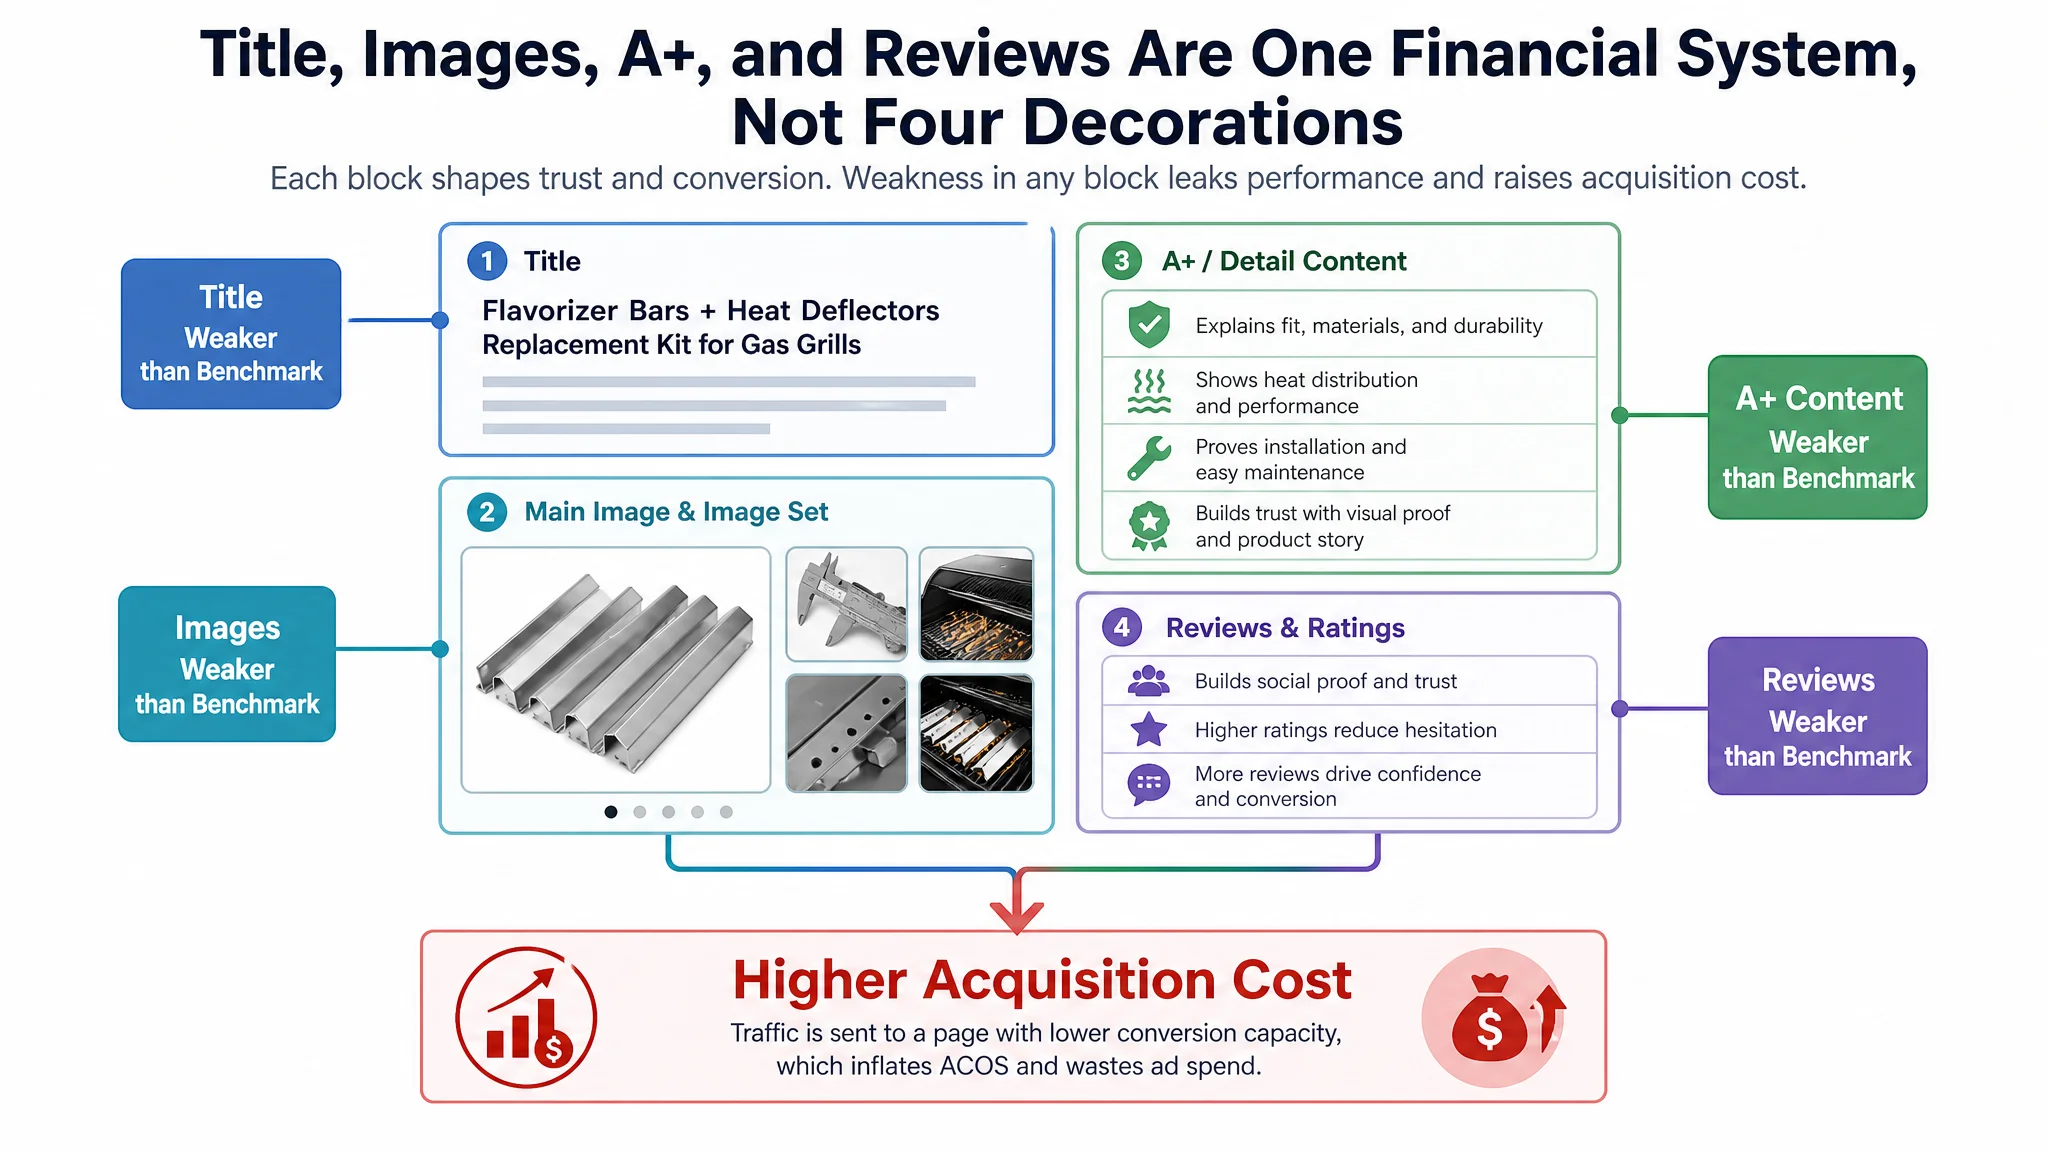
The competitive pressure inside Amazon is equally real. More sellers, more ads, more AI-generated content, and more price-sensitive shoppers make weak listings expensive. Sellers should treat listing quality as a financial control, not a design preference. If a main image underperforms, it raises CPC pressure; if bullet points fail to answer objections, it lowers conversion; if A+ content is generic, it wastes high-intent traffic.
The grill-accessories case is a textbook example of this “listing quality as financial control” mindset. Before DeepBI’s intervention, the seller viewed creative assets as something to “improve when we have time,” while ad campaigns were seen as the main business lever. Yet the diagnostic breakdown told a different story: the title scored 8 vs the benchmark’s 14, the A+ and detail content scored 17 vs 24, and reviews lagged both in rating and volume. Each of these deficits had a direct financial effect: the title reduced qualified clicks, the images undermined perceived professionalism, the A+ failed to complete the decision journey, and the reviews weakened trust at the final step. In combination, they forced the seller to pay more for each converting click. After the Listing was rebuilt—with a buyer-facing title, an industrial-grade image system, a structured bullet narrative, and proof-driven A+ modules—the same ad budget began to yield more stable orders. The competitive landscape hadn’t become less intense; the seller had simply turned listing quality into a lever instead of a liability.
Emerging Trends for Sellers
The best opportunities for sellers are not necessarily the flashiest channels. They are the areas where operational evidence is strongest:
- Use Amazon FBA selectively where Prime speed improves conversion enough to offset fees.
- Expand internationally only after confirming demand, local competition, and compliance.
- Treat advertising as a search-term discovery system, not only a sales lever.
- Watch social commerce competitors, but keep Amazon listing quality strong because high-intent search still converts.
- Build a feedback loop between listing changes and ad metrics.
DeepBI's Four-Layer Traffic Funnel Model in Ads Quant supports that loop by exploring keywords, competitor ASINs, and traffic opportunities systematically. This helps sellers move from reactive bid changes to structured traffic capture.
The grill-case shows what this shift from reactive to structured looks like in practice. Initially, the seller reacted to symptoms: rising ACOS, unstable orders, and a sense that “ads are harder than before.” Their response was to keep tuning campaigns without questioning whether the page itself deserved more traffic. DeepBI’s layered model reframed the problem: at the top, keyword and traffic coverage were sufficient; in the middle, the Listing’s decision structure was weak; at the bottom, review trust was thin. Once these layers were visible, actions became sequenced rather than chaotic. The team paused aggressive bid scaling, focused first on raising the Listing score—closing the title, image, and A+ gaps—and only then re-opened ad expansion, using Ads Quant to analyze which queries now converted better under the improved page. This is what “emerging opportunities” often look like in real operations: not chasing the newest channel, but using structured evidence to decide which layer of your existing Amazon funnel deserves attention first.
Leveraging Data for Success with DeepBI
The statistics above point to one operating truth: Amazon rewards sellers who can convert data into execution. DeepBI is an Amazon-focused, AI-powered optimization system that connects diagnosis, strategy generation, content production, delivery, and performance feedback across Listing, Ads Quant, and Organic Traffic.
For listing work, DeepBI benchmarks competitors, scores content quality, and converts weak points into executable optimization instructions. For visual assets, it can turn product DNA and competitor evidence into image-generation briefs. For advertising, it links listing changes to CTR, CVR, TACoS, and search-term performance, so sellers can see whether a creative or content update actually improved commercial outcomes.
That matters because Amazon statistics are only useful when they change decisions. A seller does not need more dashboards for their own sake. They need a system that can identify where revenue is leaking, define the next action, and measure whether the action worked.
The grill-accessories project shows each of these steps in a concrete way:
- Diagnosis: DeepBI’s Listing scoring exposed a 22-point gap versus the category benchmark, with specific weaknesses in title clarity, main image professionalism, A+ storytelling, and review trust.
- Strategy generation: Rather than vaguely saying “improve images,” the system outlined a full visual and text logic—front-loaded compatibility and material in the title, industrial-grade hero images, a seven-point bullet narrative from fit to maintenance, and A+ modules that visualized heat distribution, thickness, and before/after transformation.
- Content production: The seller’s creative team used these structured briefs to rebuild the page—not to make it “prettier,” but to align each module with a decision step: click, evaluate, trust, and commit.
- Performance feedback: Once the new Listing went live, Ads Quant helped track how CTR and CVR shifted by keyword and ad group, revealing which search terms benefitted most from the improved page and where further tuning was needed.
Most importantly, DeepBI helped correct a fundamental misdiagnosis. What the seller had labeled an “ad cost problem” turned out to be a structural page-conversion problem. Without that correction, no amount of statistical awareness—about Amazon’s market share, Prime base, or ad revenue growth—would have translated into better decisions. With it, the same ecosystem data became a backdrop for targeted, measurable changes.
Conclusion: Strategic Insights for Amazon Sellers
Amazon remains the dominant U.S. e-commerce platform, a massive global marketplace, and a financial engine with fast-growing third-party seller and advertising businesses. Independent sellers generate more than 60% of Amazon store sales, but the same scale that creates opportunity also creates intense competition.
For Amazon sellers, the path forward is data-driven execution: know the market, quantify the seller economics, understand Prime-driven customer expectations, and connect listing optimization with advertising and organic traffic outcomes. Tools like DeepBI help turn those Amazon statistics into practical decisions, giving sellers a clearer way to compete, protect profitability, and build durable Amazon growth.
The grill-parts case is a reminder that these principles operate at the ASIN level, not just in boardroom slides. A seller who blamed rising ACOS on “expensive ads” discovered, through structured diagnosis, that their real constraint was a weaker Listing competing against a benchmark that had already mastered title logic, visual proof, and trust-building. Once they rebuilt their page’s conversion capacity, ads stopped feeling like a pure cost and started functioning as leverage.
For every seller reading Amazon’s facts and figures, the question is the same: are you using those statistics to justify more budget, or to challenge whether your pages are truly ready for the traffic you already have? The difference between those two approaches is often the difference between growth that compounds and growth that quietly erodes your margin.