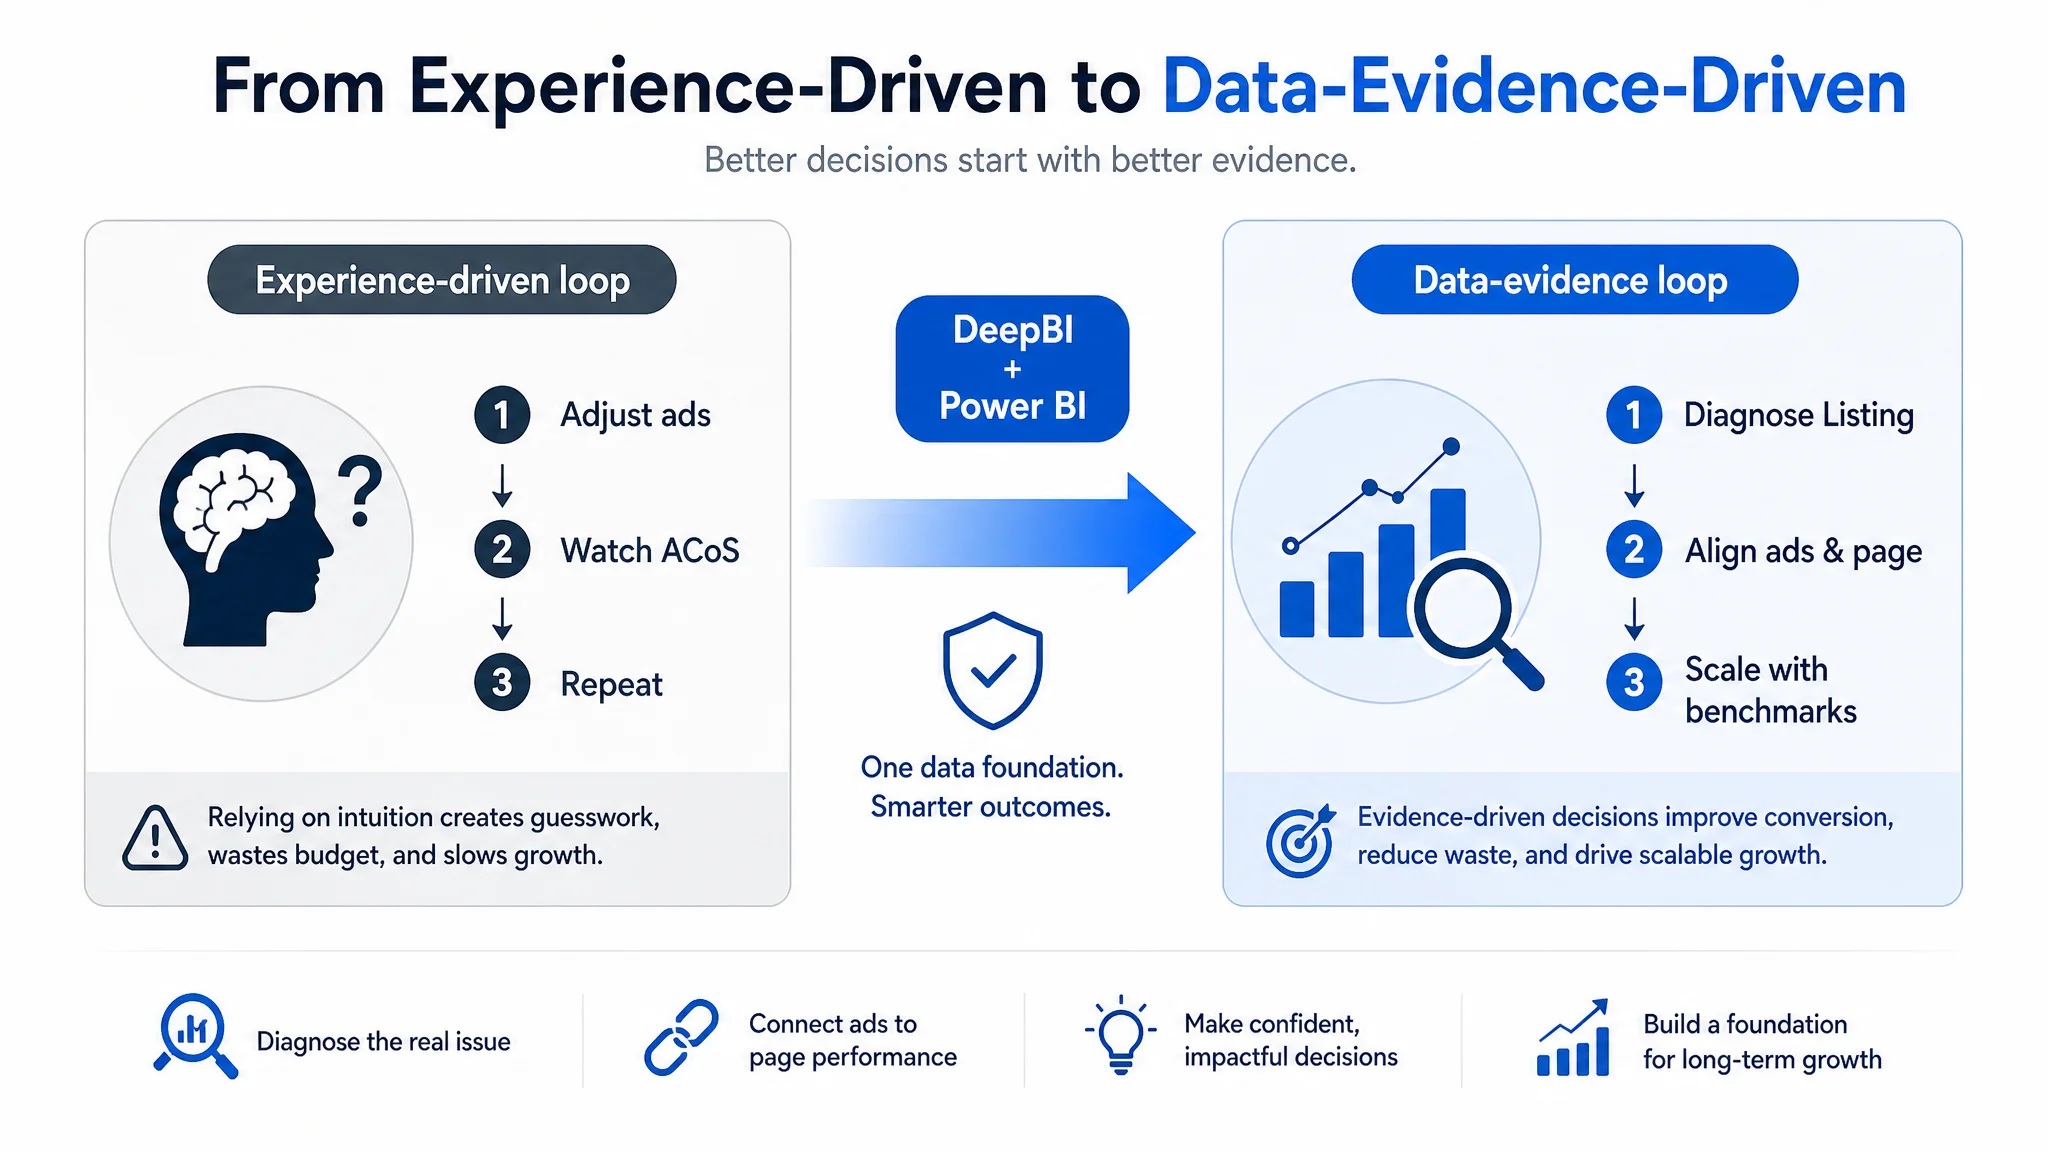
The Challenge of Native Amazon Ads Reporting
Limitations of Amazon's Built-in Tools
While the Amazon Advertising Console provides essential baseline data, sellers aiming for scalable growth quickly encounter its inherent limitations. The platform's reporting capabilities often operate in silos, making it difficult to perform a comprehensive diagnosis of the traffic funnel. For instance, an operator might see a low Click-Through Rate (CTR) but cannot definitively link it to a specific main image defect without manual, time-consuming analysis.
This kind of disconnection is not theoretical. One seller who approached DeepBI was convinced their “Amazon ads just don’t work” because spend was rising and orders were unstable. Inside Amazon’s native reports, they saw uncomfortable ACoS, fluctuating TACoS, and some ad groups with poor CTR—but there was no concrete way, within those built-in views, to tie a low CTR back to a weak thumbnail, a confusing title, or a misaligned keyword. Their internal discussions stayed stuck at the surface level of “bids, budgets, keywords” because there was no structured bridge from the ad metrics to what was actually happening on the product page.
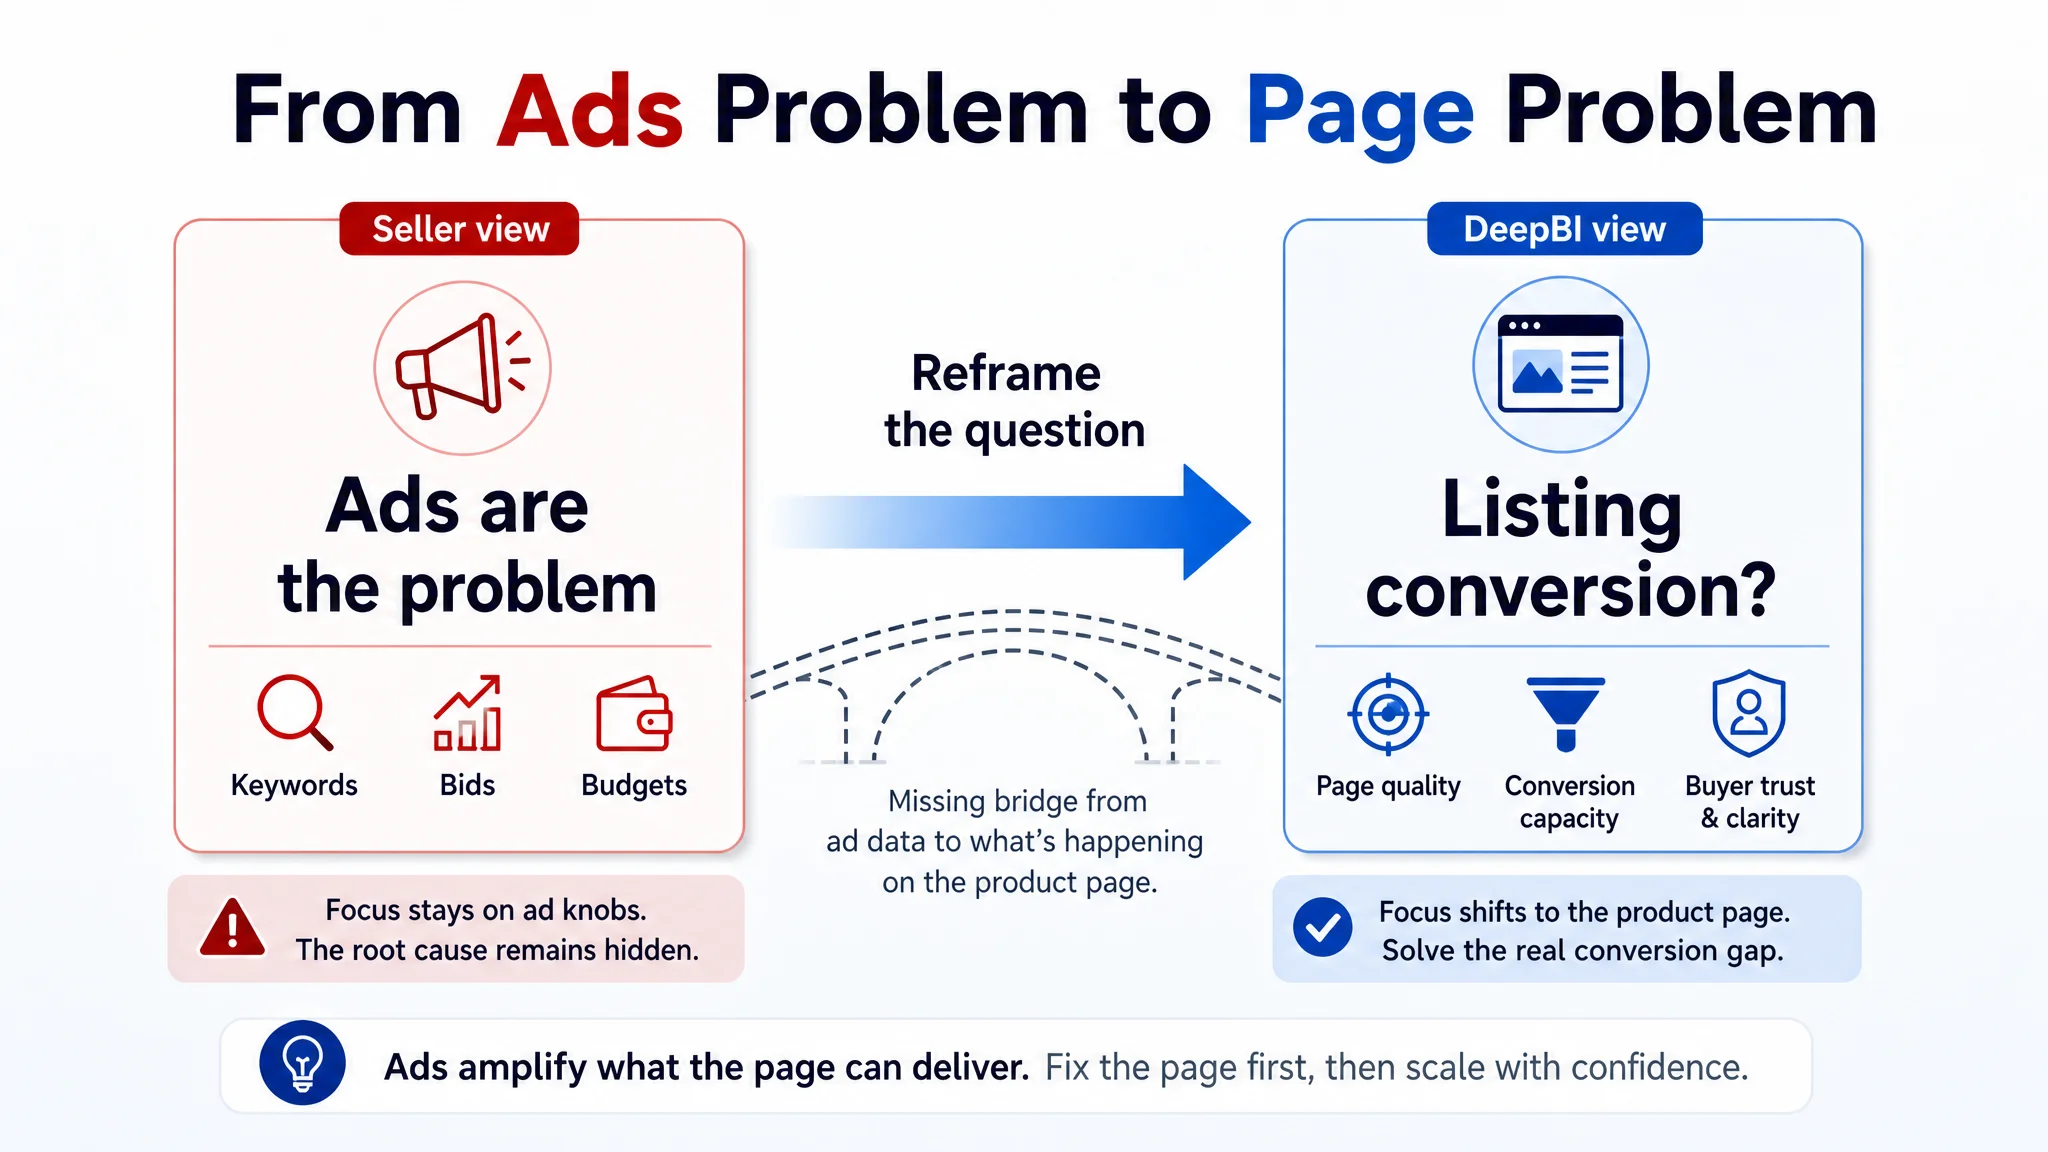
This fragmented approach means optimization often relies on subjective judgment and personal experience rather than quantifiable data. Decisions are made based on what "looks good" rather than what is proven to sell, leading to wasted resources on ineffective visual or copy changes. The entire operational workflow—from diagnosis and planning to production and delivery—remains disconnected, preventing a clear view of how one action impacts overall performance.
The Need for a Unified Data View
To overcome these challenges, a unified data view is essential. Breaking down the silos between operational stages allows for the creation of an end-to-end intelligent optimization system. Instead of treating advertising metrics and listing content as separate domains, a unified platform connects them to establish clear cause-and-effect relationships.
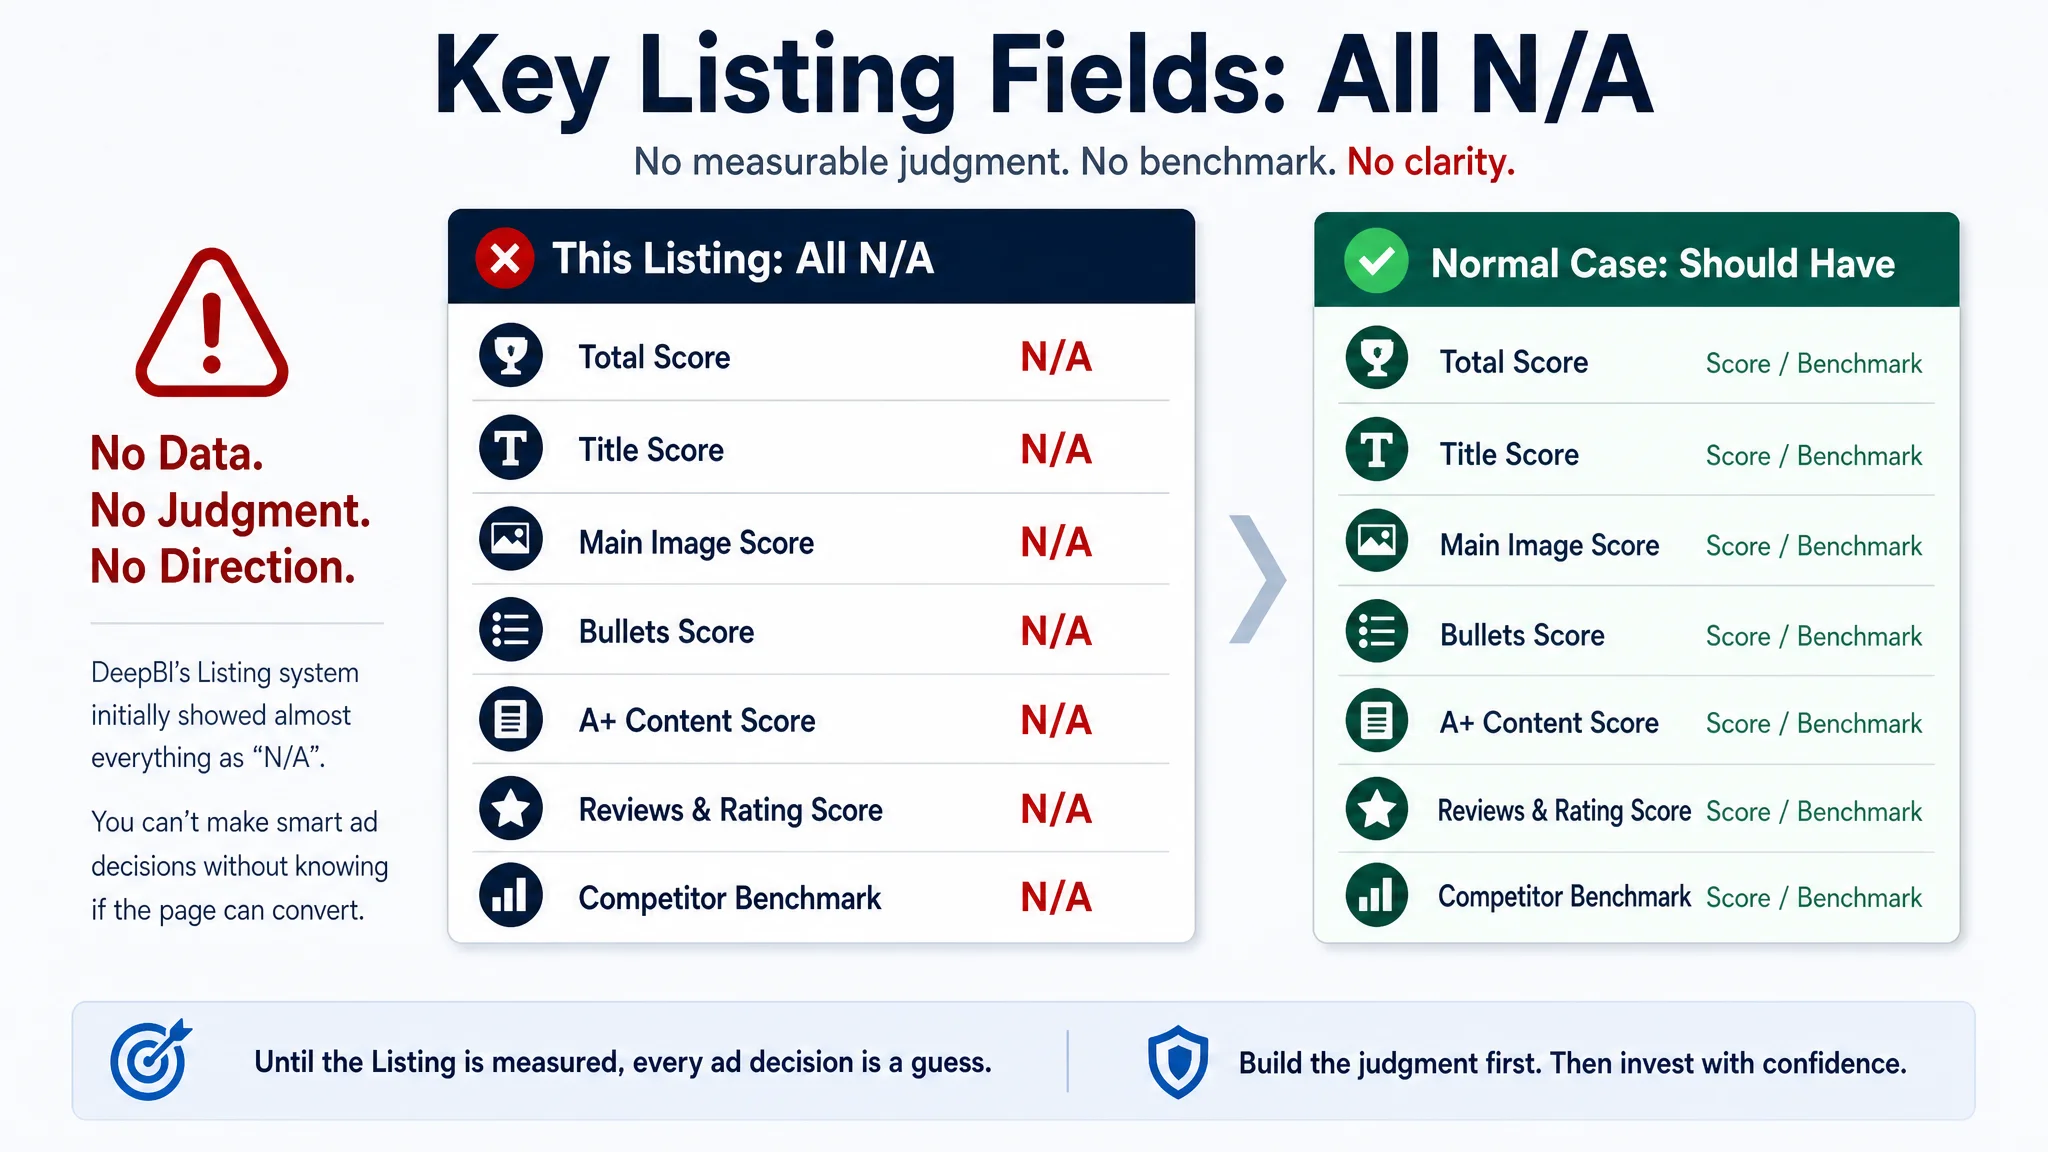
A real turning point for the seller above came when their data was re-framed not as “ad reports over here, Listing somewhere else,” but as one funnel. DeepBI’s Listing system initially showed almost everything as “N/A”: no main image score, no bullet/A+ score, no clear competitor benchmark. That emptiness made the gap obvious—there was literally no quantified judgment of the page’s conversion ability to sit alongside the ad metrics. Until those pieces were unified, any attempt to “optimize ads” meant tuning traffic into a page no one had properly evaluated.
This approach enables a closed feedback loop. For example, when a new main image is published, a connected system can automatically track its direct impact on the ASIN's CTR over the following days. This transforms optimization from guesswork into a data-driven strategy. By linking advertising signals to listing performance and organic rank, sellers can make smarter decisions that not only improve ad efficiency but also lower the Total Advertising Cost of Sales (TACoS) and drive sustainable growth.
DeepBI: Your Bridge to Advanced Amazon Ads Analytics in Power BI
Connecting your Amazon Ads data to Power BI is essential for deep analysis, but the process is often manual, time-consuming, and prone to errors. DeepBI acts as a powerful, no-code platform that automates this entire workflow, transforming a complex data engineering task into a simple, streamlined process. It empowers marketing and sales teams to build sophisticated analytics dashboards without needing dedicated IT or data science resources, bridging the gap between raw ad data and actionable business intelligence.
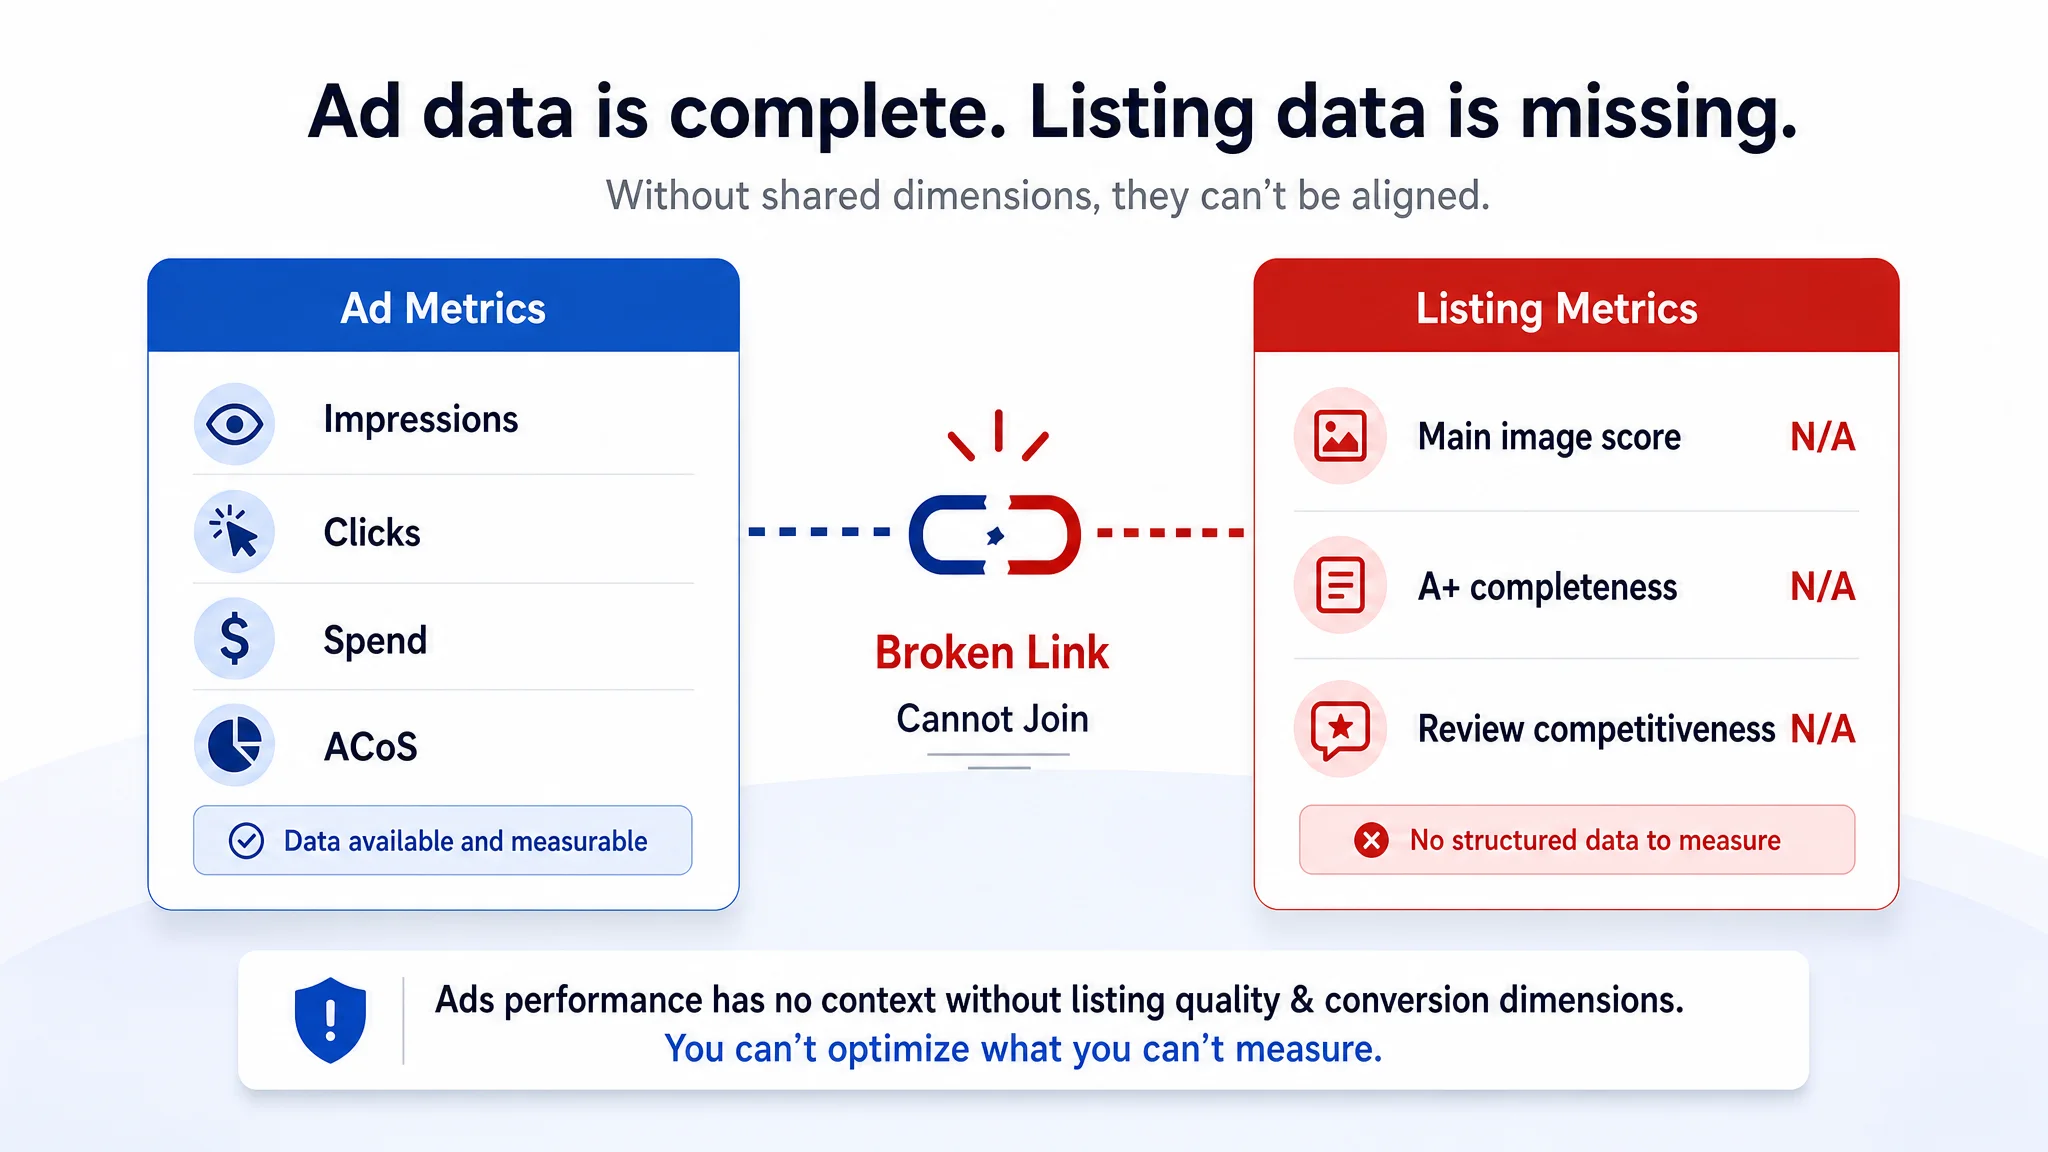
In the case of the seller who blamed “bad ads” for weak results, manually exporting scattered reports into spreadsheets had been their only way of looking deeper. They would pull campaign reports, keyword reports, maybe some search term data, and then still had no consistent way to align that with any Listing-quality indicators. There were no stable dimensions for “main image strength,” “A+ presence,” or “review competitiveness” that could be brought into Power BI. DeepBI’s role was to turn that ad-centric, fragmentary picture into a single structured dataset that covered both traffic and page quality, so Power BI could finally be used to diagnose the whole funnel instead of just the ad layer.
Seamless Data Connection and Automation
Manually downloading, cleaning, and structuring Amazon Ads reports for use in Power BI can consume hours of valuable time, creating significant delays in your analysis cycle. DeepBI eliminates this friction entirely. With a minimal, user-friendly setup process, you can establish a robust and automated data pipeline from Amazon Ads directly to Power BI. This replaces tedious manual operations with a reliable, hands-off connection, reducing a process that once took significant effort down to a matter of minutes for the initial setup. Your data stays fresh and analysis-ready without constant manual intervention.
For that same seller, this automation also changed when they could make decisions. Previously, by the time they had manually exported and cleaned ad data, their weekly budget decisions were already made; any deeper analysis lagged behind. Once DeepBI was connected, Listing and ad metrics updated together into Power BI without someone pulling files late at night. That made it possible to ask, before shifting budgets, “Is this product page even competitive enough to justify more traffic?” instead of reacting days later.
DeepBI's AI-Powered Data Mapping and Transformation
DeepBI’s intelligence lies in its ability to automatically handle the complex work of data transformation. The platform's AI-powered engine intelligently recognizes and maps the intricate structures of your Amazon Ads data. It correctly organizes campaign types, ad groups, and targeting methods into proper dimension tables and fact schemas within Power BI. Crucially, DeepBI understands key Amazon metrics like ACoS, ROAS, and attributed sales, ensuring they are correctly formatted for analysis. It even resolves common data headaches, such as reconciling date grain mismatches between hourly ad data and daily sales figures, ensuring your data is always accurate and consistent.
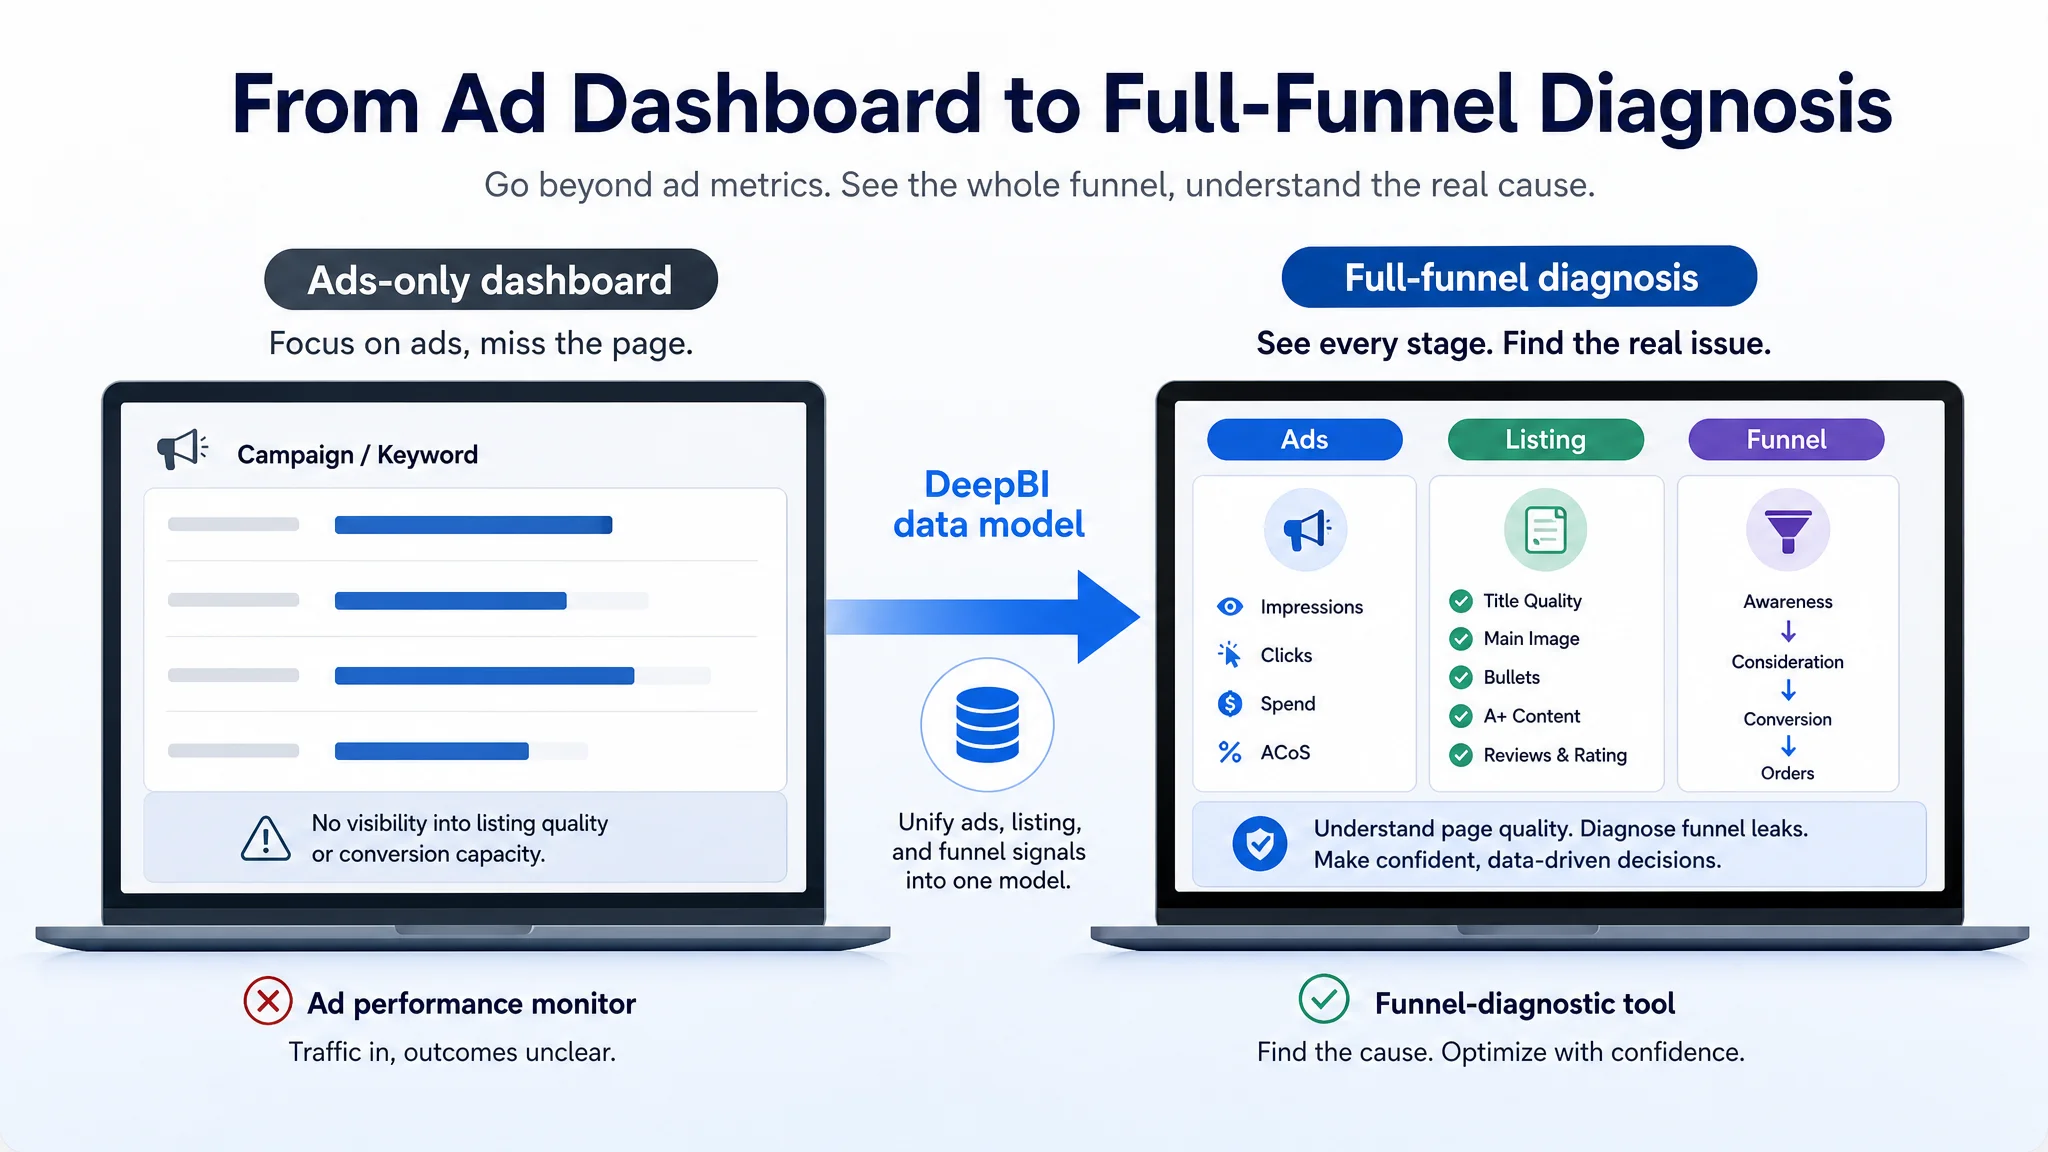
In the “empty Listing” case, this automated structuring exposed an important reality: all the ad metrics—impressions, clicks, spend, ACoS—were clean and well-organized, but there was nothing on the Listing side to map against. That contrast itself became a diagnostic signal. The system could clearly show campaign performance over time, but whenever the seller tried to slice that by “main image score” or “A+ completeness,” there was simply no field to join on. DeepBI’s data model didn’t just make the ad side tidy; it highlighted that the missing dimensions were exactly the ones needed to explain why the ads felt so unstable.
Essential Metrics for Amazon Ads Performance Analysis
To transform raw advertising data into a strategic asset, it's crucial to analyze performance through the lens of the customer journey. A funnel-based approach, powered by the structured data DeepBI provides to Power BI, allows you to pinpoint weaknesses and optimize with precision. By categorizing metrics, you can move from simply observing data to diagnosing specific performance issues.
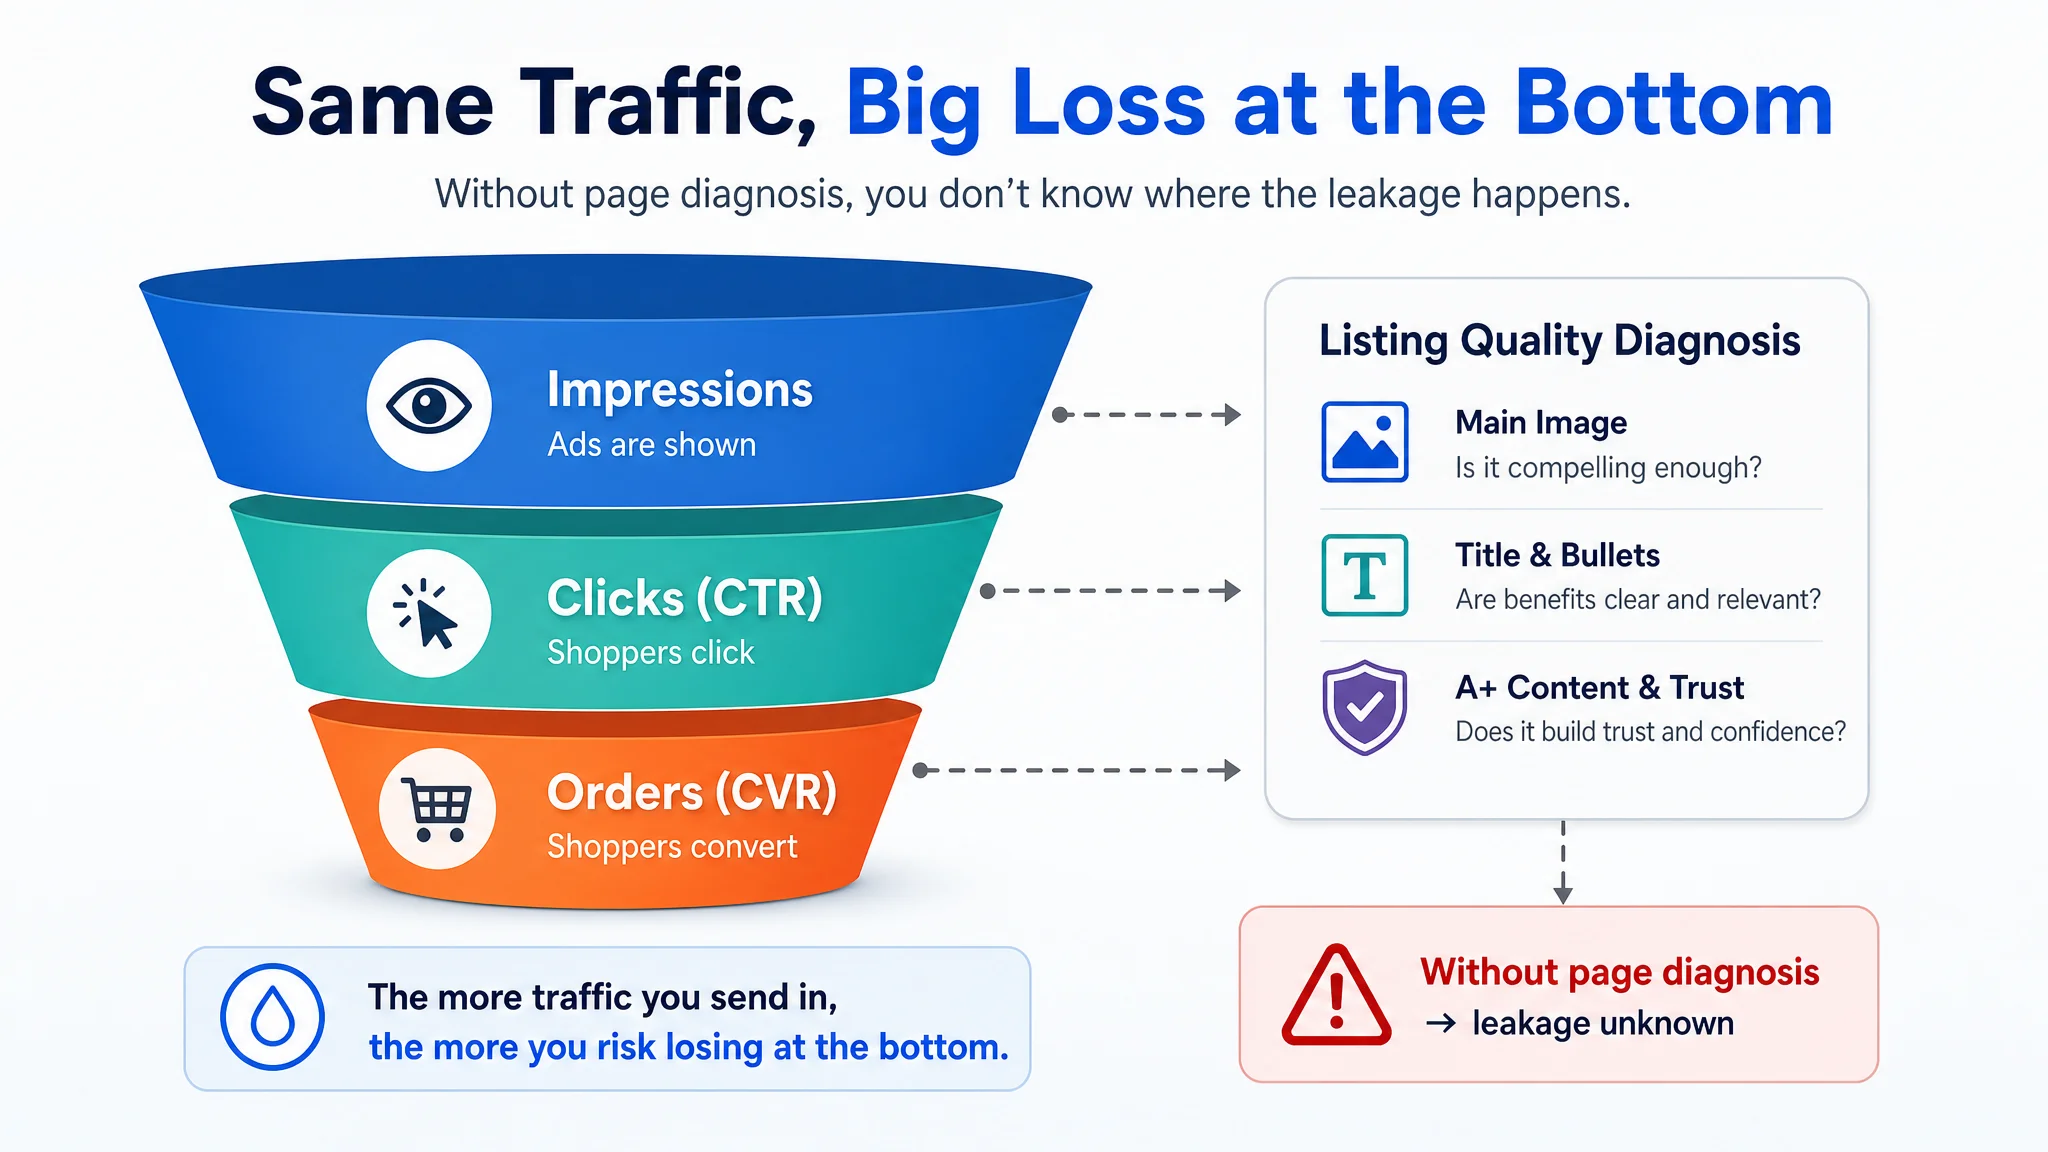
In practice, the seller who believed “our ads don’t work” had been watching only aggregated spend, sales, and ACoS. Once their data was reorganized into a funnel view—awareness → consideration → conversion—it became clear they did not know at which stage the leakage actually occurred. Impressions might have been fine, CTR uncertain, CVR unknown. This is where disciplined funnel metrics turn a vague complaint into a precise question.
Top-of-Funnel Metrics (Awareness & Discovery)
This stage is about capturing attention. The primary metric here is Impressions, which measures the total number of times your ad was displayed. High impression volume indicates your campaigns are successfully reaching a broad audience, forming the foundation for all subsequent engagement and conversion.
For the US marketplace product above, impressions were not the immediate bottleneck. Campaigns were running, budgets were not fully limited, and ads were being shown. Yet the team still felt “ads are not working,” which is a classic sign that the problem is downstream—clicks and conversions—rather than pure reach. Without a structured view, they were close to misdiagnosing a mid- or bottom-funnel issue as a top-of-funnel one, risking unnecessary changes to targeting that would not fix the real cause.
Mid-Funnel Metrics (Consideration & Engagement)
Once a customer sees your ad, the goal is to provoke a click. Key metrics include:
- Clicks: The total number of times shoppers clicked on your ad.
- Click-Through Rate (CTR): The percentage of impressions that result in a click. A low CTR often signals a weak "visual hook," suggesting your main image or ad creative fails to capture interest and differentiate your product from competitors.
This is where many sellers instinctively go wrong. In the “it must be the ads” case, the team’s first reaction to rising ACoS was to tweak bids and expand keyword lists. But when CTR was examined in context, it wasn’t clear whether the issue was mismatched traffic or a non-competitive thumbnail. Because there had been no Listing benchmarking, no one could say if their main image, at search-result size, actually stood a chance against the category leader. In DeepBI’s normal diagnostic flow, a low CTR combined with a weak main-image score would clearly point to a creative problem at mid-funnel, not a pure keyword problem—something this seller had never been able to see with native Amazon reports alone.
Bottom-of-Funnel Metrics (Conversion & Profitability)
After the click, your listing must convert interest into a sale. The critical metric is Conversion Rate (CVR), which measures the percentage of clicks that lead to a purchase. A low CVR indicates that while your ads are driving traffic, your product detail page—including A+ content, bullet points, and customer reviews—is failing to build trust and persuade shoppers to buy.
In the case where DeepBI’s Listing view initially showed “N/A” across title, images, bullets, A+, and reviews, this bottom-of-funnel analysis simply hadn’t happened before. The seller had never asked: “Do our bullets build a clear pain-point-to-solution narrative?” or “Is our A+ content matching what successful competitors show?” They only saw that clicks did not turn into enough orders and concluded “ads are bad.” Once the concept of CVR was explicitly attached to page modules in Power BI—tying poor conversion to underdeveloped content rather than just to traffic volume—it reframed the entire discussion from “fix the ads” to “judge and fix the Listing first.”
Efficiency and Profitability Metrics
These metrics evaluate the financial return on your advertising investment.
- Advertising Cost of Sale (ACoS): Measures the ratio of ad spend to ad revenue, indicating campaign-level efficiency.
- Total Advertising Cost of Sale (TACoS): Measures ad spend relative to total revenue (both ad-driven and organic). A declining TACoS shows that your advertising is successfully boosting organic rank and creating a healthier, less ad-dependent business.
In the “empty Listing diagnosis” scenario, ACoS and TACoS were the only numbers the internal team felt confident talking about—yet they could not explain why they were drifting in the wrong direction. Without knowing whether they were advertising into a structurally weak product page, they risked interpreting high ACoS purely as a bidding or targeting problem. By placing ACoS and TACoS alongside funnel metrics and page-quality diagnostics in Power BI, DeepBI helped expose a more fundamental truth: ads were being used to amplify a page whose conversion capacity had never been objectively assessed.
Building Dynamic Amazon Ads Dashboards with DeepBI and Power BI
While standard Amazon reports provide basic metrics, creating a truly dynamic and customized analytics environment requires integrating deeper data sources. The combination of DeepBI and Power BI allows sellers to move beyond surface-level data and build dashboards that connect advertising performance directly to listing quality and customer behavior.
For the seller who arrived with a “blank” Listing diagnosis, this integration was the pivot point. Previously, their view of performance stopped at campaign and keyword tables. After DeepBI fed structured Listing information (once it was populated) into Power BI, they could finally see, in one place, not just which campaigns spent money, but whether that spend was funneling into a page structure that deserved it.
Customizing Your Analytics Experience
Power BI offers unparalleled flexibility in creating custom visualizations, but its power is magnified by the quality of the data it receives. DeepBI enriches this experience by providing diagnostic insights that are not available in standard Amazon reports. For example, instead of just showing a low Click-Through Rate (CTR), DeepBI cross-validates this ad metric with its own listing analysis. If your CTR is below 0.35% and DeepBI’s scoring module identifies a weak main image, the system confirms that the image is the root cause of poor ad performance. This allows you to build dashboards that don't just report problems but diagnose them.
In the real-world case, the initial shock was that DeepBI could not even run this type of cross-validation at first—everything about the Listing was “N/A.” That forced the team to recognize that their Power BI dashboards, up to that point, had been structurally biased toward ad metrics only. Once DeepBI helped them populate proper Listing scores and benchmark their page against category leaders, custom visuals suddenly became more meaningful: CTR charts could be overlaid with main-image scores; CVR trends could be plotted alongside A+ completeness and review competitiveness. The dashboard evolved from an “ad performance monitor” into a true funnel-diagnostic tool.
Automating Insights for Proactive Optimization
A key advantage of integrating DeepBI is the automation of insight generation. The system continuously analyzes campaign-level metrics—including spend, impressions, clicks, ACOS, and ROAS—to identify optimization opportunities. Rather than requiring manual data pulls and refreshes, DeepBI’s connection ensures that your Power BI dashboards reflect the latest performance context. This automated data flow enables proactive management; for instance, DeepBI's system can use the past 7 days of click, conversion, and spend data to inform strategic recommendations, ensuring that decisions are based on stable trends rather than volatile daily fluctuations. This provides a transparent, data-driven foundation for optimizing campaigns without the need for constant manual intervention.
For the seller who had been “waiting out” ad learning phases and adjusting bids by feel, this automation changed their reaction pattern. Instead of firefighting when ACoS spiked, they began to watch for consistent signals across both ads and Listing—such as several days of traffic into a page segment that still underperformed versus benchmark. Power BI, powered by DeepBI’s pipeline, became less about answering “what just happened?” and more about warning “this page module will limit returns if you push more traffic before fixing it.”
Optimizing Your Amazon Ads Strategy with DeepBI
DeepBI transforms advertising from a cost center into a strategic growth engine by creating a direct feedback loop between performance data and operational execution. This data-driven approach moves beyond subjective adjustments, enabling sellers to make quantifiable improvements to their campaigns and listings.
In the “it’s just the ads” scenario, the biggest shift was conceptual. DeepBI refused to treat the problem purely as an advertising-parameter question and instead insisted on judging the Listing’s conversion capacity first. This change in decision order—from ads-first to Listing-first—is precisely what turns random experimentation into a structured optimization strategy.
Data-Driven Bid and Budget Adjustments
To optimize ad spend, DeepBI employs a four-layer traffic funnel model that guides dynamic bid and budget management. This structured approach begins by exploring new keywords and ASINs to discover fresh traffic sources. Next, it systematically filters out low-quality traffic that fails to convert, preserving your budget. The strategy then concentrates spend on high-conversion targets to maximize return on investment. Finally, it provides a clear path to scale proven performers, ensuring that your budget is allocated to campaigns that deliver consistent results.
For the seller with rising ACoS, this framework exposed a trap they had fallen into: they were cycling through bid changes and keyword refinements even though no one could say whether the page could convert the traffic already in play. When DeepBI’s funnel model was applied, it became obvious that before shifting more budget into “explore” or “scale,” they needed to pause and answer a more basic question: does the current Listing clear a minimum conversion bar compared with category benchmarks? Only after DeepBI helped define and measure that bar did bid and budget decisions become genuinely data-driven instead of reactive.
Leveraging Ad Performance for Organic Growth and Listing Enhancement
DeepBI closes the gap between ad performance and listing quality. The system analyzes ad reports to identify high-CTR and high-CVR keywords, treating this data as a direct feedback mechanism for optimization. These "winning terms" are then used to refine listing elements, such as restructuring bullet points into a "pain point-solution" format and enhancing A+ content. This process improves the listing's core Conversion Rate, which not only makes ad spend more efficient but also contributes to better long-term organic rankings.
In practice, once the “empty” Listing case had a proper diagnosis, DeepBI could finally show which search terms generated relatively better engagement and conversion, even on a suboptimal page. Those terms became anchors for a restructured title and bullets. Instead of guessing what to emphasize on the page, the team used the ad data itself to redesign content. That closed the loop: ads no longer just delivered traffic; they informed exactly which claims and visuals should be stronger on the product detail page to improve both paid and organic performance.
Scaling Campaigns Effectively
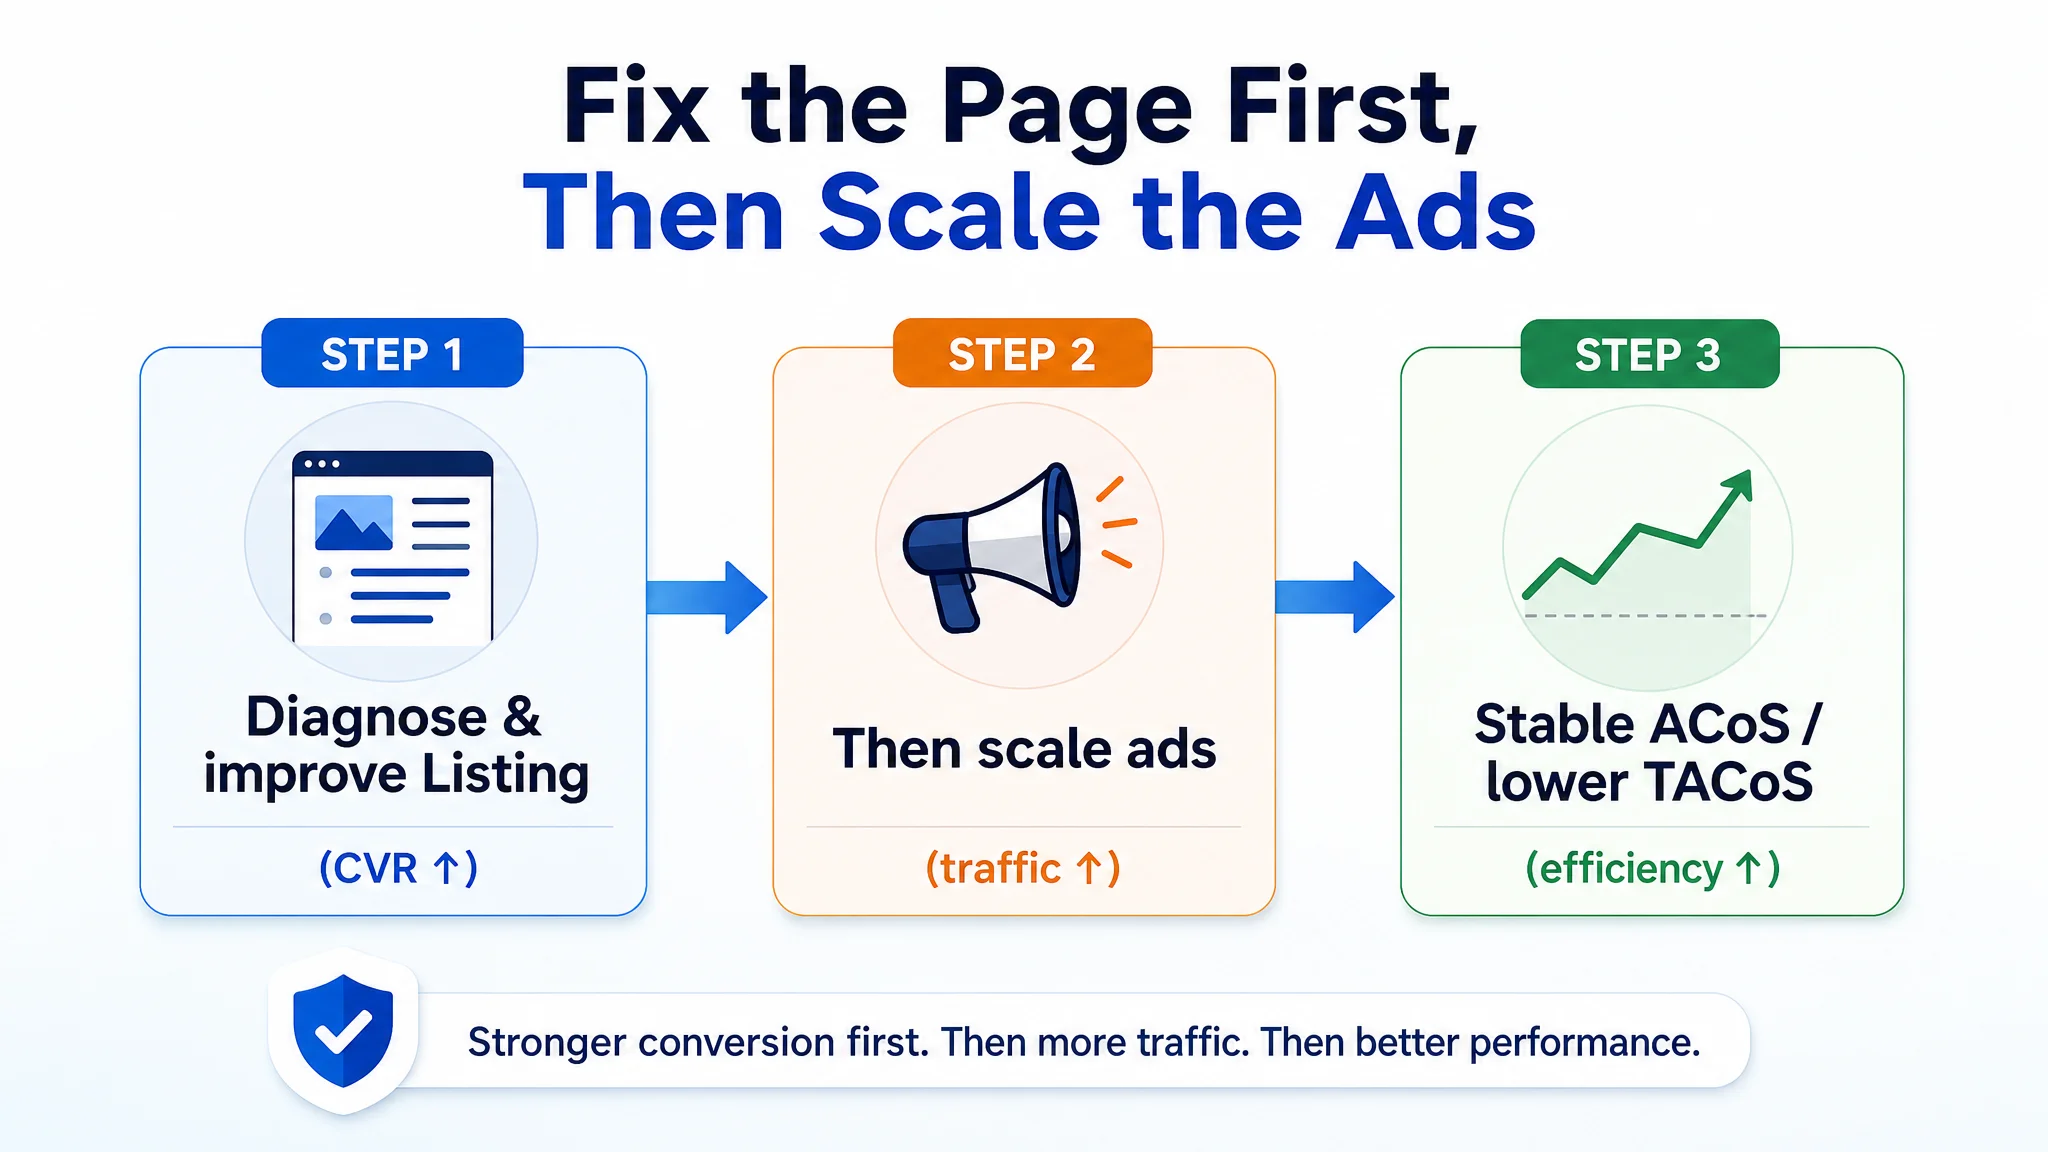
Scaling successful campaigns often carries the risk of diminishing returns and rising ACoS. DeepBI mitigates this by first improving the underlying conversion rate of the product listing itself. A higher CVR creates a more stable foundation for growth. With an optimized listing, you can then systematically increase budgets and bids on proven keywords and ASINs with confidence. This method ensures stable, profitable scaling, allowing you to capture more high-quality traffic without overspending and ultimately lowering your Total Advertising Cost of Sales (TACoS).
This is precisely why DeepBI declined to immediately “fix the ads” for the seller who came in with a blank Listing diagnosis. Scaling a Listing whose conversion strength is unknown is equivalent to turning up the volume on an untested message. Once the page had been benchmarked, its weakest modules upgraded, and its CVR stabilized, scaling no longer felt like gambling. Campaigns could be ramped knowing that every additional click landed on a page whose ability to convert had been measured—not assumed.
Ensuring Data Security, Accuracy, and Reliability
Protecting sensitive business data is non-negotiable. When connecting your Amazon Ads account to any third-party tool, you need absolute confidence in its security architecture and data handling protocols. DeepBI is engineered with this principle at its core, providing enterprise-grade security and a highly reliable data pipeline to ensure the integrity of your analytics.
DeepBI's Commitment to Enterprise-Grade Security
DeepBI is built to meet rigorous security and compliance requirements, giving you peace of mind. The platform adheres to leading industry standards, including SOC 2 Type II certification, and is compliant with both GDPR and HIPAA regulations. This commitment is reflected in our technical architecture.
All data connections are made exclusively through the official, encrypted Amazon Selling Partner API (SP-API). This eliminates the security risks associated with manual logins, such as account linkage, and ensures a secure, standardized channel for data transmission. Furthermore, DeepBI operates on a "principle of least privilege," requesting only the API permissions essential for its function. It does not access sensitive business data like pricing, inventory, or customer orders, ensuring your core operational data remains isolated and secure.
For the seller whose Listing diagnostics initially showed as “N/A,” this architecture also mattered from a trust perspective. They were willing to share ad data, but hesitant about giving broader access. Seeing that DeepBI only requested the minimum permissions required for analytics—and explicitly did not touch orders or pricing—made it easier for them to expand the connection later to include Listing-level information. Without that trust, the unified analysis they ultimately needed would have been impossible.
Maintaining Data Integrity for Confident Decision-Making
Secure data is only valuable if it is also accurate. DeepBI provides a stable and durable data pipeline designed for long-term reliability, ensuring your Power BI dashboards are always powered by correct and timely information. The system actively monitors the health of the data connection and employs task queues with unique tracking IDs to ensure every data synchronization process is traceable from end to end.
To guarantee accuracy, the platform performs multi-dimensional cross-validation of key performance indicators. By reconciling metrics such as impressions, clicks, CTR, and CVR from various Amazon reports, DeepBI ensures the data feeding your analytics is consistent and trustworthy. This robust process of validation and monitoring provides a solid foundation for confident, data-driven decision-making.
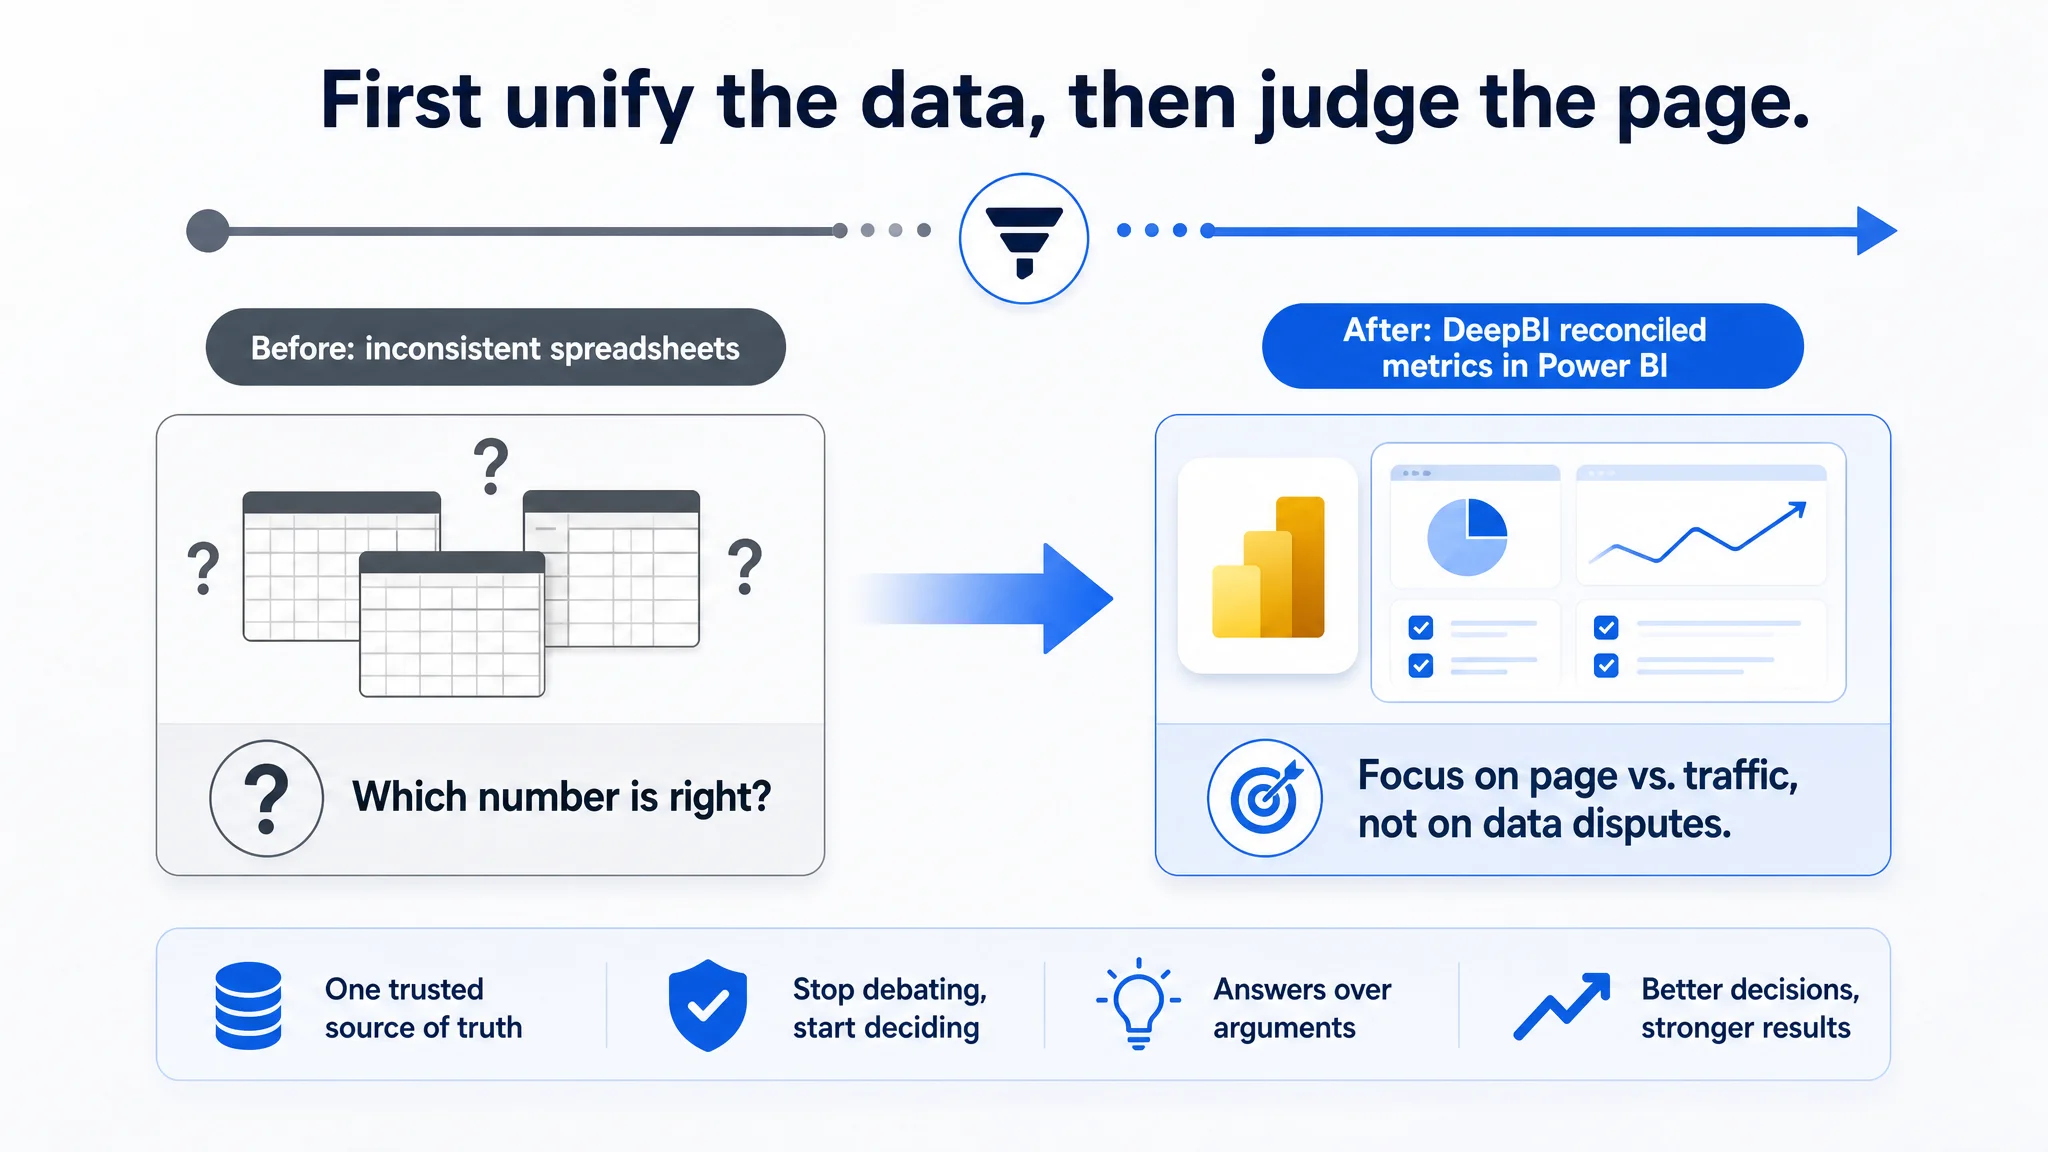
In the earlier “ads are bad” case, this integrity check helped resolve a subtle issue: the team’s own spreadsheets had small inconsistencies between different report pulls, which had eroded their confidence in any deeper analysis. Once DeepBI’s reconciled metrics appeared in Power BI and aligned across sources, they could stop debating “which number is right” and instead focus on the real question: given reliable data, does the Listing merit more traffic, or does it need structural improvement first?
Best Practices for Maximizing Your Power BI Investment
To transform raw data into a competitive advantage, it's crucial to approach your DeepBI and Power BI integration with a structured methodology. Effective optimization is not a one-time task but a continuous cycle of analysis, action, and measurement.
The seller who arrived with a blank Listing diagnosis is a clear illustration of what happens when that methodology is missing. They had many ad switches to flip, but no stable “data evidence chain” that linked those switches to real page-level outcomes. Power BI was effectively acting as an ad dashboard, not a business decision engine.
Defining Clear KPIs and Goals
All optimization detached from real market benchmarking is a waste of resources. Instead of pursuing vague improvements, start by establishing a clear "data evidence chain" within Power BI. Define specific Key Performance Indicators (KPIs) that diagnose precise business problems. For example:
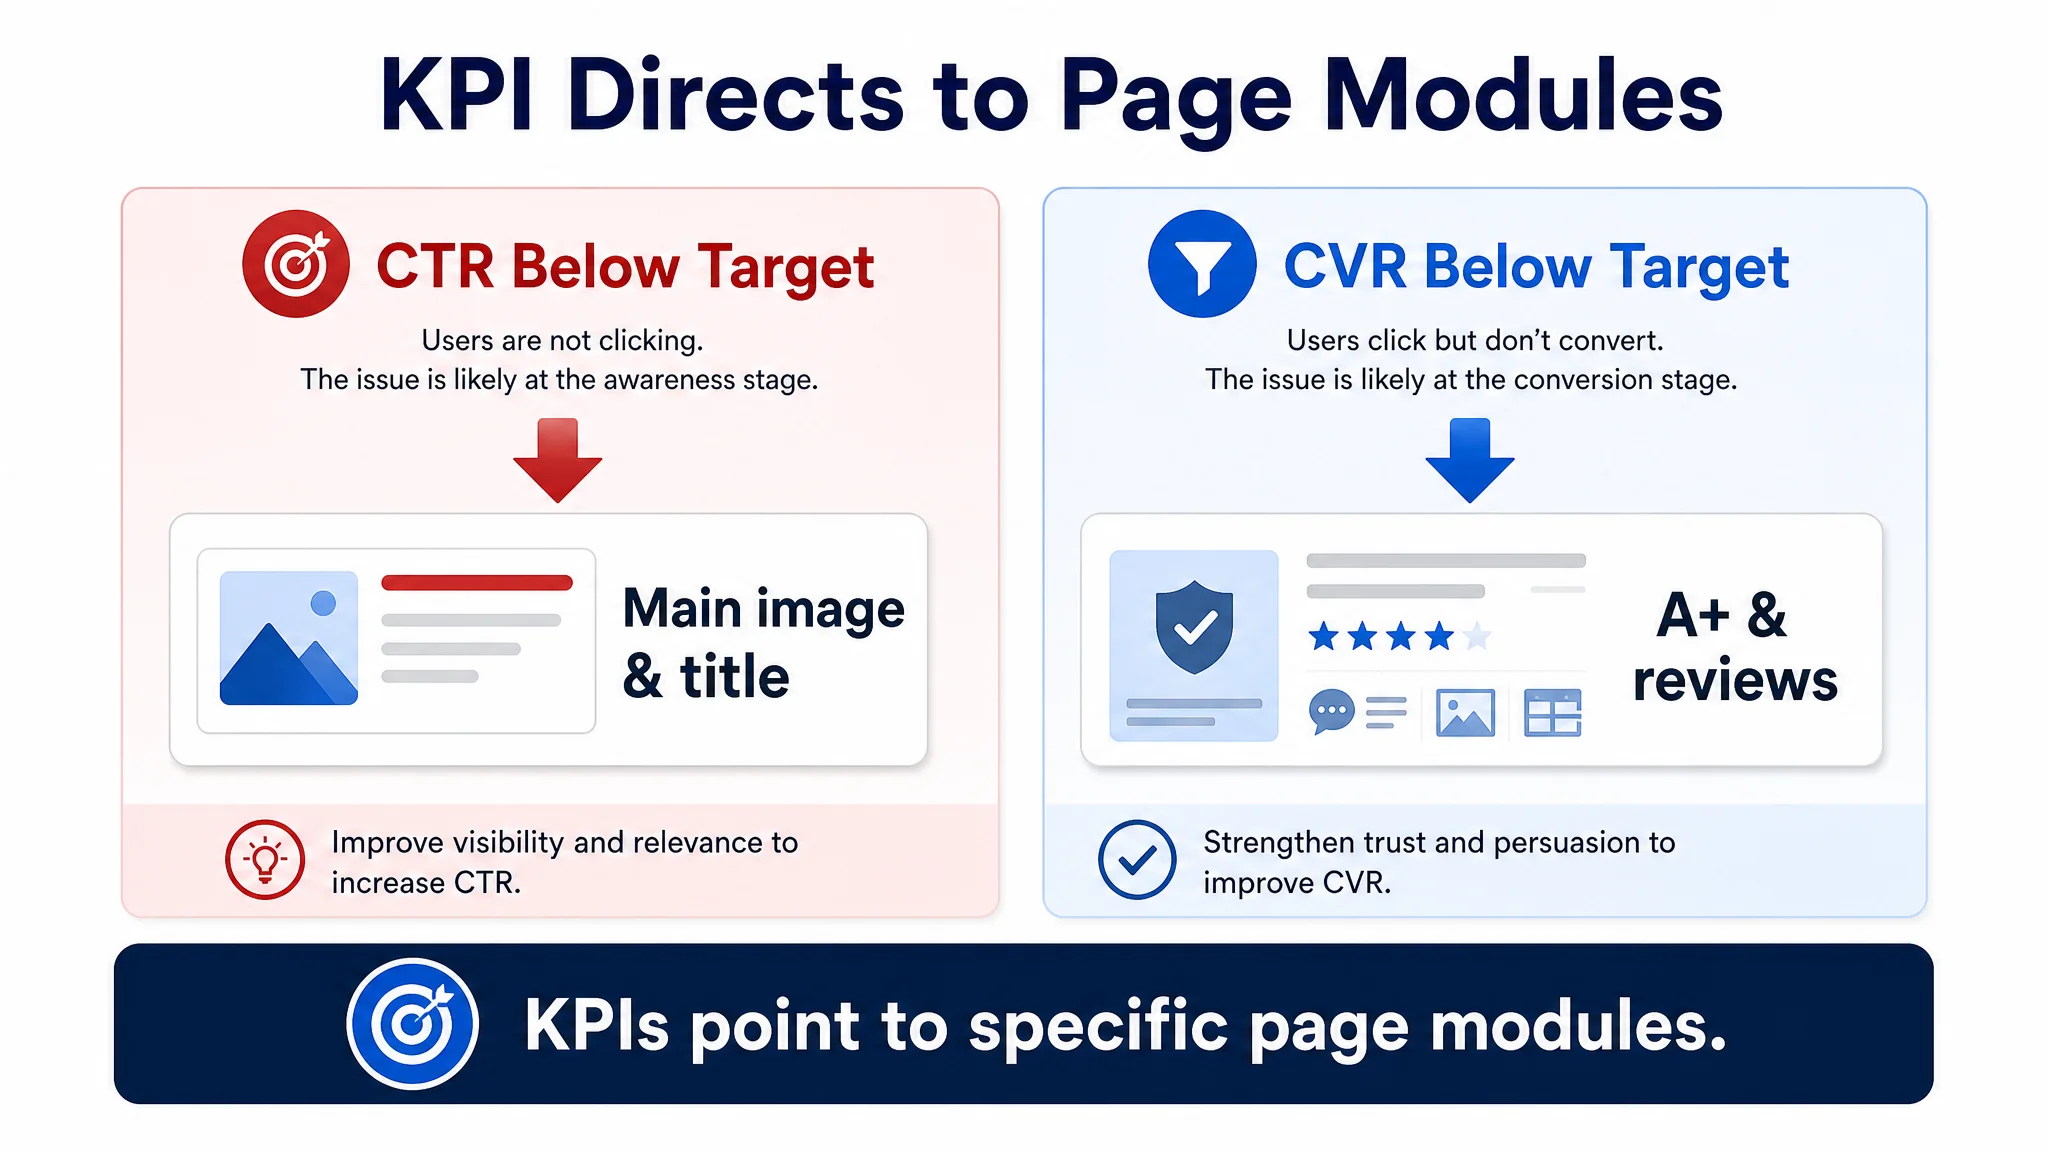
- A low Click-Through Rate (CTR), such as below 0.35%, often indicates that your main image lacks a strong visual hook and is losing to competitors in search results.
- A poor Conversion Rate (CVR), perhaps under 7%, may point to weaknesses in your A+ content, suggesting a lack of trust-building elements or insufficient detail to persuade buyers.
By setting clear targets for these KPIs, you can direct DeepBI’s analytical power to the parts of your listing that will deliver the greatest return on investment.
In the “empty” case, the absence of any Listing scores meant that these kinds of KPI thresholds had never been seriously discussed. The team talked about “low CTR” or “bad conversion” in abstract, without tying them to competitive benchmarks or specific page modules. Once DeepBI helped them define concrete KPI cutoffs and relate them to title, main image, bullets, A+, and reviews, Power BI transformed from a passive reporting layer into an active diagnostic map: each metric pointed to a precise optimization task instead of a vague sense of underperformance.
Regular Review and Iteration
Treat your listing optimization not as an occasional project, but as a dynamic process that responds to real-time market feedback. This involves a continuous feedback loop: diagnose performance issues in Power BI, use DeepBI to generate optimized content, apply the changes to your listing, and measure the impact.
A key practice is to create a "visual iteration event point" in your dashboard whenever you update listing images. By marking the date of the change, you can clearly monitor the impact on CTR and CVR over the subsequent 7-14 day period. This closed-loop process ensures that every adjustment is data-driven and that your optimization strategy evolves based on what demonstrably improves performance.
When the seller with the “N/A” Listing finally began this kind of iterative process, their internal conversations changed noticeably. Instead of debating opinions about creative taste—“this image looks nicer”—they logged each major change (new main image, restructured bullets, added A+ modules) as explicit events in Power BI. DeepBI’s data then showed, in the following days, whether CTR or CVR moved in the right direction. Over time, this cycle replaced guesswork and one-off redesigns with a disciplined rhythm: test, measure, refine, repeat, always tied back to funnel metrics and competitive benchmarks.
Conclusion: Transform Your Amazon Ads Strategy with DeepBI and Power BI
Navigating the complexities of Amazon Ads requires moving from intuition-based tactics to a strategy grounded in robust data. The integration of DeepBI with Power BI provides the essential framework for this transformation, allowing sellers to shift from 'groping in the dark' to 'precision targeting'. By unifying disparate data streams into a coherent analytical dashboard, this powerful combination eliminates guesswork and ensures that every optimization is benchmarked against real market performance, preventing wasted ad spend.
The experience of the seller who came to DeepBI insisting “our ads just don’t work” underscores this shift. Once their supposedly “ad-only” problem was examined, the deeper issue turned out to be a missing judgment on the Listing itself—no scores, no benchmark, no structured view of conversion capacity. By refusing to start with ad tweaks and instead building a full-funnel, data-driven evidence chain in Power BI, DeepBI helped reframe their entire approach: ads would no longer amplify an unknown page; they would support a Listing whose strengths and weaknesses were clearly mapped.
DeepBI is more than a simple data connector; it is an AI-powered, Amazon-focused, full-funnel optimization system. It empowers sellers to transition from experience-driven habits to data-driven operations by holistically managing Listings, Ads, and Organic Traffic. This integrated approach creates a virtuous cycle where superior ad performance informs listing enhancements, which in turn boosts organic visibility and profitability. By transforming subjective operational choices into a clear chain of data evidence, DeepBI helps you build a foundation for long-term, stable growth and convert your marketing efforts into measurable gains in CVR, ACoS, and overall market share.