Why Amazon Competitor Listing Analysis is Crucial for Success
In Amazon's hyper-competitive marketplace, sellers face the constant pressure of rising traffic costs and stagnant click-through rates (CTR) and conversion rates (CVR). Many sellers attempt to optimize their listings based on subjective aesthetics or intuition, a process that often leads to wasted resources and declining performance. Making blind modifications without a clear data-backed strategy is a significant risk when every pixel can impact profitability.
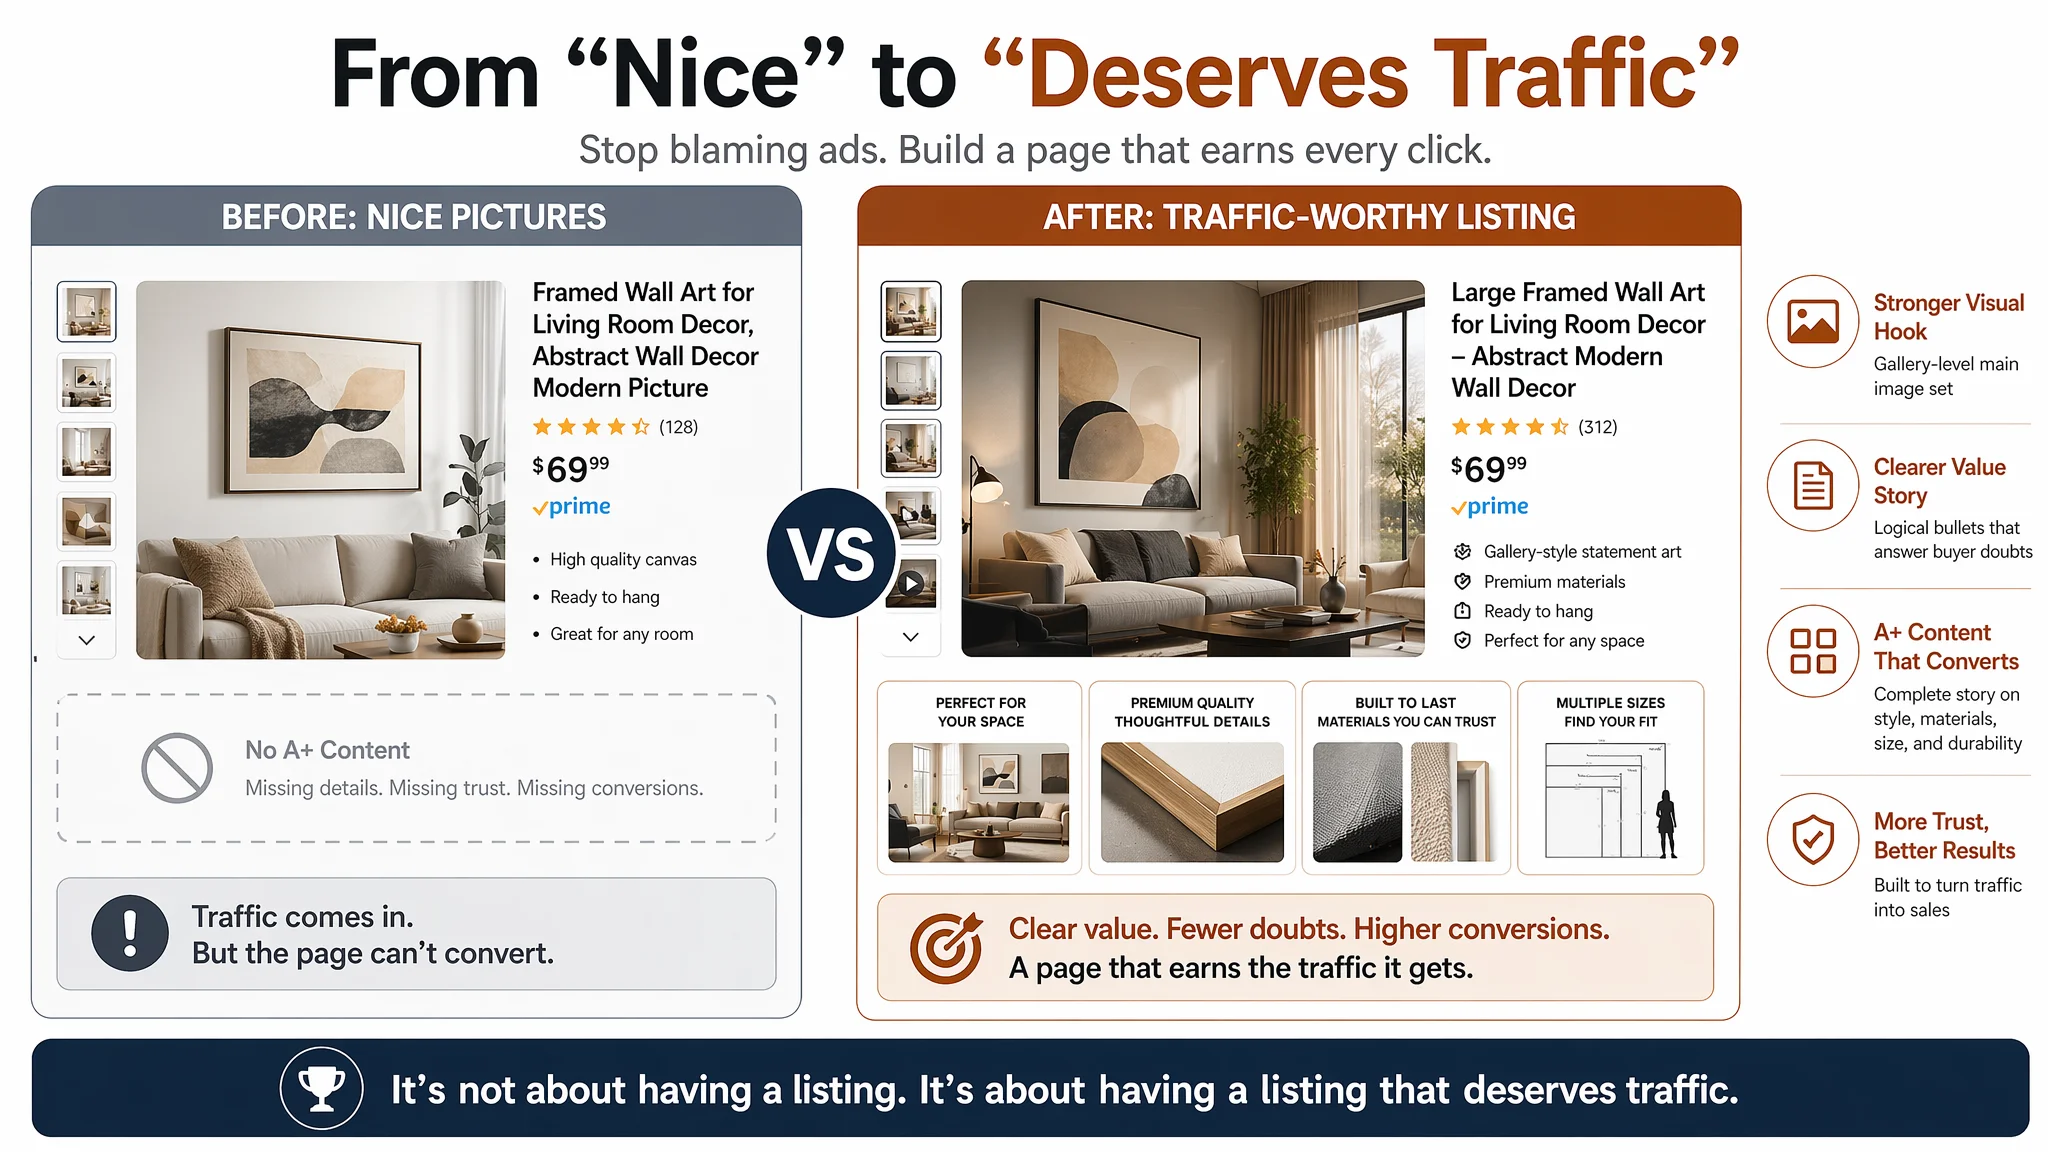
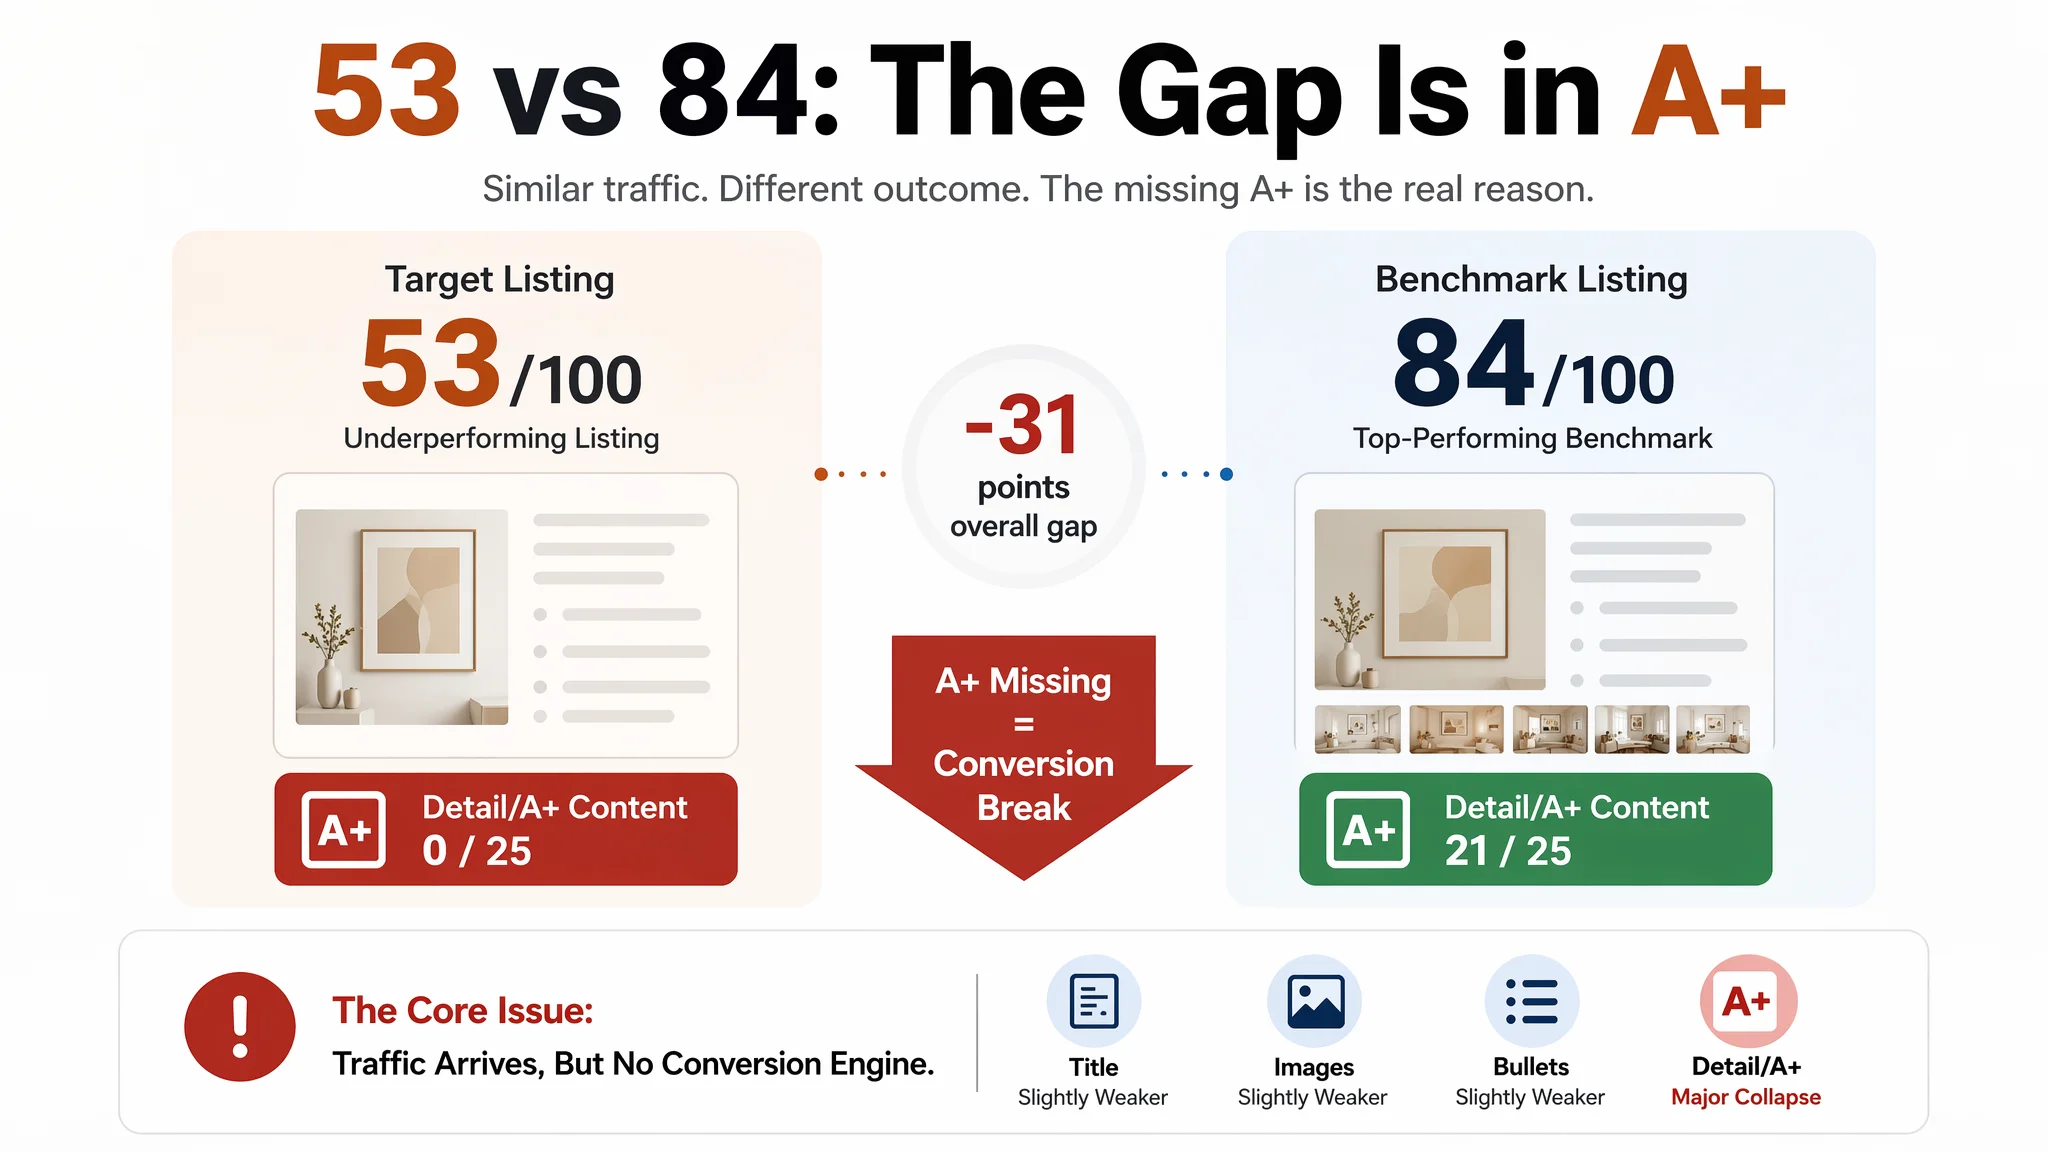
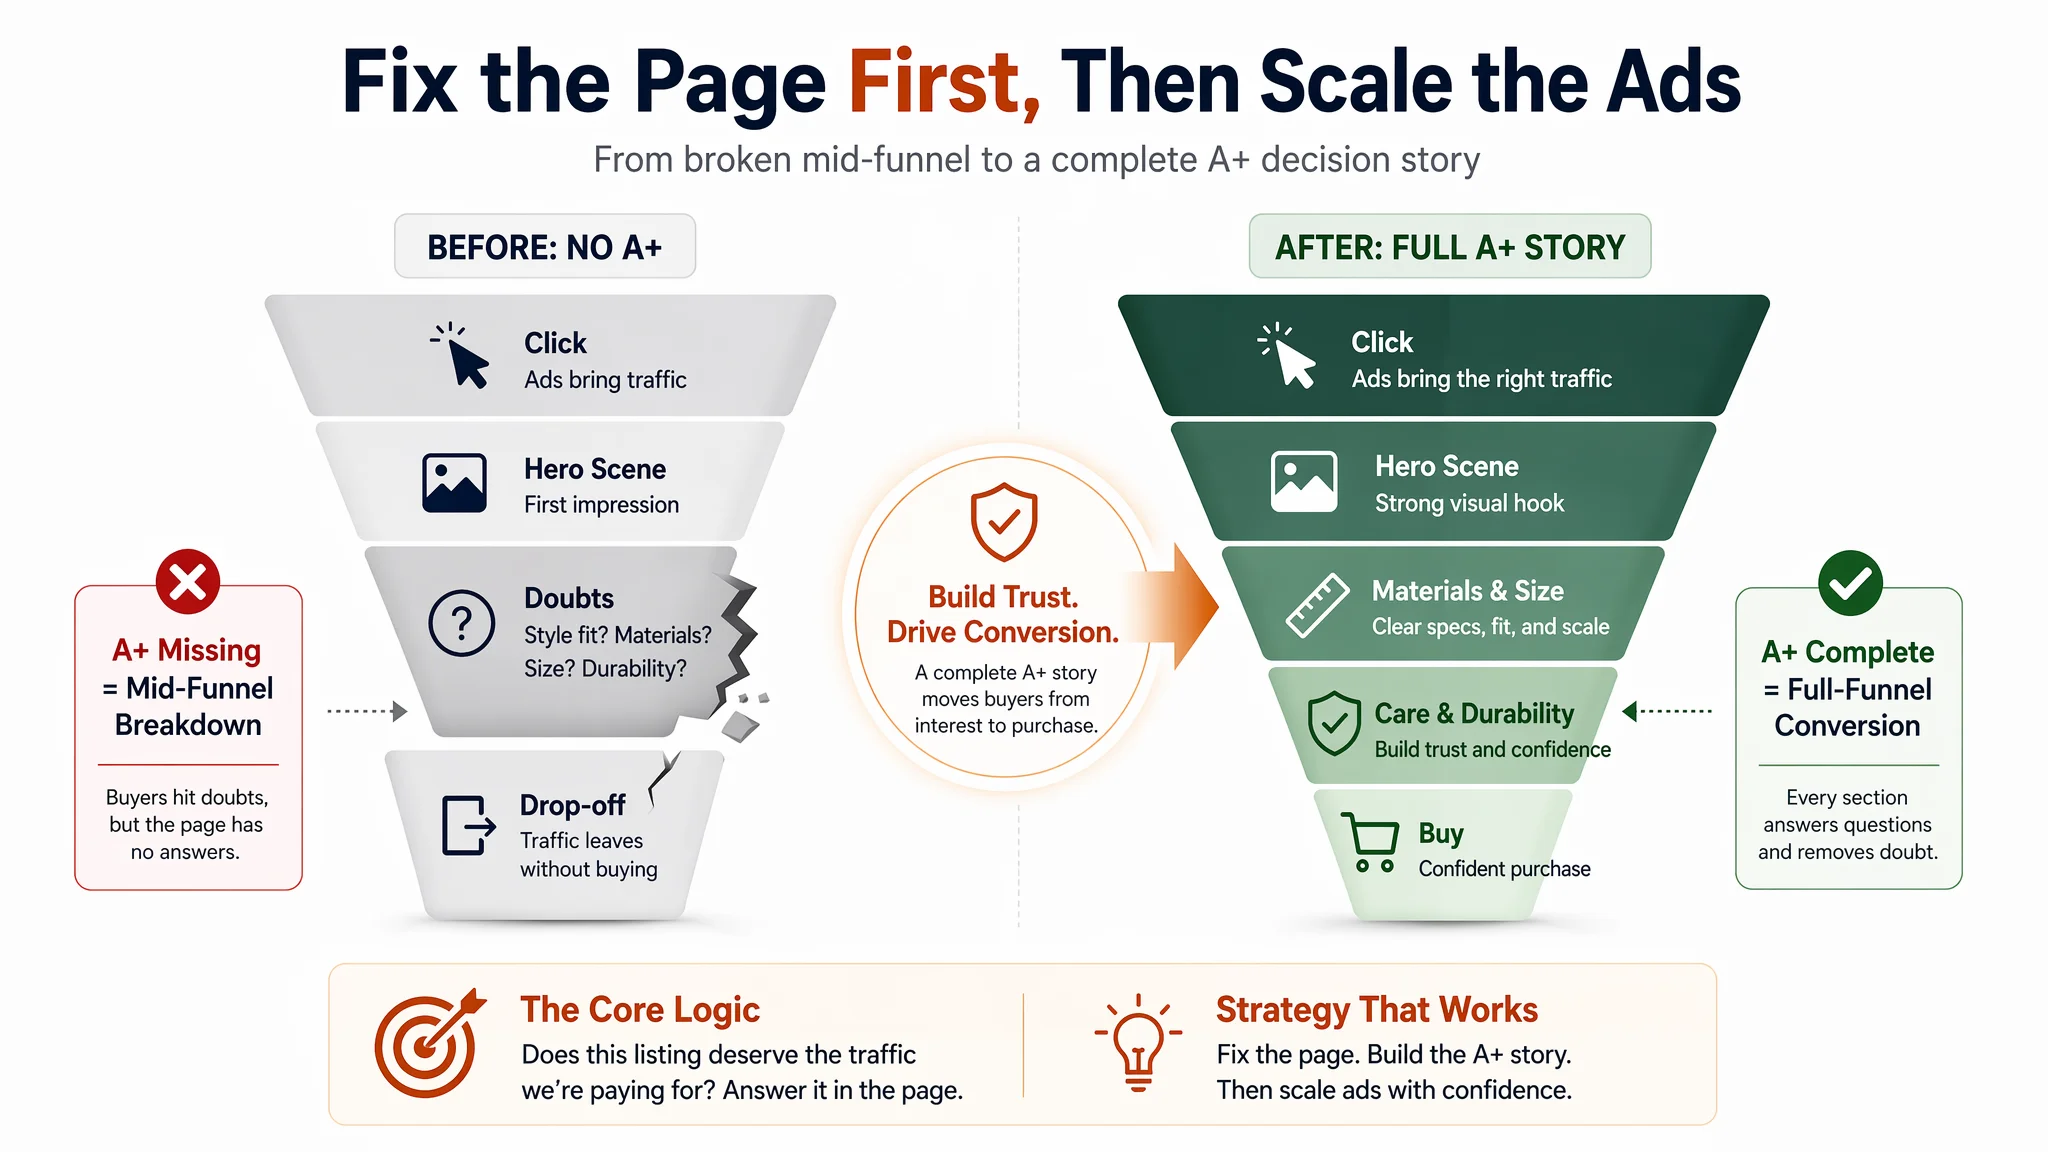
This disconnect between “what feels wrong” and “what is actually broken” shows up very clearly in real operations. A wall art seller in the US marketplace, for instance, came to DeepBI convinced they had an ads problem: ad spend was rising, orders were not keeping up, and ACOS felt increasingly out of control. The team’s instinct was to keep tweaking bids, keywords, and campaign structures, assuming better ad craftsmanship would eventually restore efficiency. Only when DeepBI ran a full listing diagnosis against directly comparable framed wall art benchmarks did a different picture emerge: the listing itself scored 53/100 versus a benchmark at 84/100, and almost the entire gap sat inside the product page. Title and main image were only slightly weaker; the real collapse was a zero score on the detail/A+ dimension, while the benchmark’s A+ content scored 21/25 and carried the conversion load. In other words, ads were doing their job of bringing traffic, but the page had no mid-to-lower funnel engine to convert that traffic.
Systematic competitor analysis provides the necessary framework to move from guesswork to data-driven decision-making and to avoid this kind of misdiagnosis. By dissecting top-performing competitor listings, you can identify untapped market gaps, evaluate pricing strategies, and uncover the specific visual and textual elements that drive customer engagement. This process helps you understand not just what is working for them, but why it works, allowing you to improve your own main images, titles, bullet points, and A+ content with precision instead of treating them as “good enough” while blaming ads.
This is where an AI-powered system like DeepBI becomes a strategic advantage. It transforms the complex task of market analysis into a standardized, data-centric workflow. In the wall art case, DeepBI quantified the gap between “vaguely okay-looking” and “commercially competitive” by showing that a zero-score A+ section facing a 21-point benchmark meant the listing simply did not deserve the traffic it was buying. More broadly, DeepBI helps sellers transition from experience-driven hunches to data-driven operations, creating a clear feedback loop between listing optimizations and their impact on advertising performance. By connecting every change to core business metrics like CTR and ACoS, you can ensure your strategy is built for sustained growth and profitability, rather than endless bid adjustments on a broken funnel.
Identifying Your True Amazon Competitors
Effective optimization begins with accurate benchmarking, yet many sellers fall into the trap of "survivor bias"—mistakenly targeting the #1 Bestseller without considering critical differences in function, price, or audience. All optimization efforts detached from real market benchmarking are an ineffective waste of resources. Manually identifying true competitors requires sifting through search results for broad and long-tail keywords, analyzing individual ASINs, and browsing deep into Amazon's category structure. This process is not only time-consuming but also makes it difficult to distinguish direct product substitutes from broader market rivals.
This misalignment between “who we think we compete with” and “who actually takes our customer” is not theoretical. In the wall art example, before data entered the discussion, the seller informally compared themselves to highly stylized or premium gallery brands whose prices, materials, and visual positioning were significantly different. On the surface, those brands felt aspirational and worth emulating, but they were not the listings that shared the same price band, frame format, and review range. When DeepBI constructed a benchmark set using semantic function and visual layout—framed abstract wall art, similar size and use scenarios—it surfaced competitors with very specific strengths: gallery-level room scenes, clear “large” size promises, and robust A+ storytelling. Against this more accurate benchmark, the seller’s page-level weaknesses became obvious and measurable.
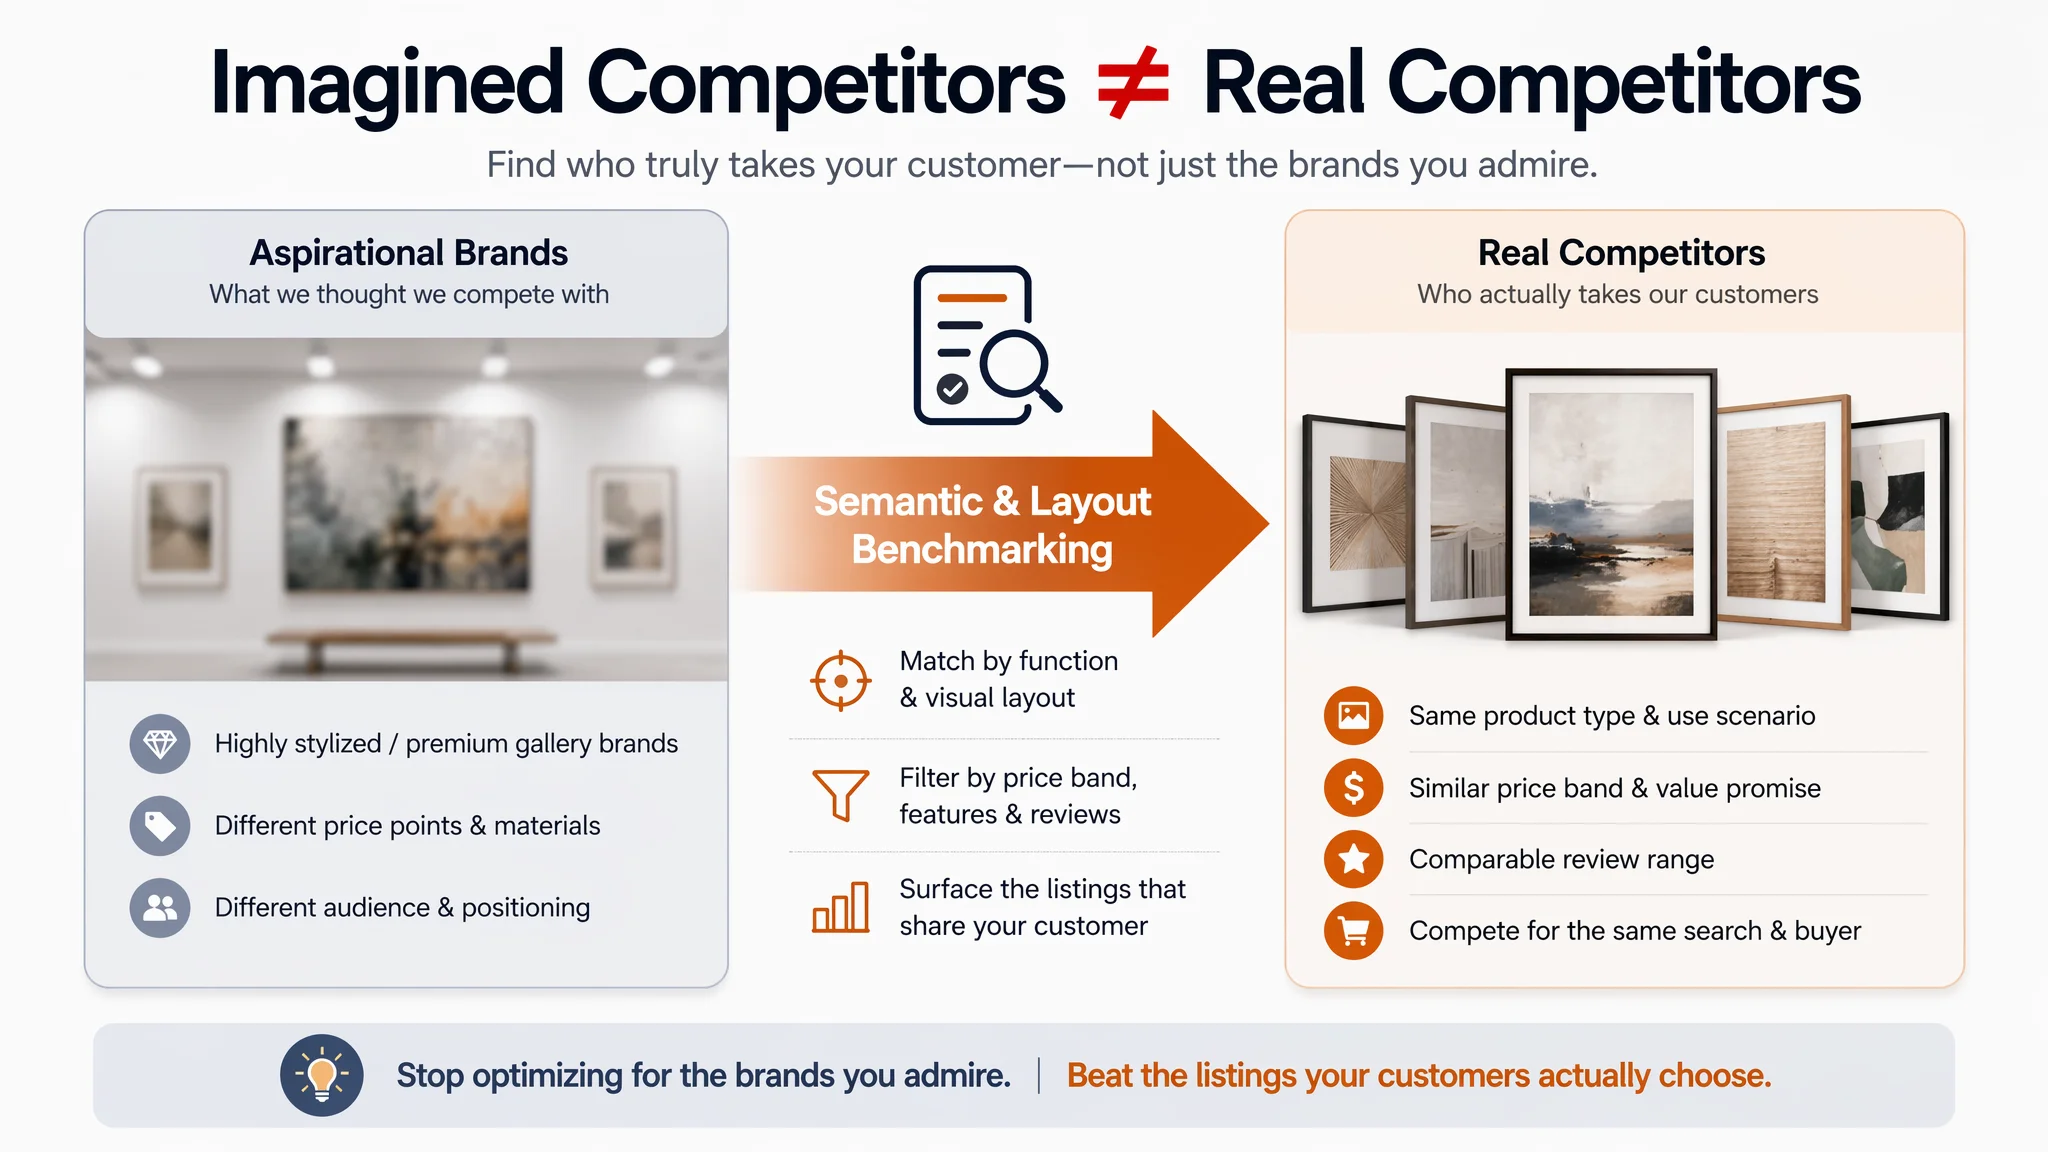
This is where automated analysis provides a decisive edge. DeepBI’s multi-dimensional semantic benchmarking algorithm moves beyond simple keyword matching to find your true competitive set. The system analyzes ASINs based on both semantic function and visual layout, automatically filtering out irrelevant products based on price, features, and market validation signals like review counts. By identifying and locking onto the most relevant, high-competitiveness ASINs, it builds a precise comparative framework. What took the wall art seller only a vague sense of “we’re probably weaker than the top brands” became a structured diagnosis: a –31 point overall gap, with –21 of those points in detail/A+ content alone.
This turns hours of manual research into an automated, data-driven diagnosis, ensuring your optimization strategy is aimed at the right target from the very beginning. More importantly, it reframes questions from “Why can’t we be like the bestseller?” to “Why are we losing to these specific, structurally similar listings—and what exactly are they doing better?”
Key Areas for Amazon Competitor Listing Analysis
A comprehensive analysis goes beyond a simple glance at a competitor's page. It requires a systematic audit of the core components that drive traffic and conversion. By breaking down top-performing listings into these key areas, you can uncover the specific tactics that contribute to their success and build a data-driven optimization plan for your own products.
Listing Content (Title, Bullet Points, A+, Images)
Your competitor's content is a direct reflection of their conversion strategy. Analyze their titles for keyword structure and clarity, and examine their bullet points to understand the logical flow of selling points and how they address customer pain points. Evaluate their visual assets—including the main image, secondary images, and A+ content—not just for aesthetic appeal, but as a commercial engine driving Click-Through Rate (CTR) and Conversion Rate (CVR). A low CTR, for instance, often points to a main image that lacks a strong "visual hook." Advanced systems can provide intelligent scoring and diagnosis for each content element, generating structured optimization strategies and even AI-driven content that is constrained by the product's core attributes to ensure authenticity.
In the wall art case, this content-level dissection exposed why ad spend felt “inefficient” even though campaigns were technically functional. When DeepBI scored the listing against its benchmark, the breakdown looked like this:
- Title: 14 vs 16 (–2)
- Main image set: 24 vs 26 (–2)
- Bullet points: 6 vs 8 (–2)
- Detail/A+ content: 0 vs 21 (–21)
- Reviews: 9 vs 13 (–4)
On paper, the listing did not lack a title or a main image; they were just slightly behind. The real collapse was at the detail/A+ layer, which had no content at all, while the benchmark used that space to answer style fit, material, durability, and size concerns through visual storytelling. Buyers clicking in from ads saw a few home snapshots and basic bullets, but nothing that advanced them from “this looks nice” to “this fits my room, is built well, and is worth the price.” That is exactly what competitor A+ modules were doing, and it is why a dimensional scoring approach is critical: it shows that a page can be “present” but commercially incomplete.
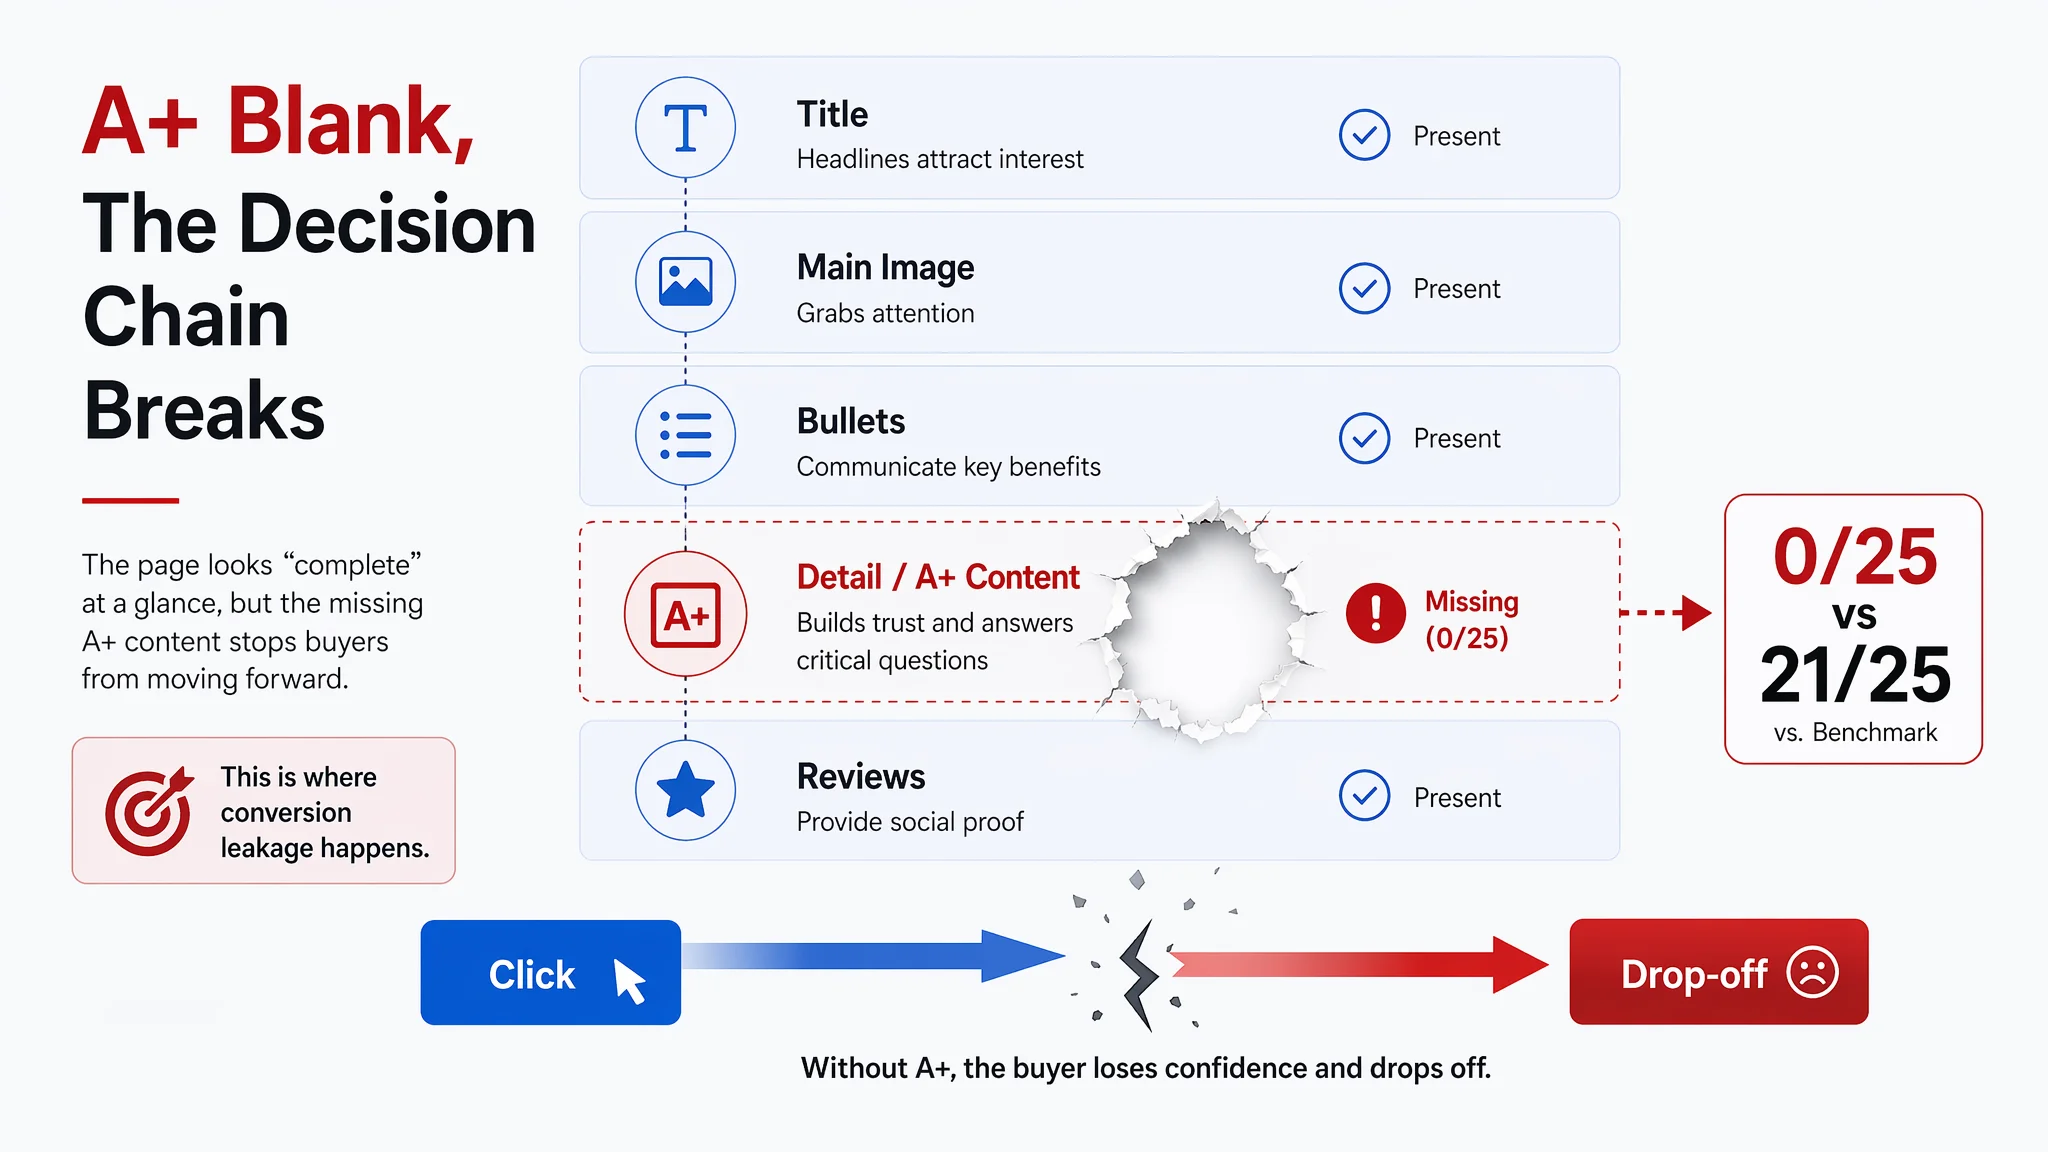
When you analyze listing content in this structured way, common misjudgments become easier to avoid. The wall art seller initially believed their images and copy were “good enough for now” and treated A+ as a future upgrade. Once they saw a 0/25 score on detail/A+ contrasted with a 21/25 benchmark, A+ stopped being a cosmetic nice-to-have and became an obvious conversion bottleneck.
Pricing Strategies and Promotions
A competitor's pricing is a critical lever for market positioning and sales velocity. Track their pricing history to identify patterns in their strategy, such as aggressive discounting or premium positioning. Monitor their use of coupons, deals, and other Amazon promotions to understand how they stimulate demand and manage inventory. This analysis helps you position your own product competitively without sacrificing profit margins and informs your promotional calendar.
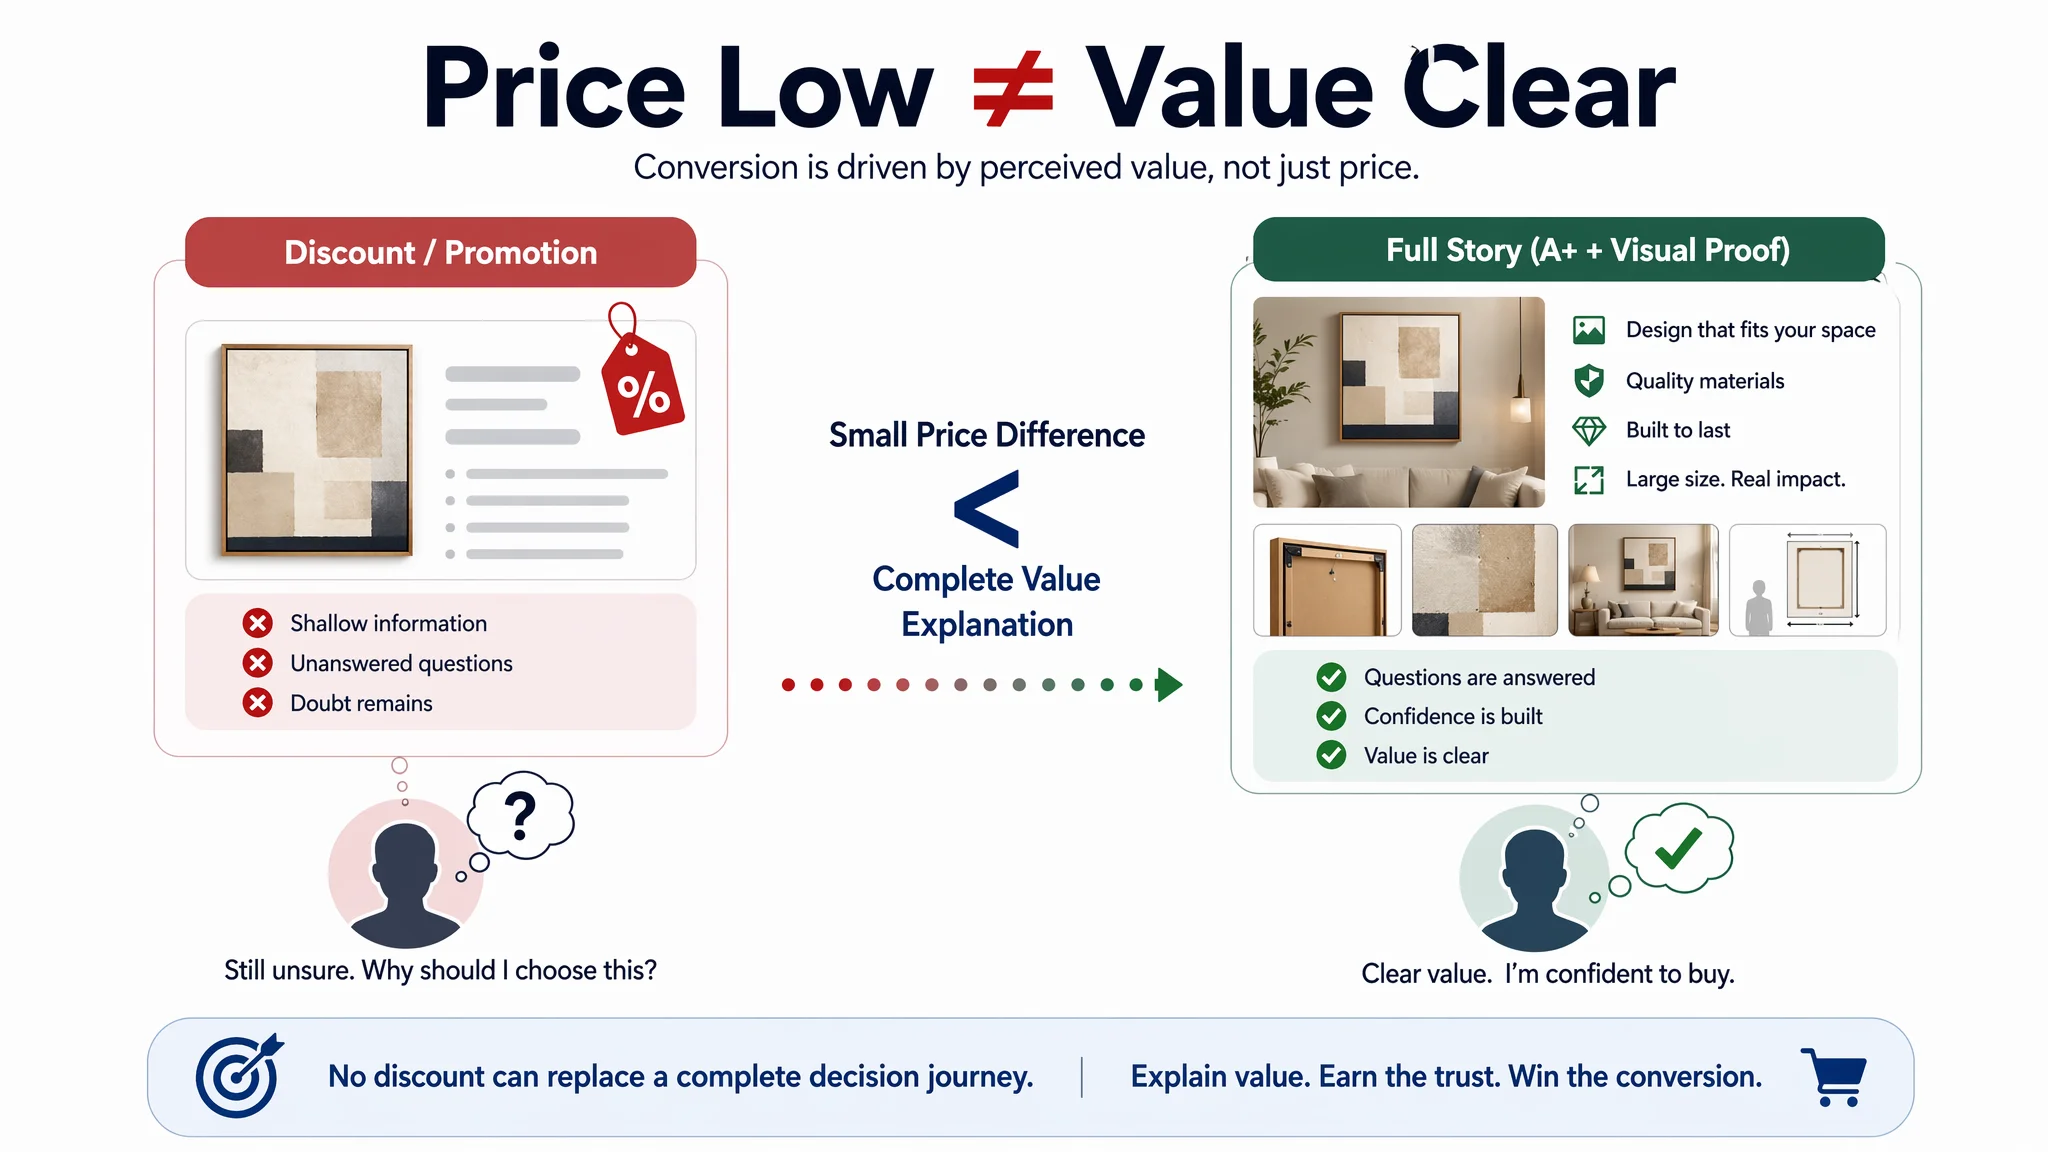
In practice, pricing analysis is only meaningful when seen alongside page quality. In the wall art example, the seller initially overfocused on bids and promotional levers—assuming that if they could just “buy cheaper traffic,” ACOS would normalize. Yet, against a benchmark that combined a similar price point with superior A+ storytelling and more complete visual proof of value, it became evident that no discount or coupon alone could compensate for an incomplete decision journey. Competing listings weren’t simply cheaper or more aggressive on deals; they were packaged in a way that made their price feel justified.
This is a common pattern: sellers interpret underperformance as a signal to cut prices or add promotions, when competitor analysis often shows that buyers are willing to pay comparable or even higher prices as long as the listing fully explains why. By comparing your price in the context of competitors’ content, reviews, and A+ stories, you can differentiate between a genuine pricing issue and a perceived-value issue rooted in the listing itself.
Customer Reviews and Feedback
Customer reviews are a direct source of market intelligence. Analyze the star rating distribution, the total volume of reviews, and the specific feedback within them. Look for recurring praise that highlights a competitor's strengths and, more importantly, common complaints that reveal product gaps or unmet customer needs. This Voice of the Customer (VoC) analysis provides a clear roadmap for product improvements and highlights marketing angles you can use to differentiate your offer.
In the wall art case, reviews were not disastrous but they also did not provide the safety net the seller assumed. The target listing sat at 4.4 stars with 28 reviews and a noticeable share of negative reviews on the first page, while the benchmark sat at 4.6 stars with a much higher review count and no visible negative reviews on the front page. The seller’s internal narrative was, “Once we get more reviews, trust will naturally improve,” and they expected review volume to compensate for structural page weaknesses.
DeepBI’s diagnosis challenged that assumption. Review analysis showed that, while trust signs weren’t ideal, the more critical issue was that the rest of the listing did very little to counterbalance or contextualize those negatives. By contrast, benchmark listings used A+ modules and bullets to proactively address typical review concerns—clarifying size expectations, materials, and hanging ease—which helped prevent the same complaints from dominating perception.
This illustrates why review analysis can’t be isolated from other listing elements. Competitor reviews tell you what worries customers, and competitor content shows you how they preempt those worries. Without that connection, it’s easy to overestimate how much “more reviews” alone will fix, and underestimate how much structured information and reassurance your page needs to provide.
Keyword and Search Performance
Understanding how customers find your competitors is essential for capturing market share. Analyze their titles and bullet points to reverse-engineer their core organic keyword strategy. Furthermore, digging into their advertising performance can reveal the high-CTR and high-CVR keywords that form the backbone of their traffic acquisition. Tools like DeepBI's AdsQuant module enable this level of analysis, allowing you to identify and target the same high-value search terms to improve your own organic visibility and advertising efficiency.
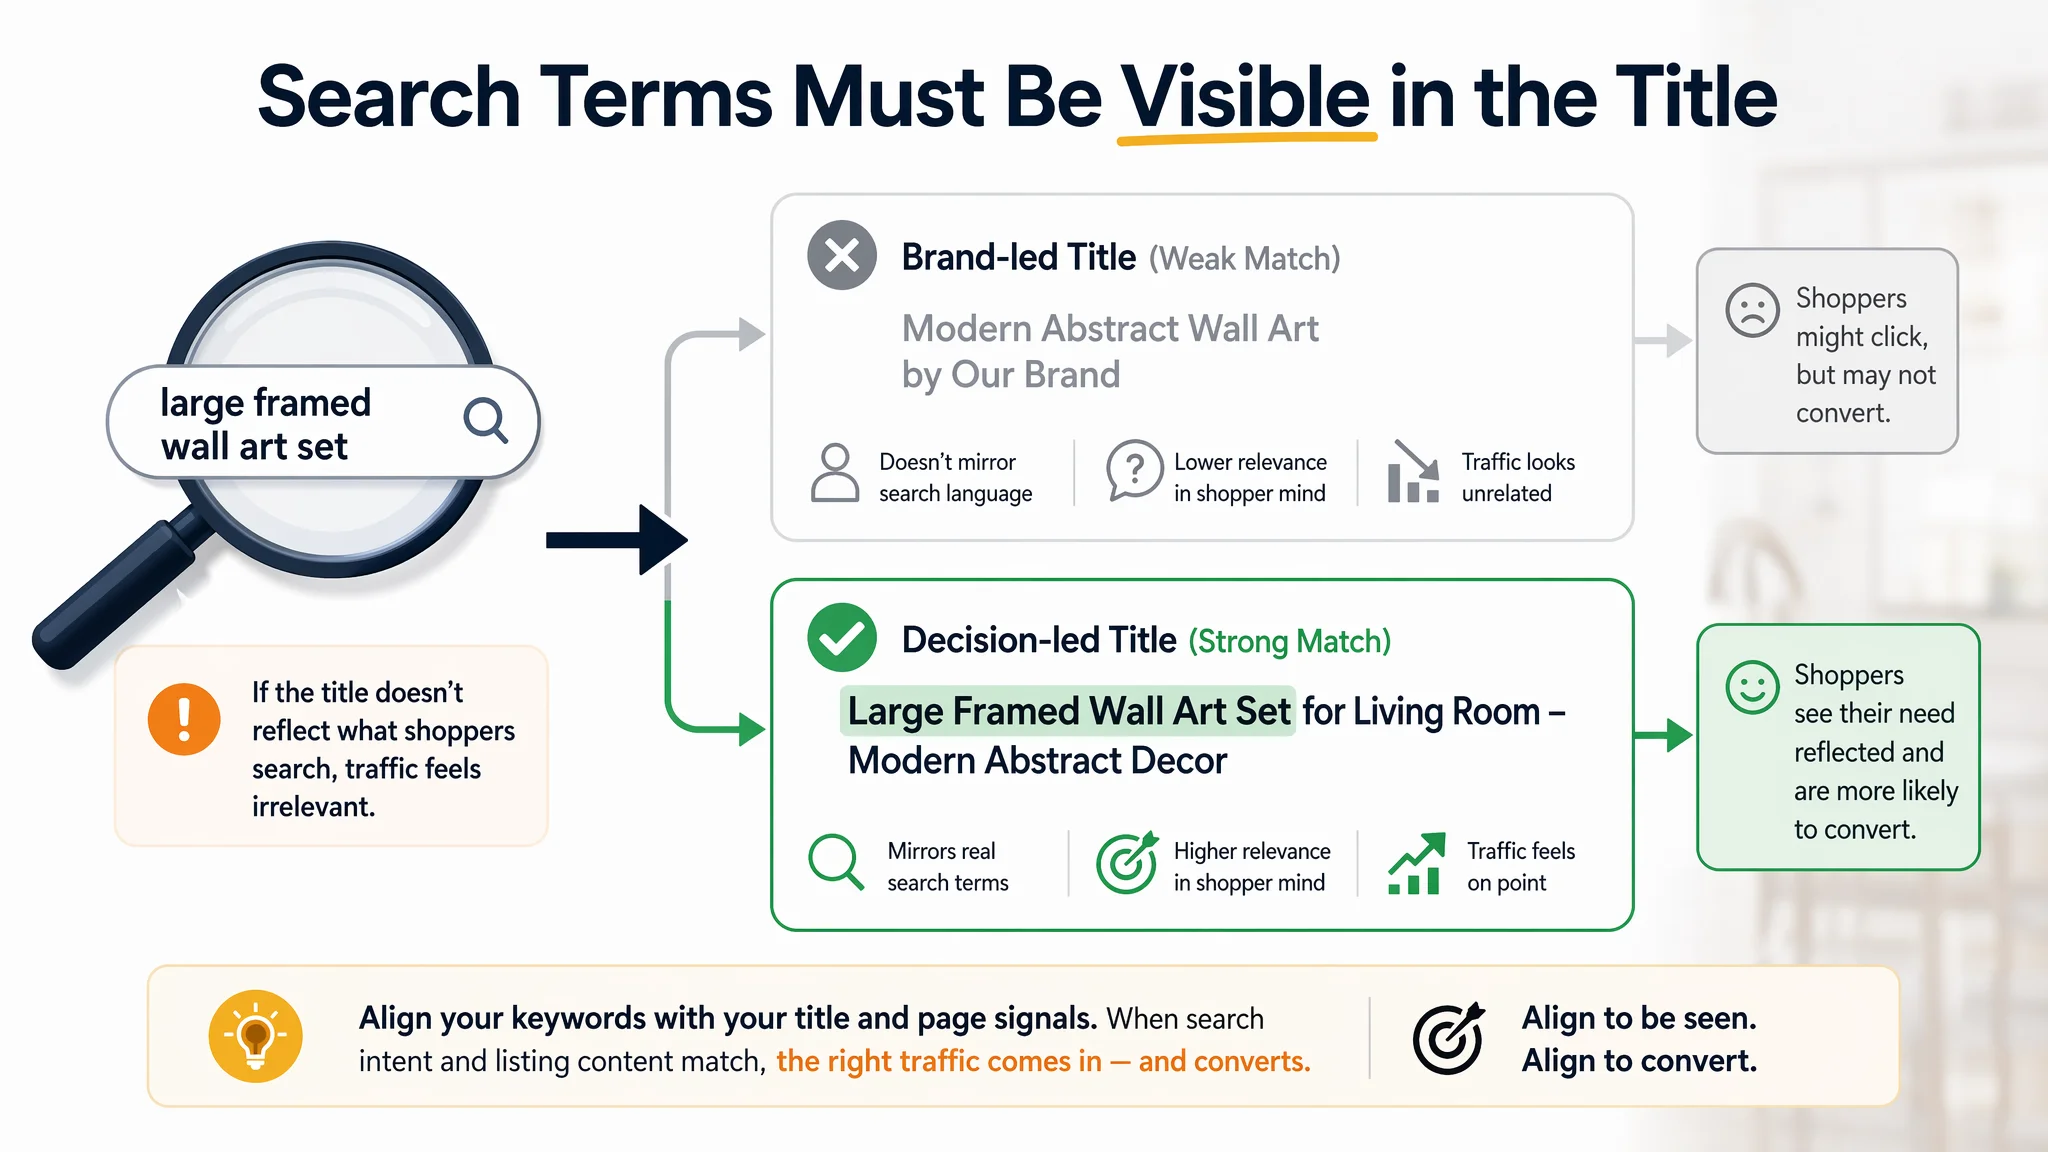
In the wall art scenario, the title comparison made the search gap explicit. The benchmark framed its title around how shoppers actually search—terms like “Large Framed Modern Abstract Wall Art 3 Piece Set” that capture both product type and size promise—while the target led with a relatively unknown brand name and vague descriptors like “Warm Style.” Size was technically present, but “large” as a visual promise and key search modifier was underemphasized, and scene keywords were broad but unfocused. This forced Amazon’s algorithm and buyers to work harder to understand relevance.
By looking at how benchmark titles and bullets stacked search terms and modifiers, the seller could shift from a brand-led label to a decision-led, keyword-rich structure: emphasizing “3 Piece Framed Wall Art Set,” “Modern Bright Warm Style Abstract Prints,” and ready-to-hang benefits. DeepBI’s keyword and listing scoring combined to show that the problem wasn’t just which keywords were bid on—it was whether the on-page text clearly signaled those terms and their associated intent. Without that alignment, even well-chosen keywords in ads send traffic to a page that looks less relevant than competitors’.
Sales Velocity and BSR
A product's Best Seller Rank (BSR) is a public indicator of its recent sales velocity. By tracking the BSR of competing products over time, you can gauge relative market demand, identify seasonal trends, and estimate their sales volume. Since sales velocity is a powerful factor in Amazon's search ranking algorithm, understanding a competitor's BSR trends helps you benchmark your own performance and set realistic growth targets.
When combined with listing-quality benchmarking, BSR trends also help clarify whether you are dealing with a traffic problem or a conversion problem. In cases like the wall art seller, ad spend was already delivering visits; the pressure point was that those visits were not translating into enough incremental orders to influence BSR in a meaningful way. Meanwhile, competing listings with stronger A+ content and more complete visual narratives were better equipped to convert both paid and organic traffic, gradually compounding their BSR advantage.
By correlating competitor BSR movements with their visible listing updates—such as new A+ layouts, refreshed main images, or evolved titles—you can infer which types of changes are likely influencing their sales velocity. Tools like DeepBI make this easier by marking visual iteration points and allowing you to relate them back to performance shifts. Instead of guessing whether a competitor’s rise is “just because of more ads,” you can see how improvements in listing conversion capacity interact with their traffic strategies to move BSR over time.
Leveraging DeepBI for Advanced Competitor Listing Analysis
Effective competitor analysis involves more than just observation; it requires a systematic process of diagnosis, planning, production, and delivery. DeepBI integrates these traditionally separate stages into a single, automated workflow. The system moves beyond manual guesswork by using a multi-dimensional benchmarking algorithm to identify your true competitors and score your listing's competitiveness across main images, titles, and A+ content.
In the wall art case, this scoring framework was what broke the seller’s “it’s an ads issue” assumption. Seeing a structured 53 vs 84 comparison, with a –21 point gap in detail/A+ content, reframed the discussion from “How do we make ads cheaper?” to “Does this listing actually deserve the traffic we’re paying for?” DeepBI’s analysis showed not only where the target listing lagged (lack of gallery-level room scenes, no structural diagrams, no size or material storytelling) but also how those gaps mapped directly to what benchmarks were doing well.
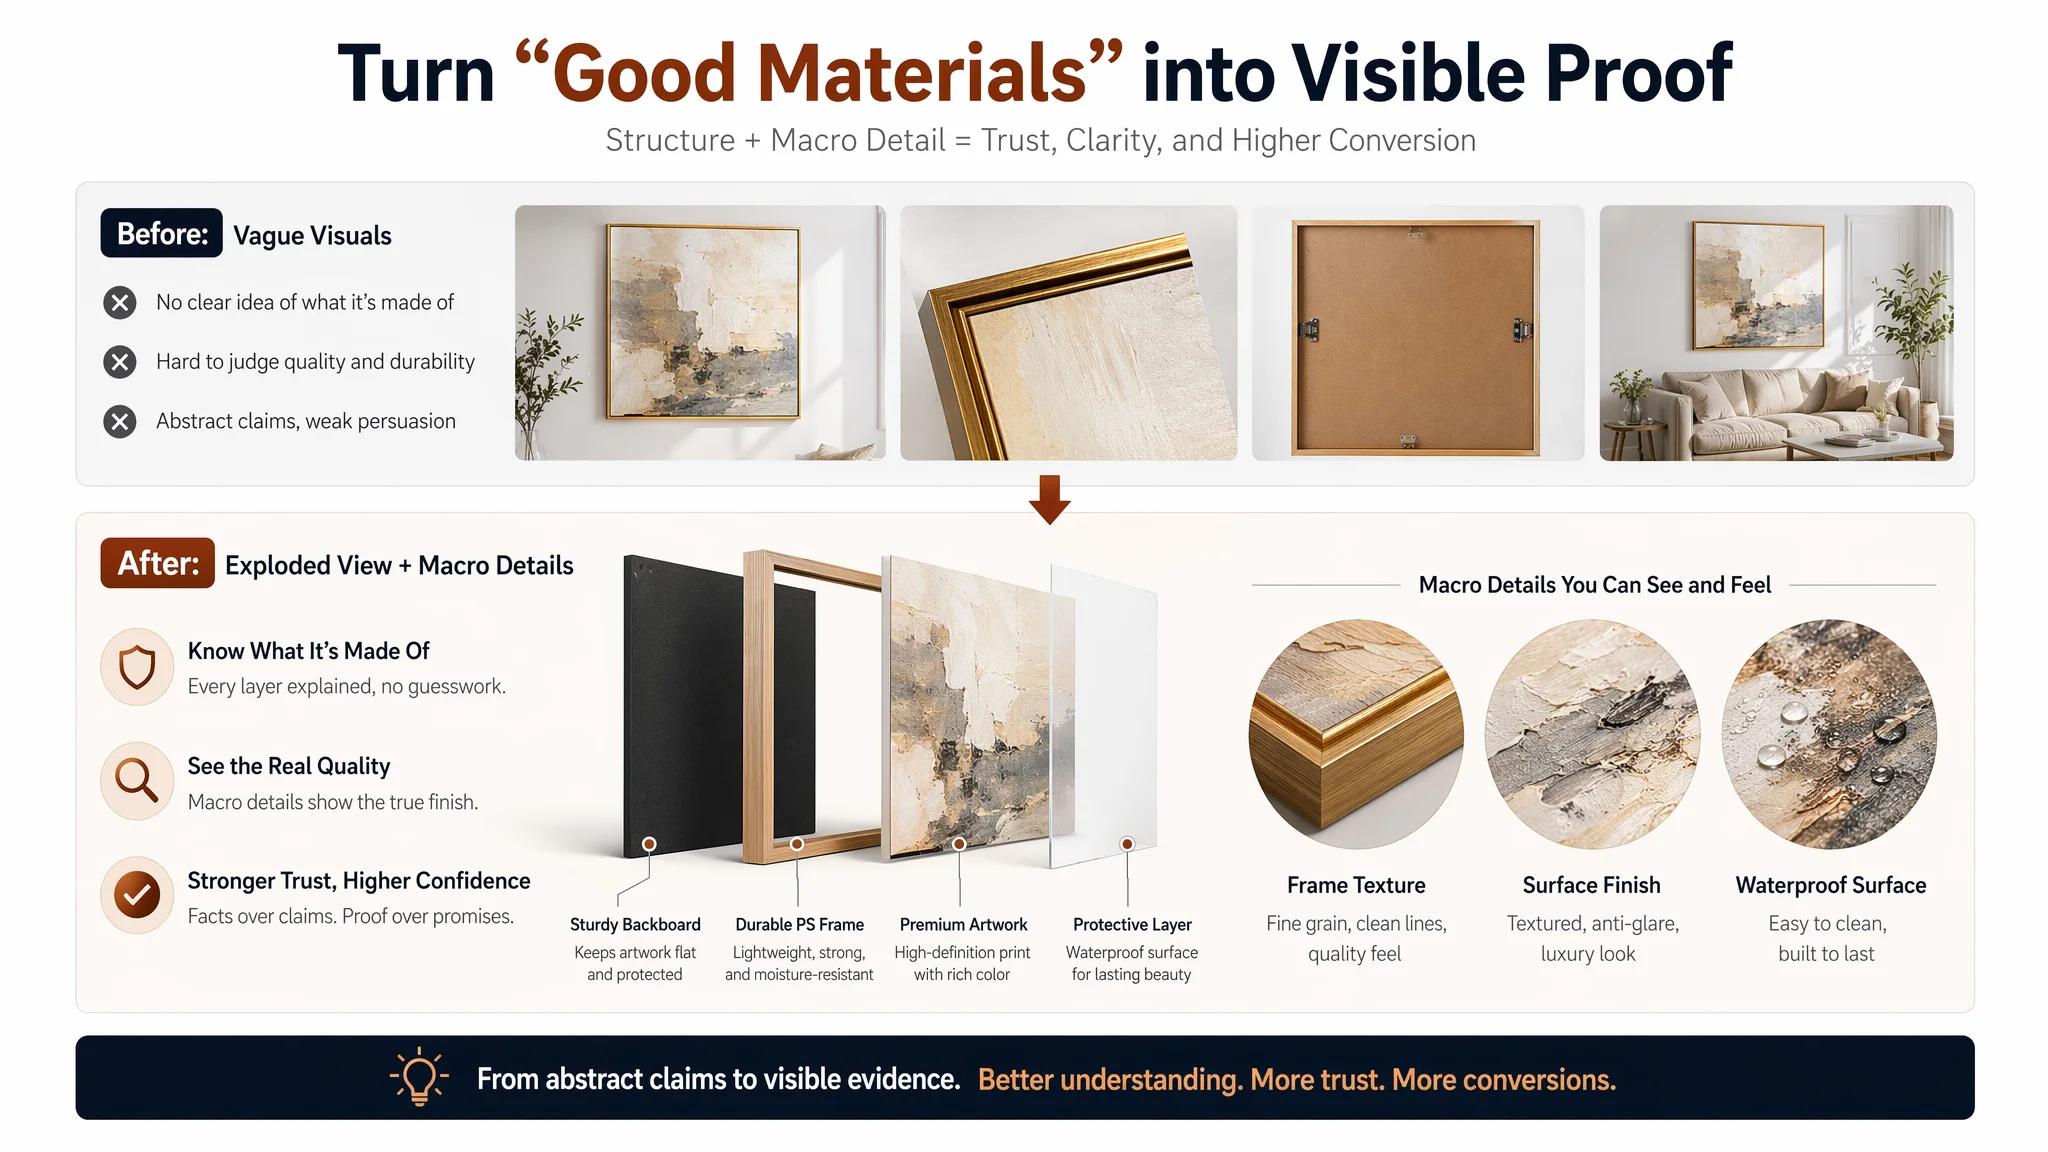
This data-driven diagnosis allows DeepBI to translate vague goals like "improve visual appeal" into precise, AI-executable instructions. In the wall art example, that meant specifying a new hero image composition—minimalist living room, centered triptych, spotlighting to create a gallery-like effect—as well as additional images showing 45° frame depth, exploded construction layers, and macro surface details to visually prove material quality. It also meant re-structuring bullet points from a feature list into a buying chain and designing an A+ sequence that walked buyers through style fit, materials, structure, size, and care.
During asset generation, the system enforces a strict "product entity consistency" principle, ensuring the AI never alters the product's physical design, which helps mitigate the risk of negative reviews from "product-image mismatch" issues. This is particularly important in categories like wall art, where misrepresenting color, finish, or frame construction can quickly lead to disappointment and returns.
Finally, DeepBI closes the loop with a "One-Click Apply" function. This feature uses the Amazon SP-API to sync your newly optimized, analysis-driven assets directly to your listing backend. In the wall art project, this meant that once a complete A+ narrative and new image set were generated, the seller did not have to manually download, upload, and reconfigure each asset—a process that previously consumed valuable time and introduced errors. Instead, updates could go live in seconds, allowing the team to start testing the impact on CTR and CVR much faster. This transforms an operation that previously took over 30 minutes of manual downloading and uploading into a seamless process that completes in seconds, dramatically reducing listing cycle time and accelerating your ability to improve CTR and CVR.
Implementing Insights for Listing Optimization
The primary challenge for sellers is not just gathering competitor data, but effectively translating those insights into tangible improvements for their own listings. Moving from analysis to execution requires a structured approach that replaces subjective guesswork with precise, data-driven actions. This involves systematically upgrading every component of your product detail page, from titles and bullet points to images and A+ Content.
The wall art seller’s journey illustrates how this shift in mindset plays out in practice. Initially, their focus was almost entirely on tinkering with ads while treating listing upgrades—especially A+—as optional. Once competitor analysis clarified that the biggest performance gap was inside the page, the sequencing of work changed: first rebuild listing conversion capacity, then refine traffic strategy.
Instead of offering vague advice like "improve your title," an effective optimization system provides concrete instructions. For example, it can restructure a title based on a proven formula—Brand + Core Selling Point + Product Form + Modifiers—while integrating high-performing keywords. In the wall art case, this meant moving from a brand-led, somewhat abstract title to a decision-led one that foregrounded “3 Piece Framed Wall Art Set,” “Modern Bright Warm Style Abstract Prints,” room scenes, and “Ready to Hang” benefits. Similarly, it can transform a simple feature in a bullet point, like "10000mAh," into a compelling benefit statement that addresses a customer pain point, such as "No more power anxiety." For the wall art listing, technical mentions of printing and materials were reframed into promises about long-term appearance, safety, and ease of cleaning.
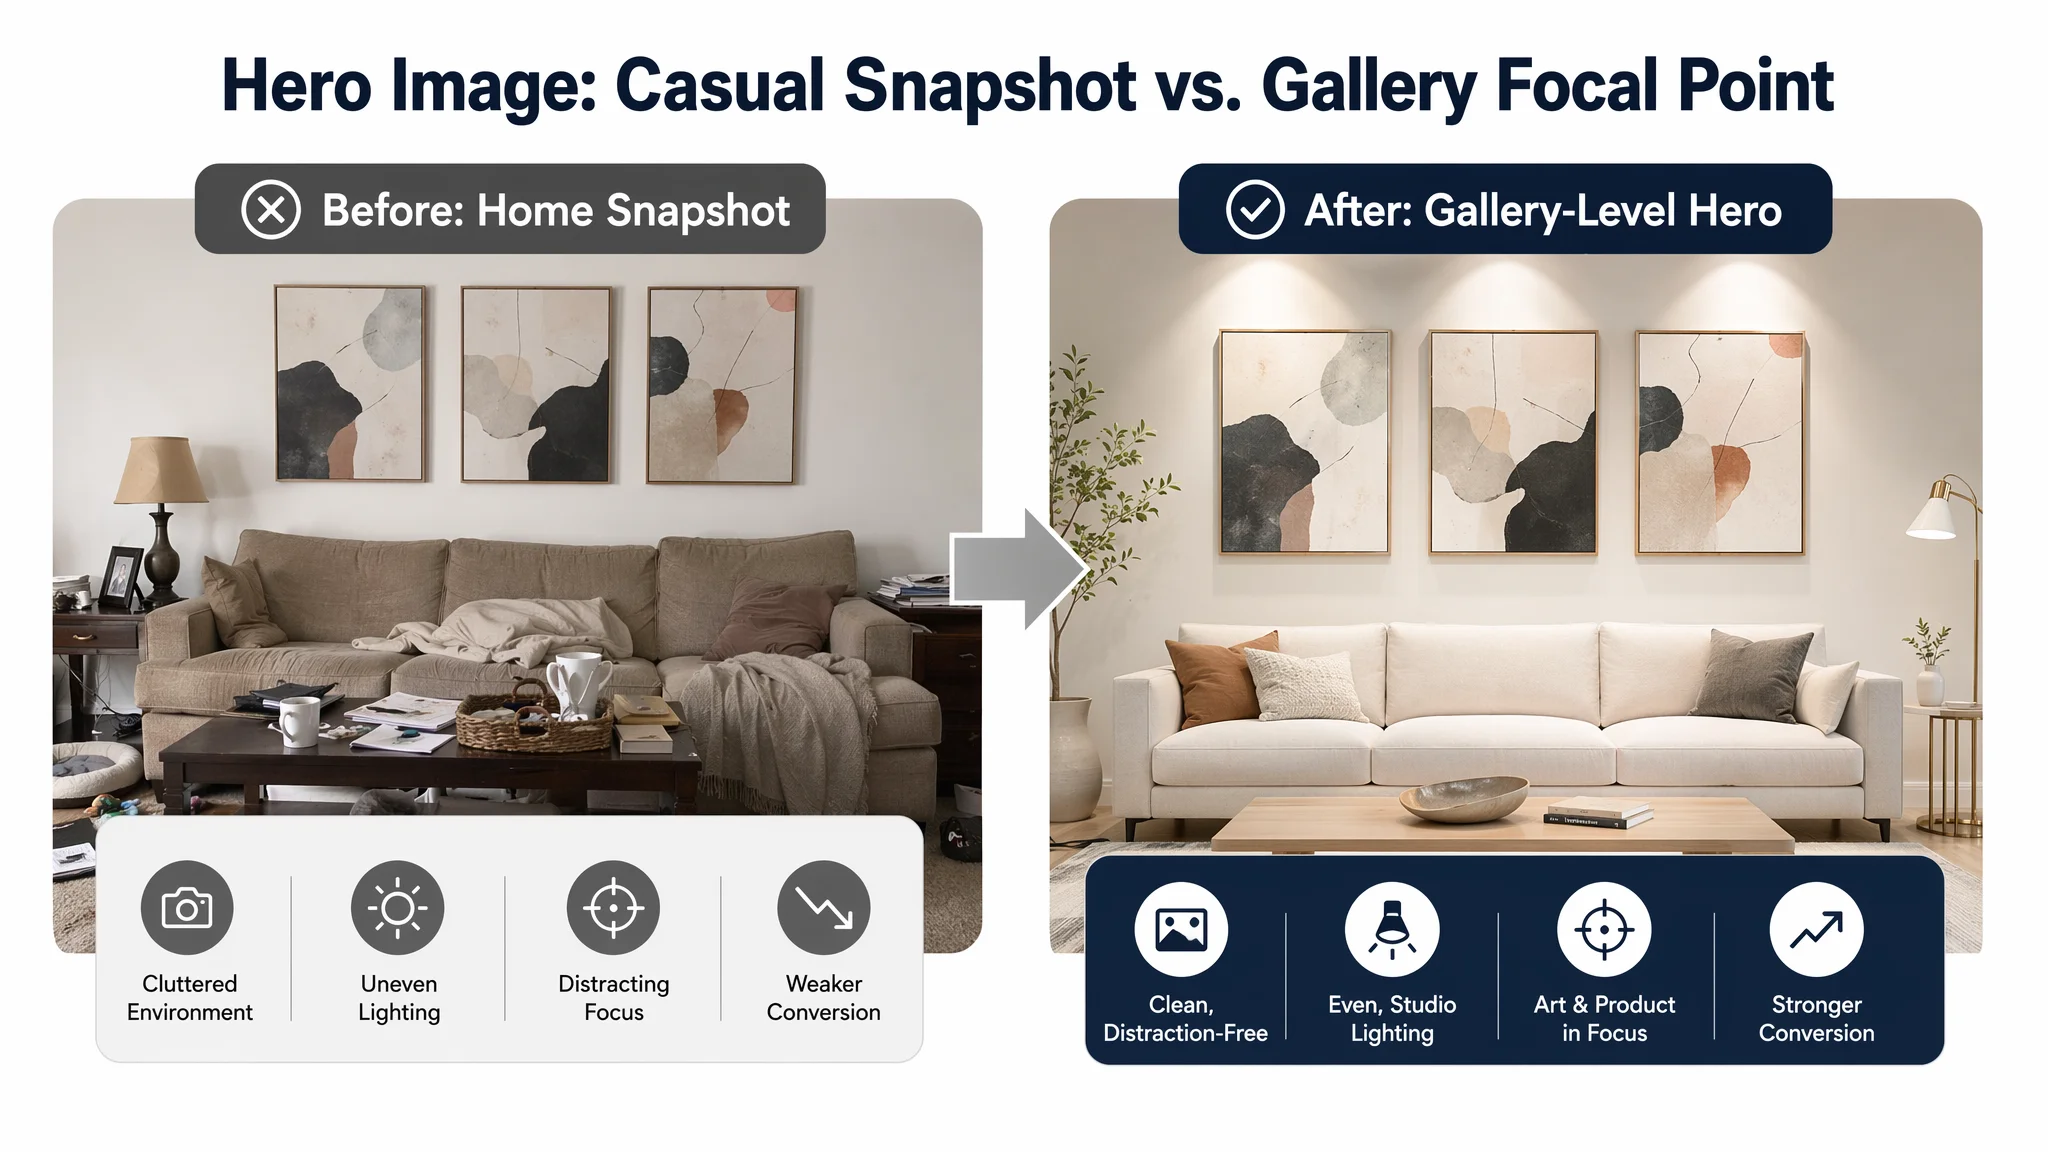
For images, this means moving beyond ambiguous suggestions to engineered parameters for composition, camera angles, and lighting. In the wall art example, that translated into specific directions such as:
- Replace cluttered home snapshots with minimalist, well-lit room scenes that position the art as a centerpiece.
- Add 45° side-view images to show frame depth and quality.
- Create exploded construction and macro surface visuals to support claims about durability and finish.
- Build an A+ arc that mirrors top competitors: brand scene, multi-room compatibility, material close-ups, size reference, structural diagram, and care guide.
DeepBI streamlines this entire process with a closed-loop system that connects diagnosis directly to delivery. After generating optimized text and visual assets, the "One-Click Apply" feature uses Amazon's SP-API to sync the new content directly to your seller backend. This reduces an update process that once took over 30 minutes of manual downloading and uploading to mere seconds. Crucially, once an update is live, the system automatically marks a "visual iteration event point" in your advertising reports. In scenarios like the wall art listing, this allows sellers to finally see whether “fixing the page first” changes how ad traffic behaves—tracking shifts in CTR, CVR, and ACOS around the moment the new hero images and A+ went live. This creates a continuous feedback loop for ongoing, data-backed optimization instead of episodic, intuition-driven tweaks.
Conclusion
In the hyper-competitive Amazon marketplace, simply reacting to market shifts is a strategy for falling behind. Proactive, data-driven competitor analysis is the engine of sustained growth. The challenge for many sellers has been bridging the gap between diagnosing a competitor's strengths and executing a superior listing. Traditional optimization, often fragmented and based on subjective aesthetics, frequently fails to produce measurable gains in key metrics like click-through rate (CTR) and conversion rate (CVR).
The wall art seller’s experience is a concrete reminder of what happens when that gap remains unaddressed. For months, they treated ACOS as an ads-only problem—turning knobs in the ad account while leaving a zero-score A+ section and shallow visual narrative untouched. Competitor analysis, powered by DeepBI, reframed the situation: the ads were not failing; the listing simply lacked the conversion architecture that competing pages used to earn trust. Once that realization set in, priorities shifted from “buy cheaper clicks” to “build a page that deserves those clicks,” and listing work—title restructuring, bullet logic, image upgrades, and complete A+ storytelling—moved to the front of the queue.
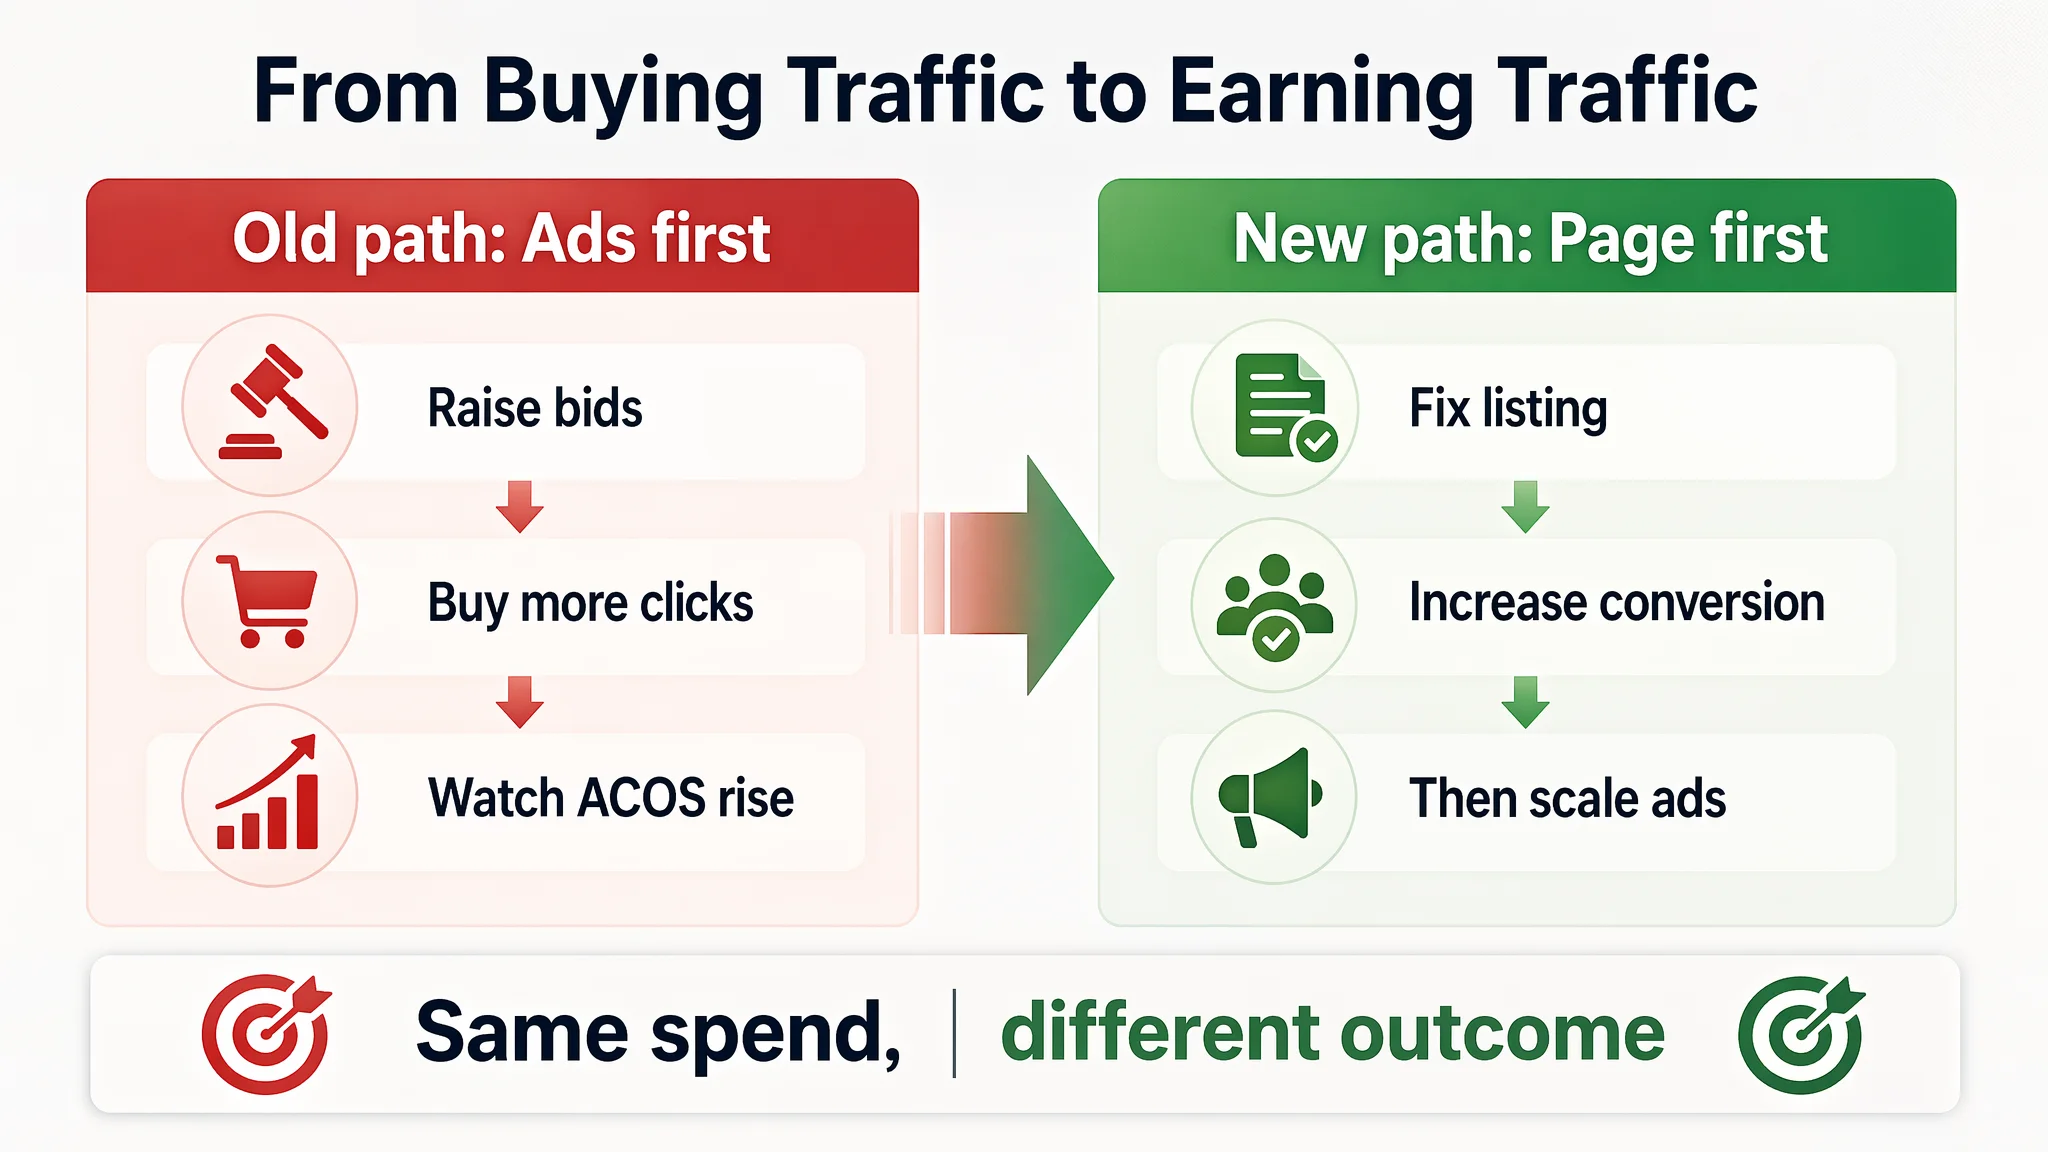
The solution lies in adopting a unified, end-to-end system that integrates diagnosis, planning, content production, and delivery into a single, intelligent workflow. This transforms listing optimization from an occasional project into a continuous, scientific process driven by market data. Tools like DeepBI embody this shift, moving beyond simple content generation to become operational decision execution systems. By transforming operational experience and competitor signals into a clear data evidence chain, they help sellers avoid the common misjudgment of blaming traffic for what is fundamentally a page problem.
Ultimately, this systematic approach—marrying better listings with precise traffic—is what builds a lasting competitive moat and secures long-term, healthy growth for your brand on Amazon. Before scaling ad spend or chasing new keywords, the key question becomes: “Does this listing, measured against my real competitors, fully earn the right to that traffic?” Competitor listing analysis, supported by structured tools, is how you answer that question with evidence instead of guesswork.