


Introduction: The Imperative of Data-Driven Amazon Ads
In the increasingly competitive Amazon marketplace, rising advertising costs and data saturation have rendered basic campaign management obsolete. Success is no longer achievable through intuition or surface-level adjustments; it demands a 'precise collaboration' based on data algorithms. Sellers are often overwhelmed by a flood of performance metrics, struggling to move beyond the standard reports in the Advertising Console or Seller Central. These native tools, while useful for a high-level overview, lack the granularity required to diagnose the root causes of a high ACoS or a low click-through rate (CTR), making it difficult to connect ad spend directly to profit growth.
Making campaign modifications based on subjective assumptions is a common and costly mistake, frequently leading to a decline in key performance indicators despite significant investment. The critical challenge lies in transforming raw advertising data into a clear evidence chain that informs every decision. To gain a competitive edge, sellers must adopt a system that can accurately diagnose performance gaps, translate business strategy into executable actions, and measure the true impact of every optimization.
This gap between “what we think is happening” and “what the data proves is happening” shows up repeatedly in real accounts. One car electronics seller, for instance, was convinced that their rising ACoS and unstable return were caused by “poor ads.” Their Amazon Bluetooth car charger listing had a strong internal audit score and, on paper, even outperformed a key competitor. Because the page looked “good” in isolation, every discussion stayed on keywords, bids, and budgets. But once the data was broken down more systematically—title behavior on the SERP, main-image click behavior, trust buildup in A+ content—it became clear that the problem was not lack of traffic volume. Ads were doing their job; the listing’s decision logic at click and purchase stages was not.
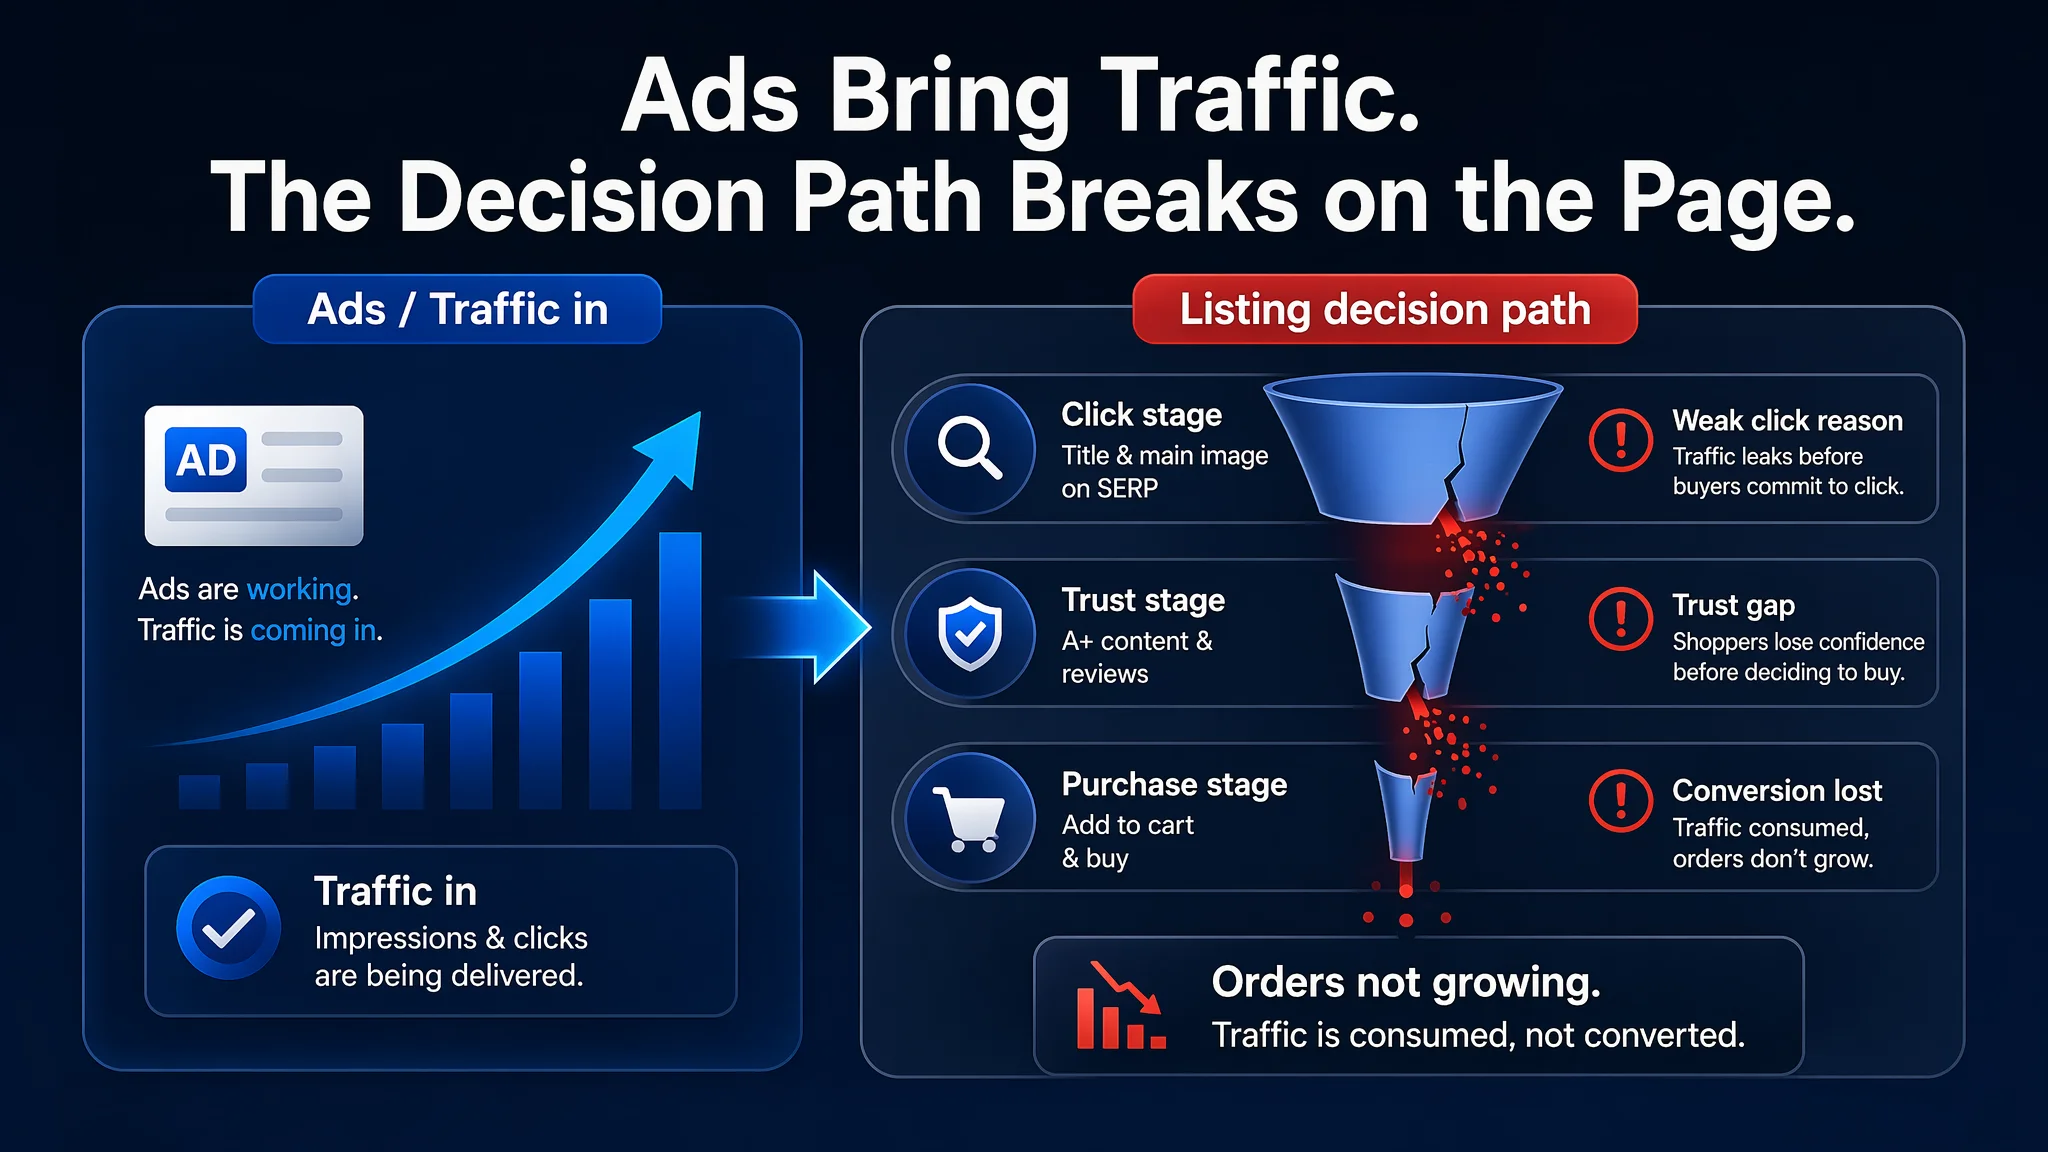
This is where the integration of specialized tools becomes essential. DeepBI serves as the intelligent optimization engine, designed to break down the fragmented process of 'diagnosis, planning, and execution' into a seamless, data-driven workflow. It transforms abstract operational experience into concrete, actionable insights. When paired with Microsoft Power BI, this capability is amplified. Power BI provides a powerful and flexible visualization platform, allowing sellers to build custom dashboards and reports that translate DeepBI’s sophisticated analysis into clear, strategic business intelligence. This combined approach creates an end-to-end system for mastering Amazon advertising, ensuring every decision is backed by data and aimed at maximizing both conversion rate (CVR) and profitability.
DeepBI: Your Foundation for Amazon Ads Data Excellence
Effective Amazon advertising analysis requires more than raw data; it demands a structured and reliable foundation. DeepBI provides this by collecting, processing, and structuring your Amazon Ads data into an actionable intelligence layer. It moves beyond simple metric reporting to diagnose performance issues at specific stages of the customer journey, creating a robust dataset primed for advanced analytics in Power BI.
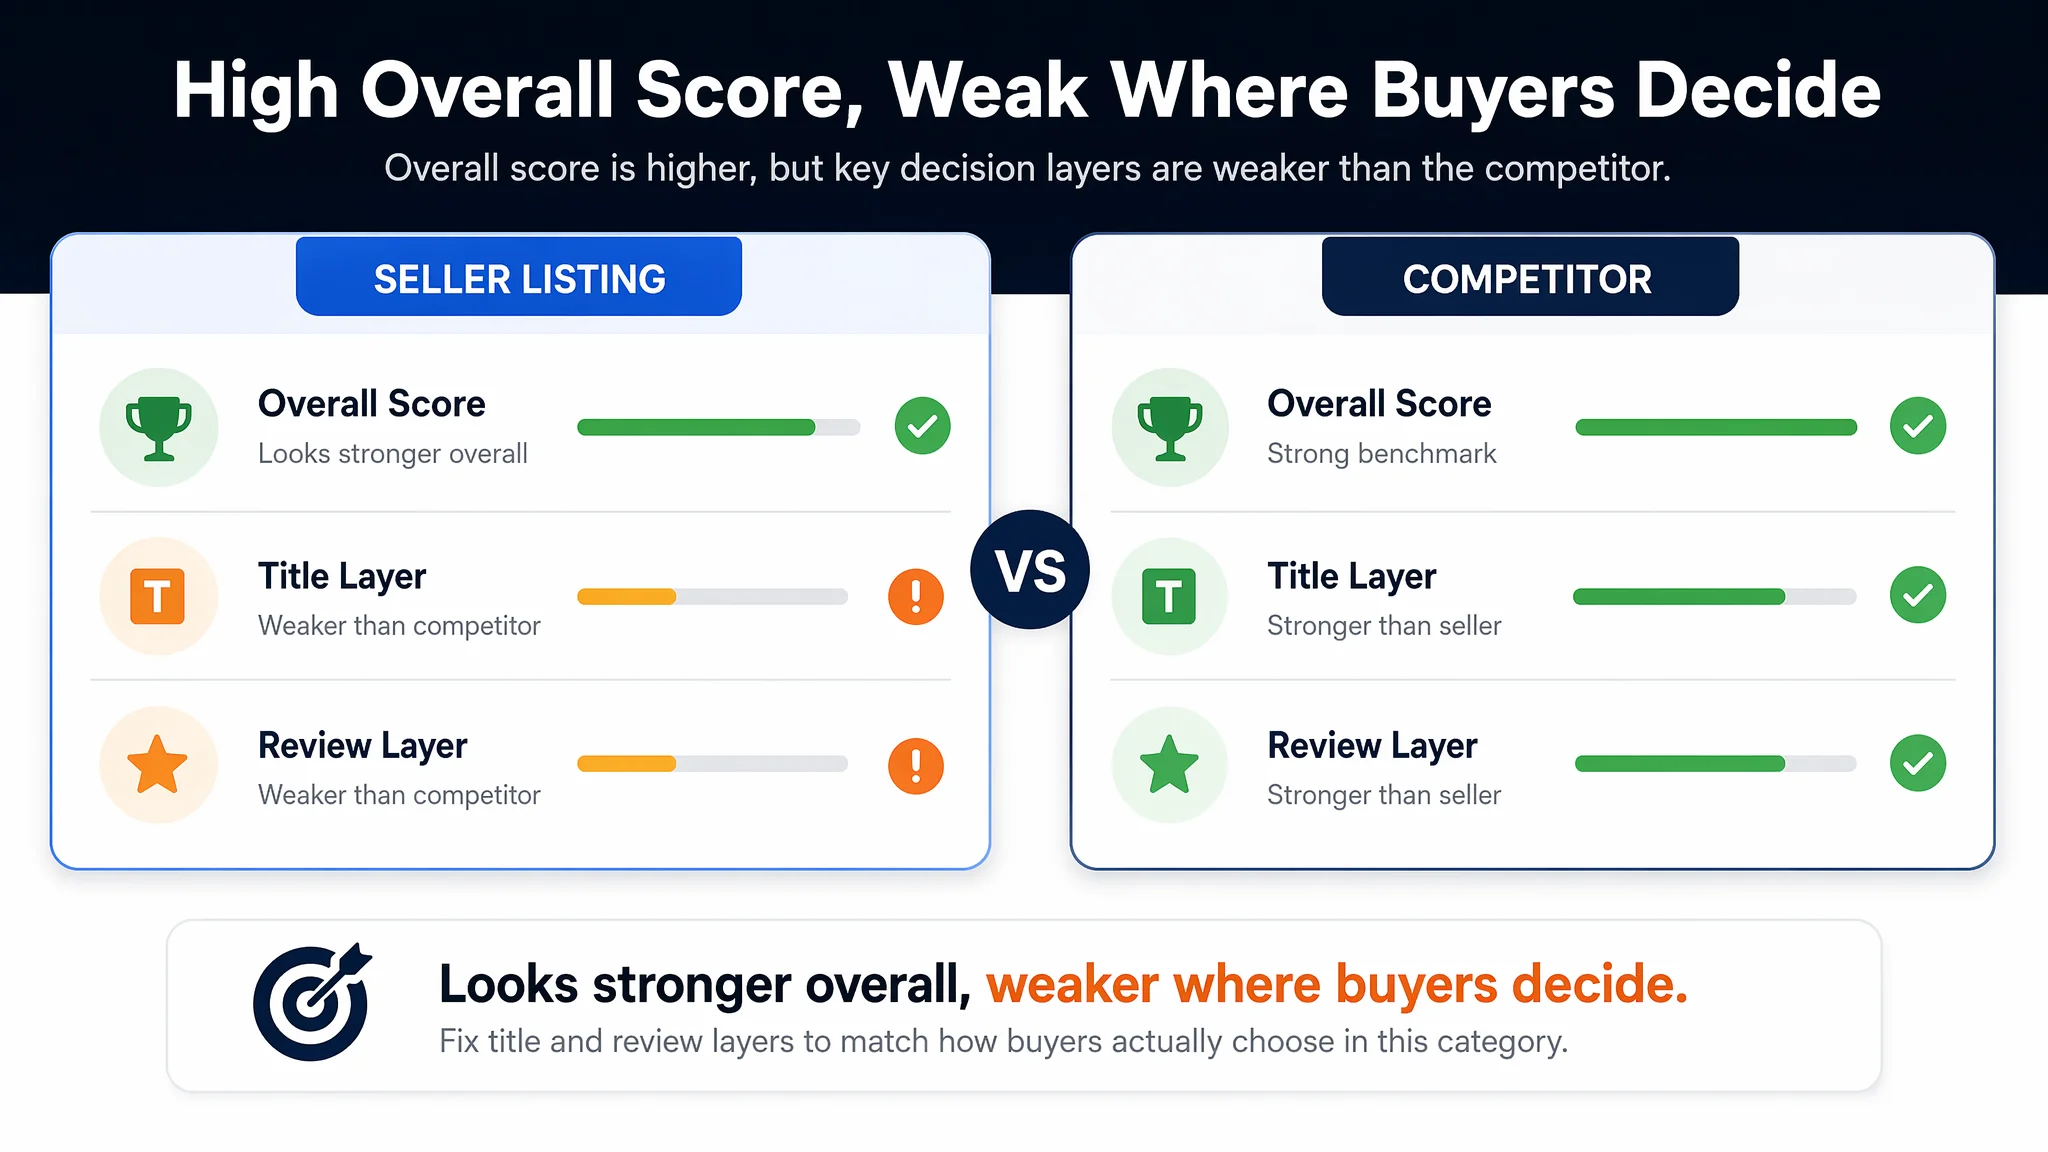
In practice, this means DeepBI is not just saying “ACoS is high” or “CTR is low,” but tying those symptoms back to specific parts of your listing and funnel. In the Bluetooth car charger example, the seller came in thinking, “Our listing is already strong; if ACOS is under pressure, it must be an advertising problem.” DeepBI’s full-page audit told a more nuanced story:
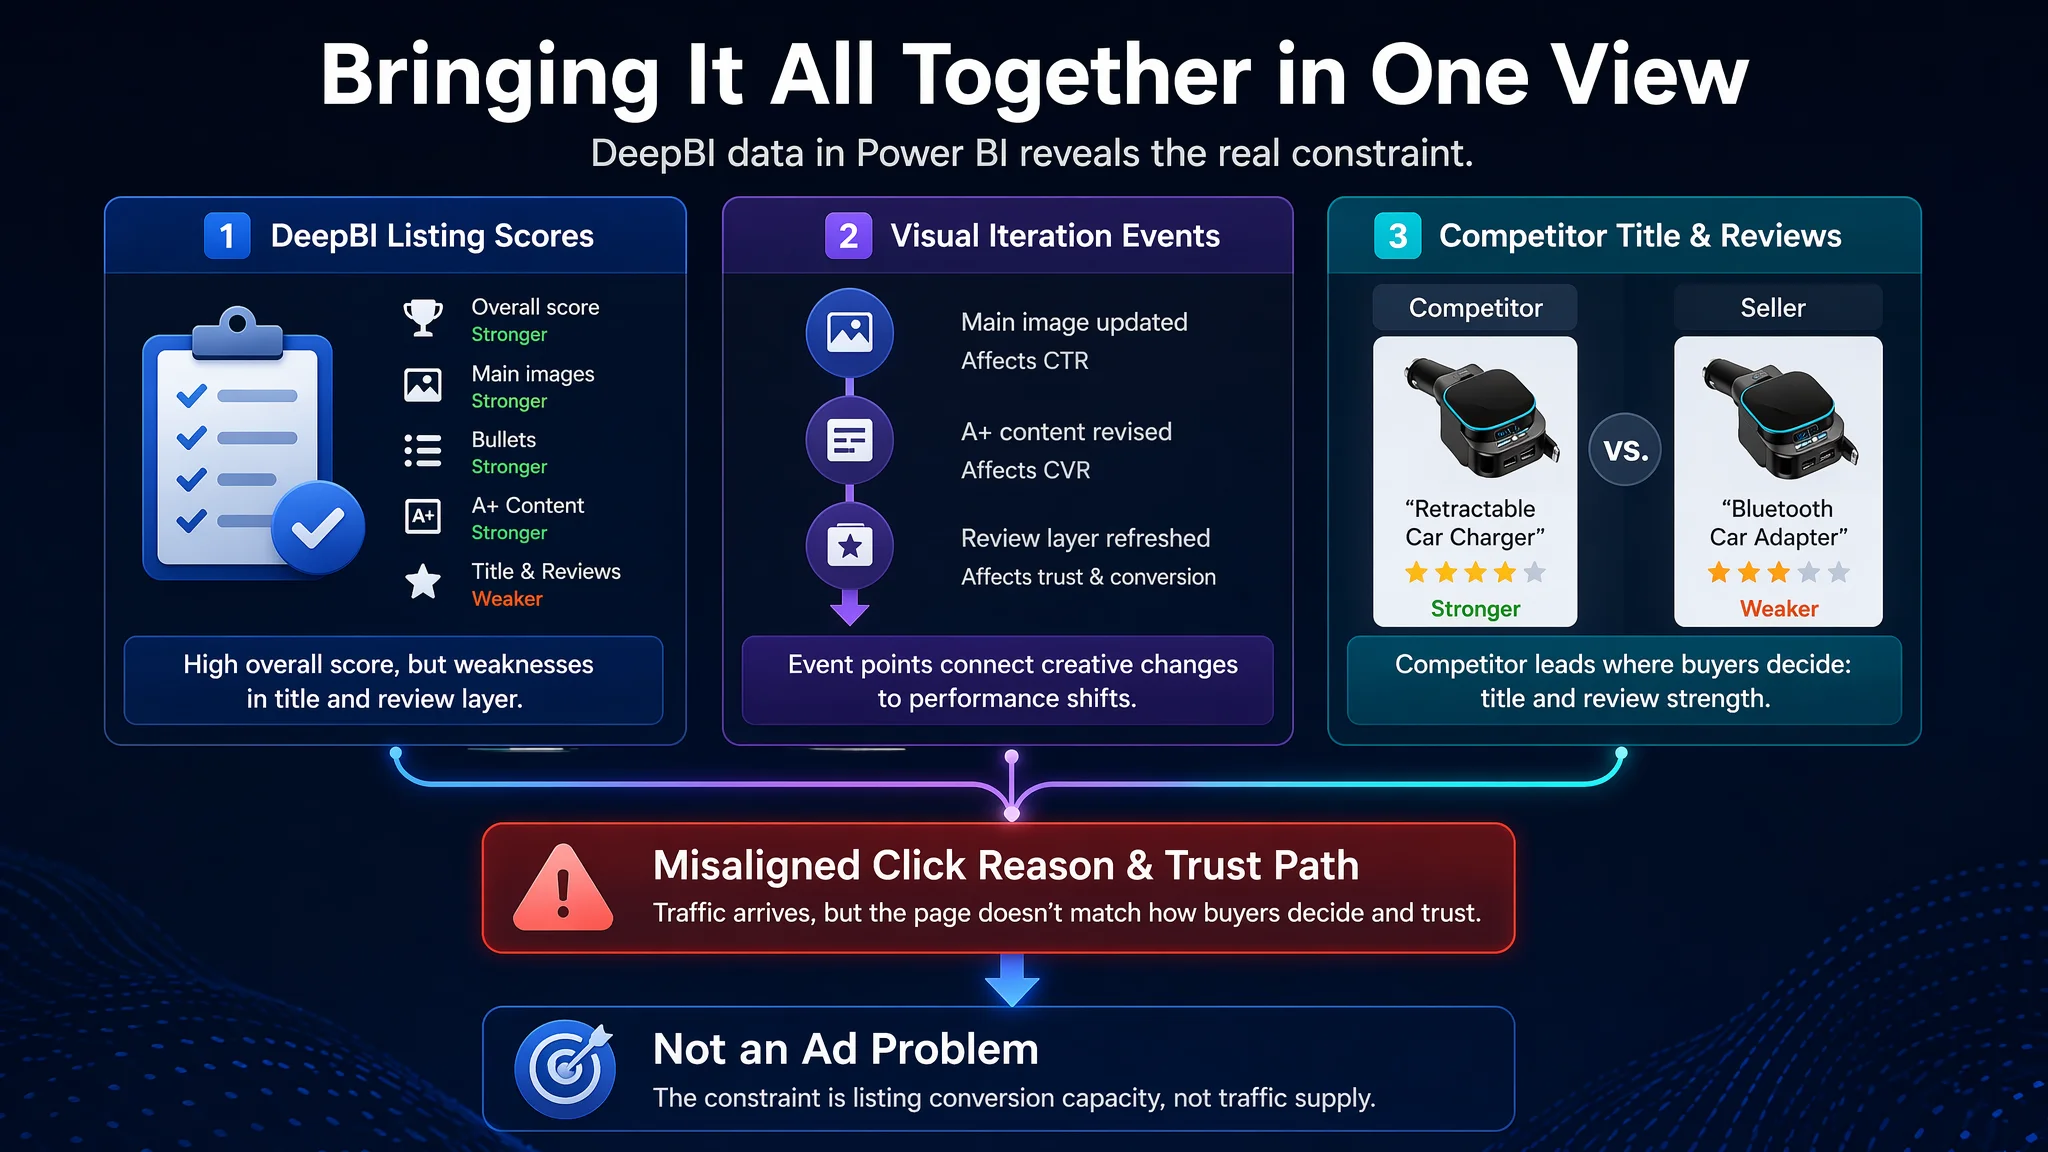
- Overall listing score higher than a benchmark competitor.
- Stronger scores in main images, bullets, and A+ content.
- Slightly weaker scores in title and review layer.
On a surface scorecard, this looked like a win. But when DeepBI overlaid these scores with funnel behavior—where clicks were coming from, how shoppers behaved on the SERP, where the trust curve broke inside the page—it highlighted a different bottleneck: the listing was not aligned with how buyers in that subcategory actually decide.
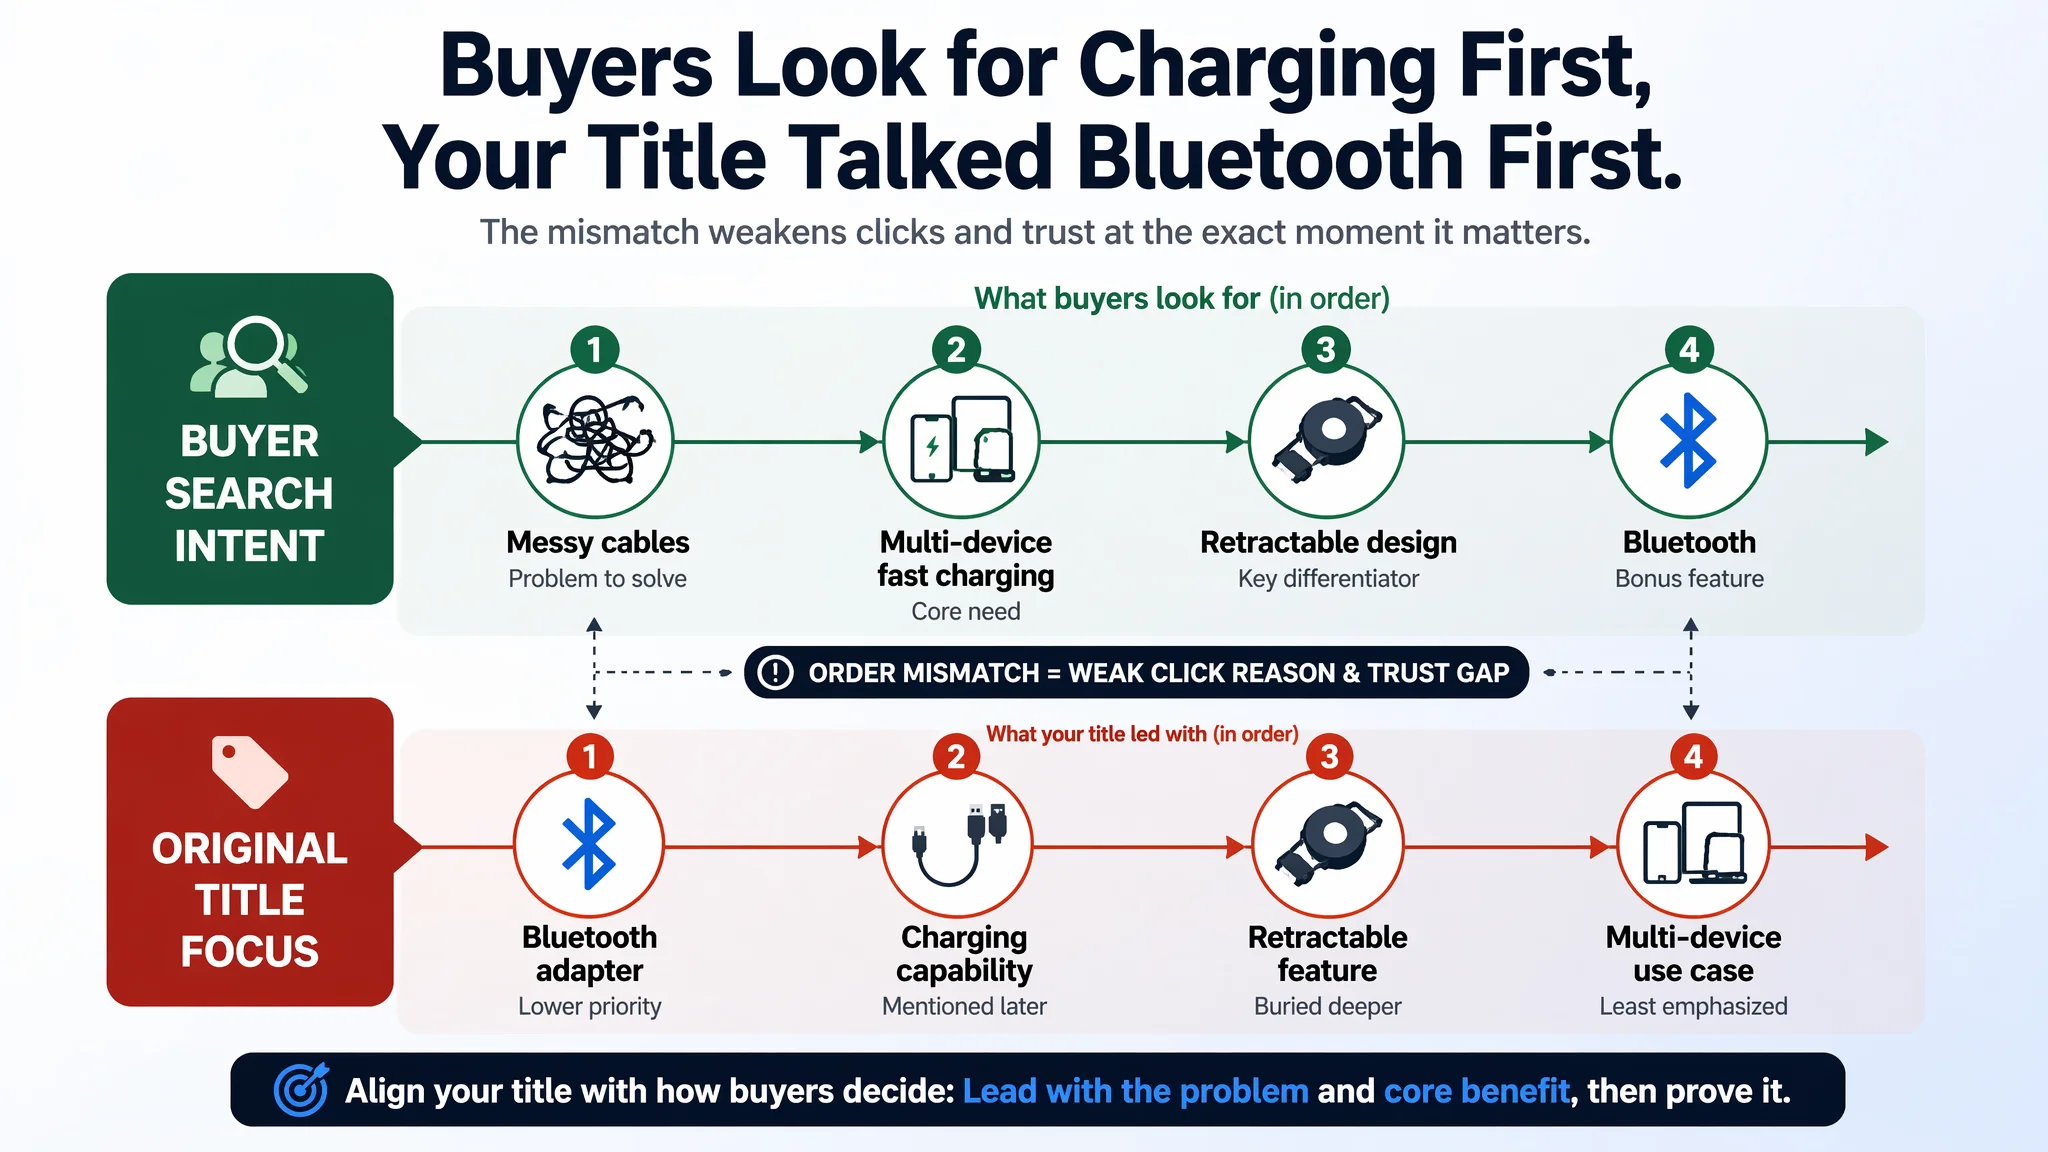
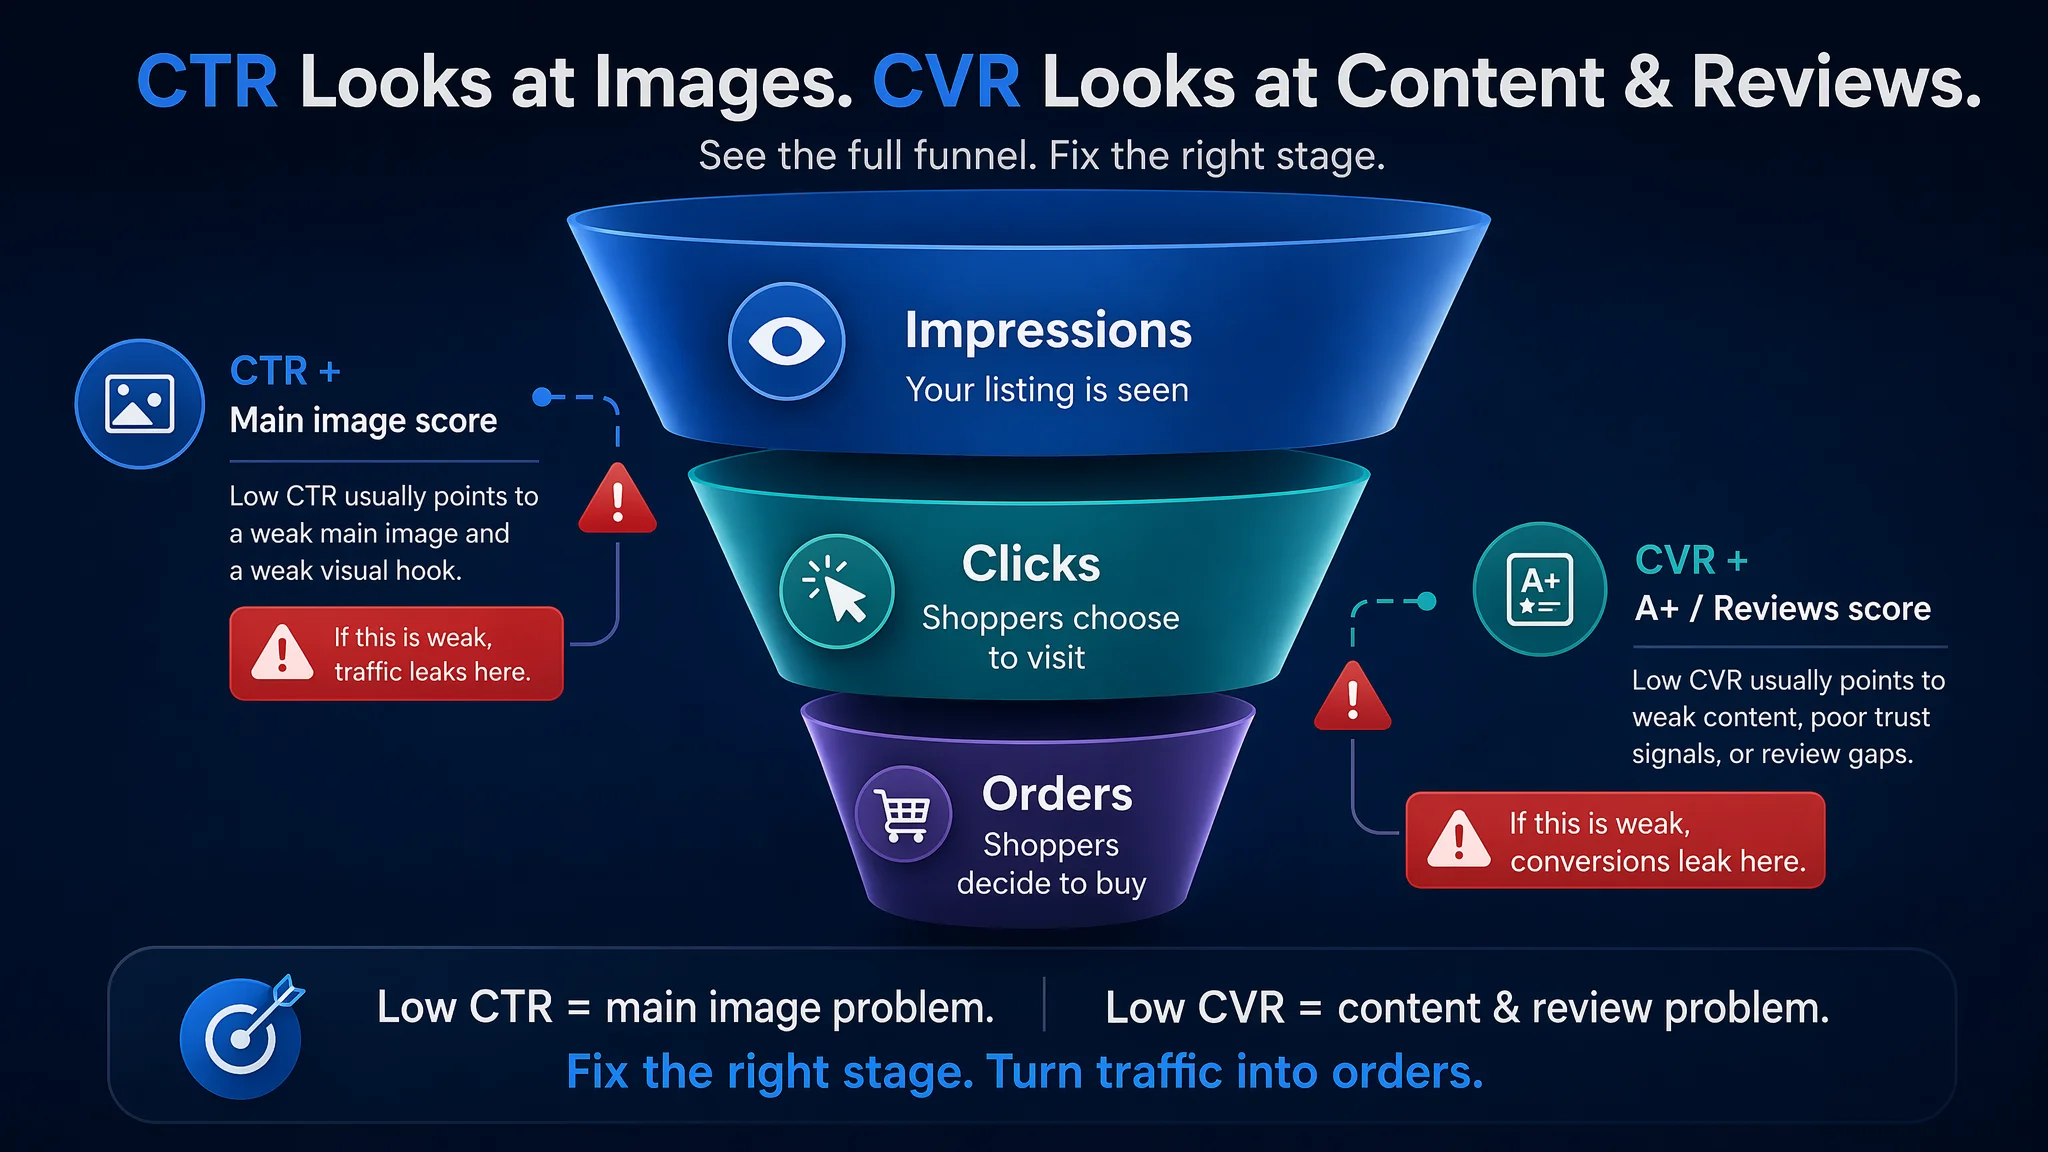
The platform’s strength lies in its ability to create a data-driven feedback loop for creative optimization. It analyzes ad performance through a funnel logic: a low Click-Through Rate (CTR), for example, points to a weakness in the main image, while a low Conversion Rate (CVR) suggests issues with A+ content. In the car charger case, DeepBI flagged the title and first-image layer as the weakest links relative to category behavior, even though internal content depth was high. The title led with “Bluetooth car adapter” when buyers were primarily searching for a retractable multi-port car charger. The first image looked more like a generic product card than a device clearly living in a real car interior. As a result, the listing was “over-built” deeper down the page, but underpowered at the exact moment where click intent and trust are formed.
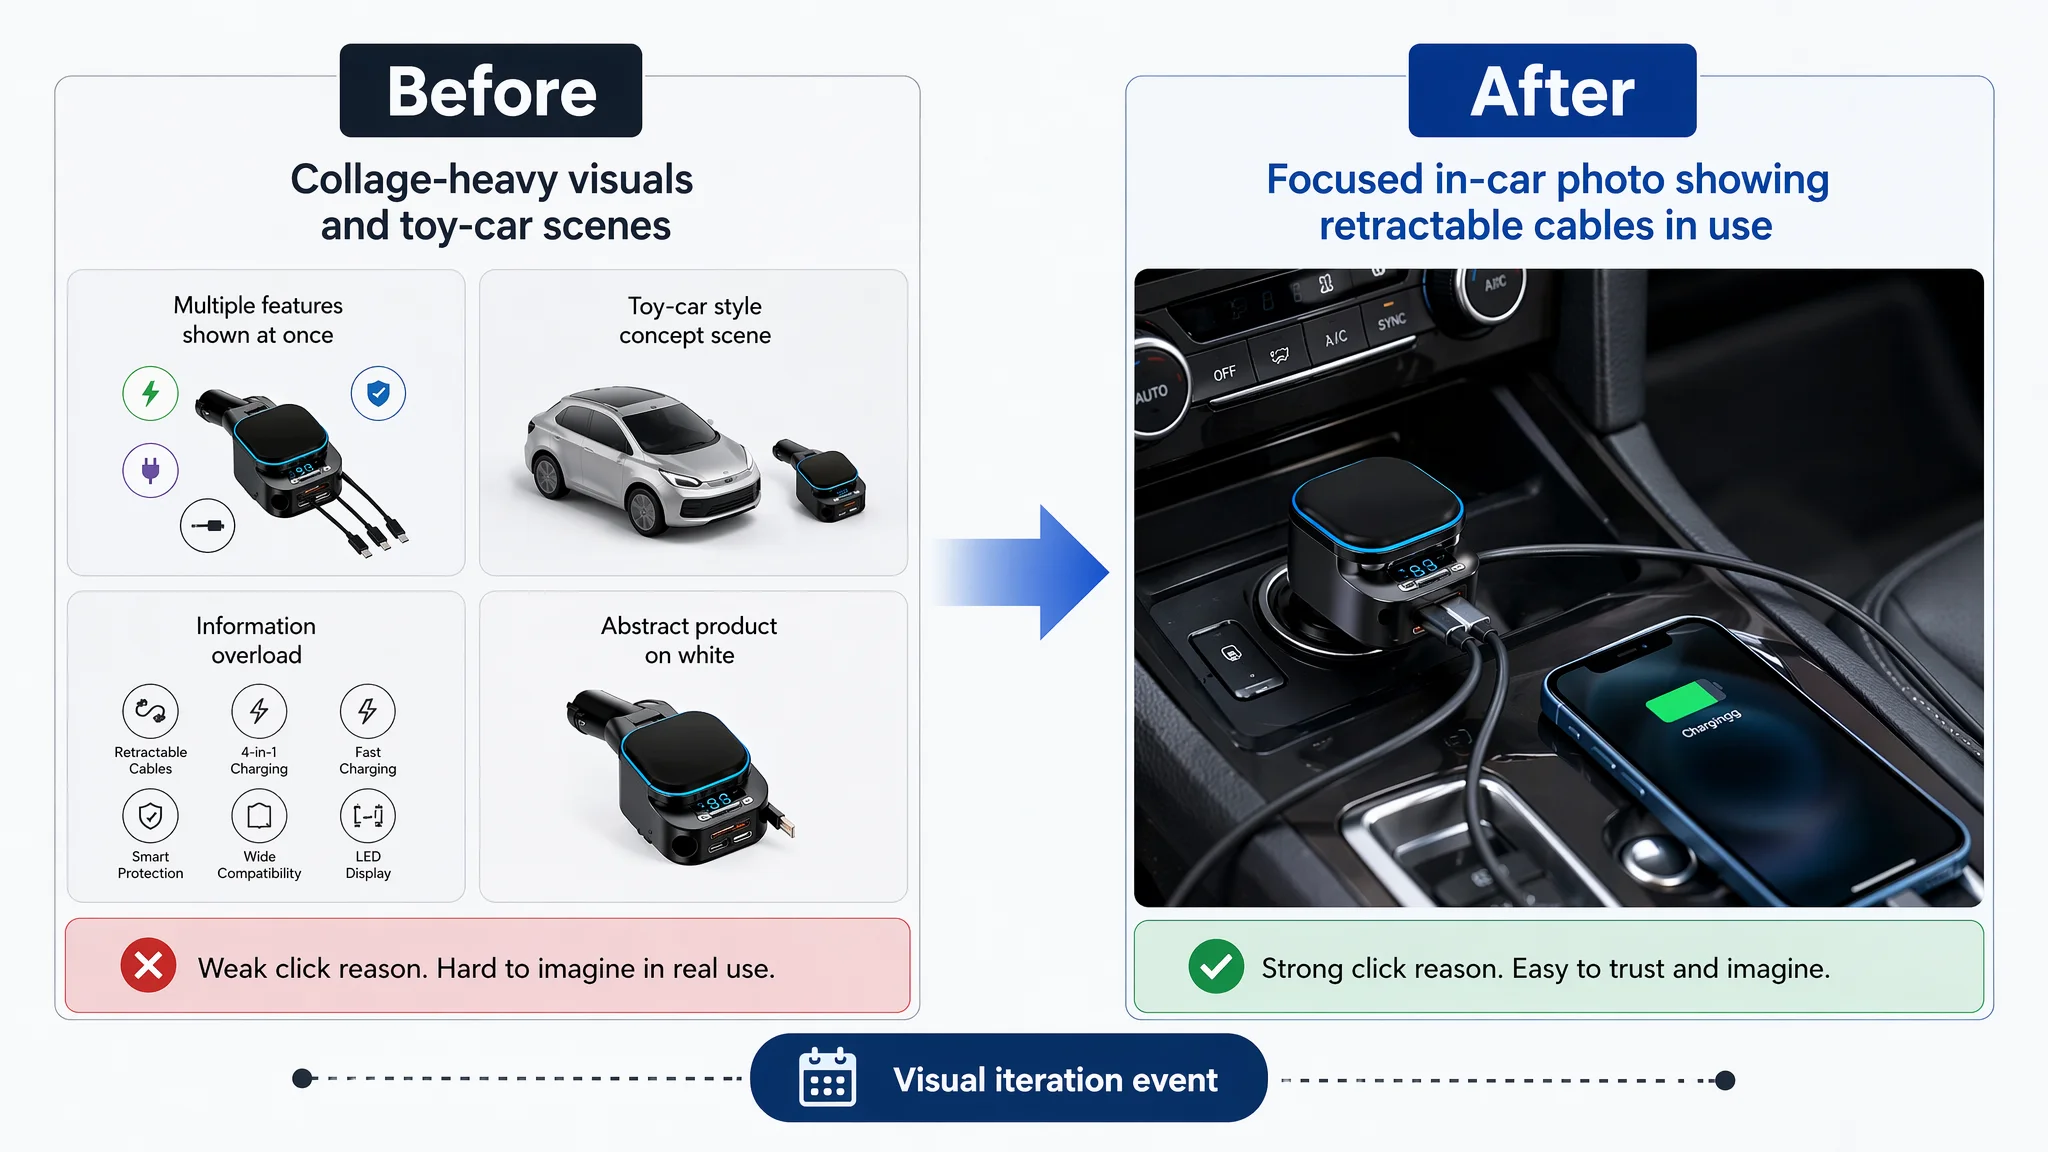
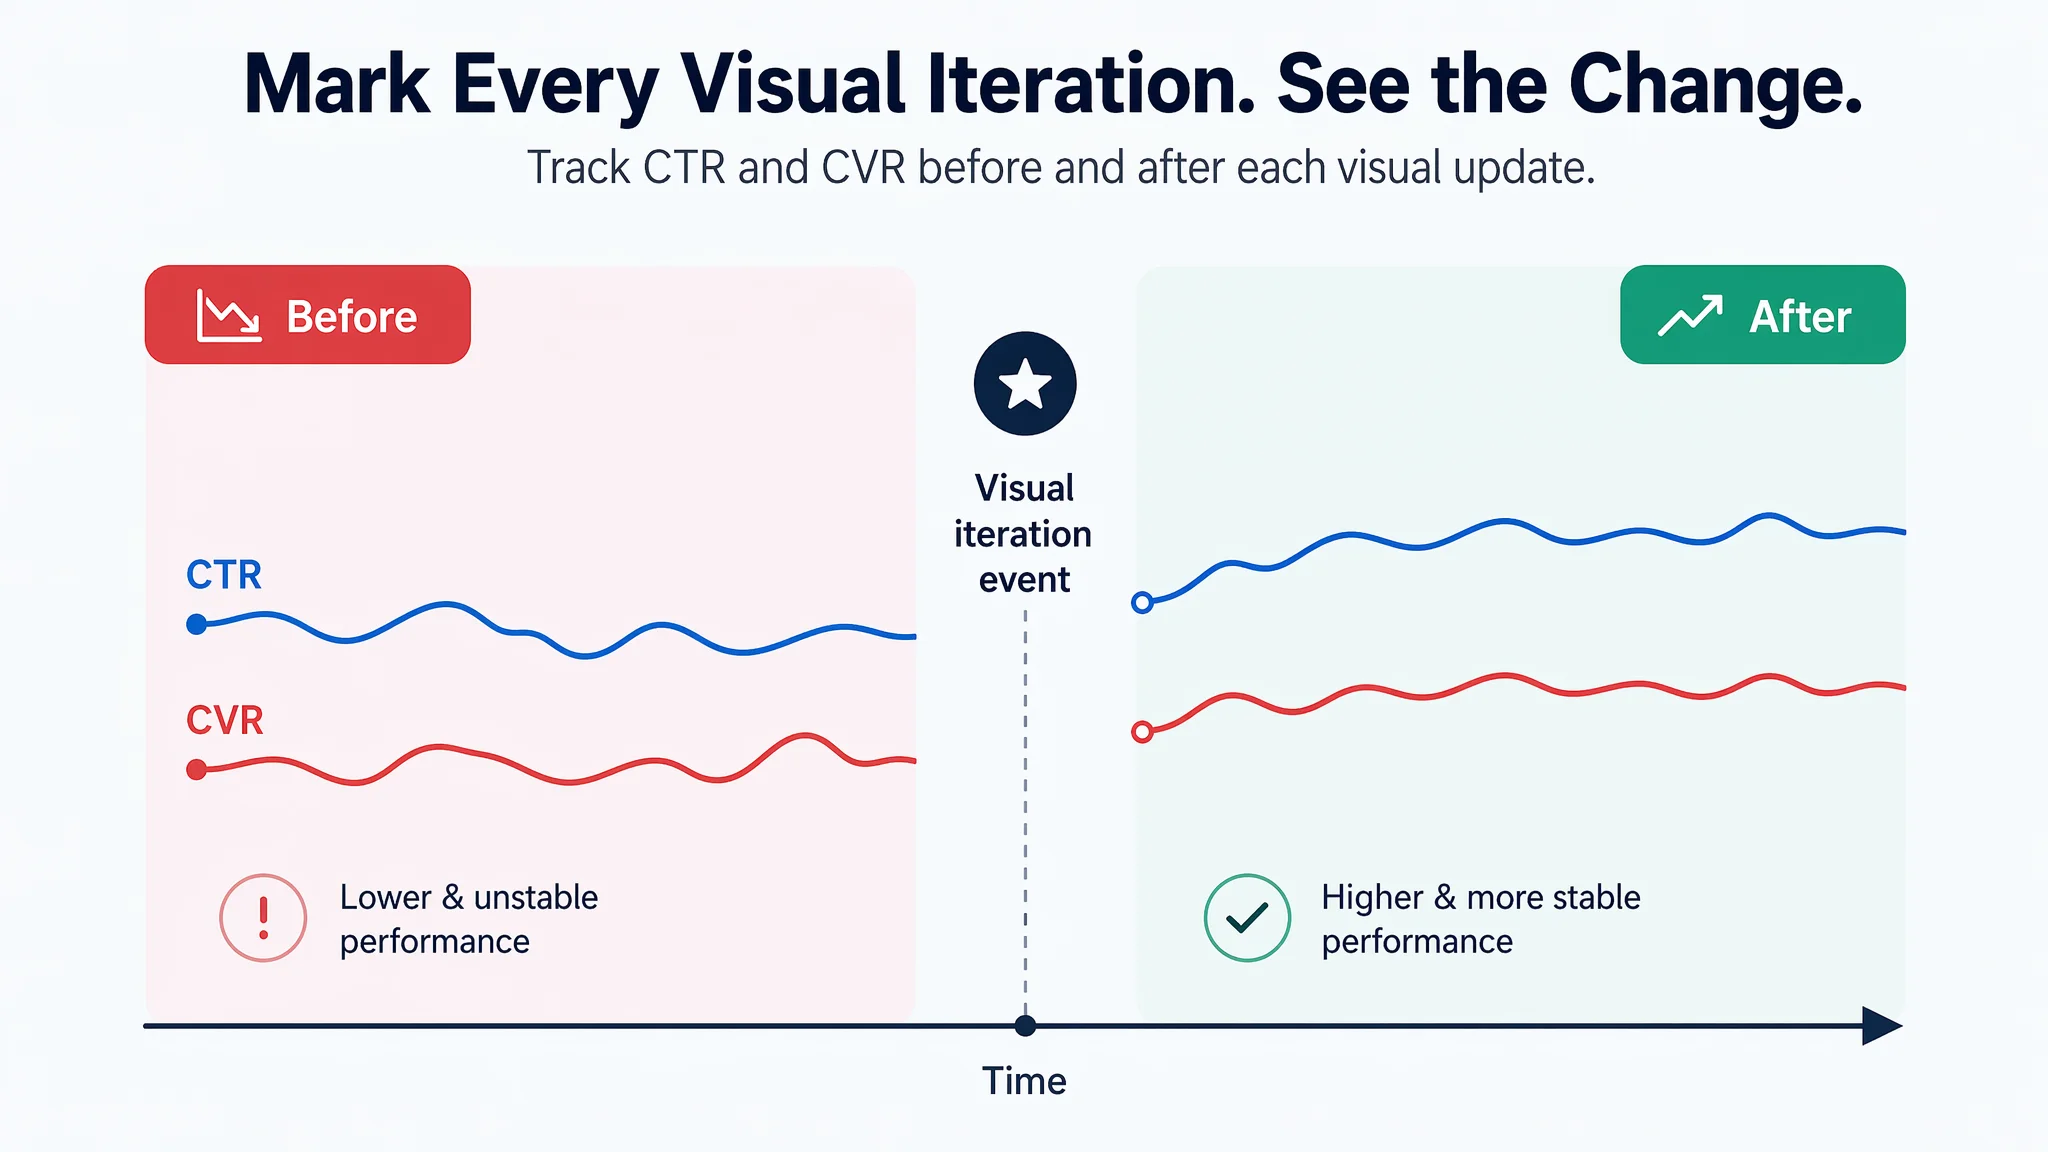
Previously, measuring the impact of visual updates was subjective. DeepBI solves this by automatically marking a "visual iteration event point" in ad reports when a new image is published. This allows you to precisely track how creative changes affect CTR, quantifying their business impact. In the same car charger account, when the seller later replaced collage-heavy visuals and toy-car scenes with focused, in-car photos that showed the retractable cables in use, each change was logged as an iteration event. That made it possible to compare CTR and CVR before and after each visual adjustment, rather than relying on gut feel.
By connecting ad performance directly to creative execution, DeepBI elevates your visual assets from an aesthetic choice to a core commercial engine that drives clicks and conversions. This process generates a clean, validated stream of performance data, including critical metrics like ACOS and TACoS, establishing an authoritative source of truth for strategic visualization in Power BI.
Bridging the Gap: How DeepBI Integrates with Power BI
While DeepBI excels at generating and acting on optimization data, its full analytical power is unlocked when integrated with a robust business intelligence platform like Power BI. The integration moves sellers beyond the limitations of static reports, creating a dynamic environment for strategic analysis. The connection is built on a foundation of structured, machine-readable data that DeepBI produces.
The process hinges on DeepBI's ability to export its findings and performance metrics. The system processes raw Amazon data—including impressions, clicks, conversions, CTR, CVR, and ACOS—and structures it into coherent, exportable formats like JSON files. This data can then be seamlessly ingested into Power BI, providing the raw material for building comprehensive and fully customized dashboards.
In a real-world setting, this connection is often what makes hidden constraints obvious. For the car charger seller, ad reports alone only showed an uncomfortable pattern: clicks were coming in, but orders didn’t follow the way spend suggested they should. Once DeepBI’s listing scores, “visual iteration event points,” and SERP-level diagnostics were exported into Power BI, the team could line up, in one view:
- CTR trends against changes in the main image.
- CVR trends against A+ revisions.
- Title and review score gaps vs. a benchmark competitor.
This made it clear that while their overall score was higher, the competitor’s title and review layer were stronger exactly where the buyer decides. The competitor led with “Retractable Car Charger” and showed the product installed in a real car from the very first image; the seller led with “Bluetooth” and leaned on more conceptual visuals. When those data points were plotted together, the team could see that the issue wasn’t “bad ads” but a misaligned click reason and trust path.
This allows teams to visualize performance trends, correlate advertising spend with sales outcomes, and drill down into specific ASIN-level metrics. A key advantage is the ability to analyze "visual iteration event points"—markers created by DeepBI whenever a listing image is updated. By feeding this data into Power BI, strategists can conduct precise before-and-after analyses, directly measuring how a change to a main image impacted CTR or how an A+ page revision influenced CVR over a specific period. This transforms performance data from a simple scorecard into a powerful tool for continuous improvement.
Advanced Analytics and Visualization with Power BI for Amazon Ads
Integrating DeepBI's granular data stream into Power BI transforms standard ad reporting into a dynamic strategic command center. This connection allows you to move beyond observing what is happening with your campaigns to diagnosing precisely why. By building custom, interactive dashboards, you can visualize the direct relationships between ad performance and specific listing quality attributes.
This advanced analytical capability enables you to build powerful, decision-oriented views that are impossible with default Amazon reports. Key examples include:
- Full-Funnel Diagnostics: Create visualizations that map the customer journey from impression to purchase. You can directly correlate a low Click-Through Rate (CTR) with a poor main image diagnostic score from DeepBI, instantly flagging a weak visual hook. Likewise, a low Conversion Rate (CVR) can be visually linked to low scores for A+ Content or review reputation, pinpointing exactly where traffic fails to convert.
On the Bluetooth car charger listing, this kind of view turned a vague complaint (“ads are expensive”) into a specific diagnosis: SERP-level relevance and on-page trust were underperforming. DeepBI’s scoring showed the seller ahead in internal detail (bullets, A+), but Power BI charts revealed that CTR lagged when the title emphasized “Bluetooth adapter” rather than “retractable car charger,” and that the first image, which lacked an in-car scene, correlated with weaker click behavior compared with the competitor. At the same time, CVR charts highlighted that a visible 1-star review about core functionality hurt trust more than the competitor’s more minor complaints—explaining why many of the paid clicks failed to turn into orders.
- Before-and-After Impact Analysis: When a listing image is updated, DeepBI logs a "visual iteration event." In Power BI, you can plot CTR, CVR, and ACoS trends before and after this event marker, providing clear, quantifiable evidence of an optimization's impact over a 7- or 14-day period.
In the same car electronics account, after the seller replaced collage-style product images and toy-car props with single-focus, realistic in-console scenes and hands-free calling shots, DeepBI tagged each change. Power BI dashboards then overlaid CTR and CVR curves across those event points. Instead of debating whether the new visuals “felt better,” the team could see how each iteration affected behavior, which specific image sets supported stronger clicks, and whether improved SERP performance actually translated into better conversion further down the funnel.
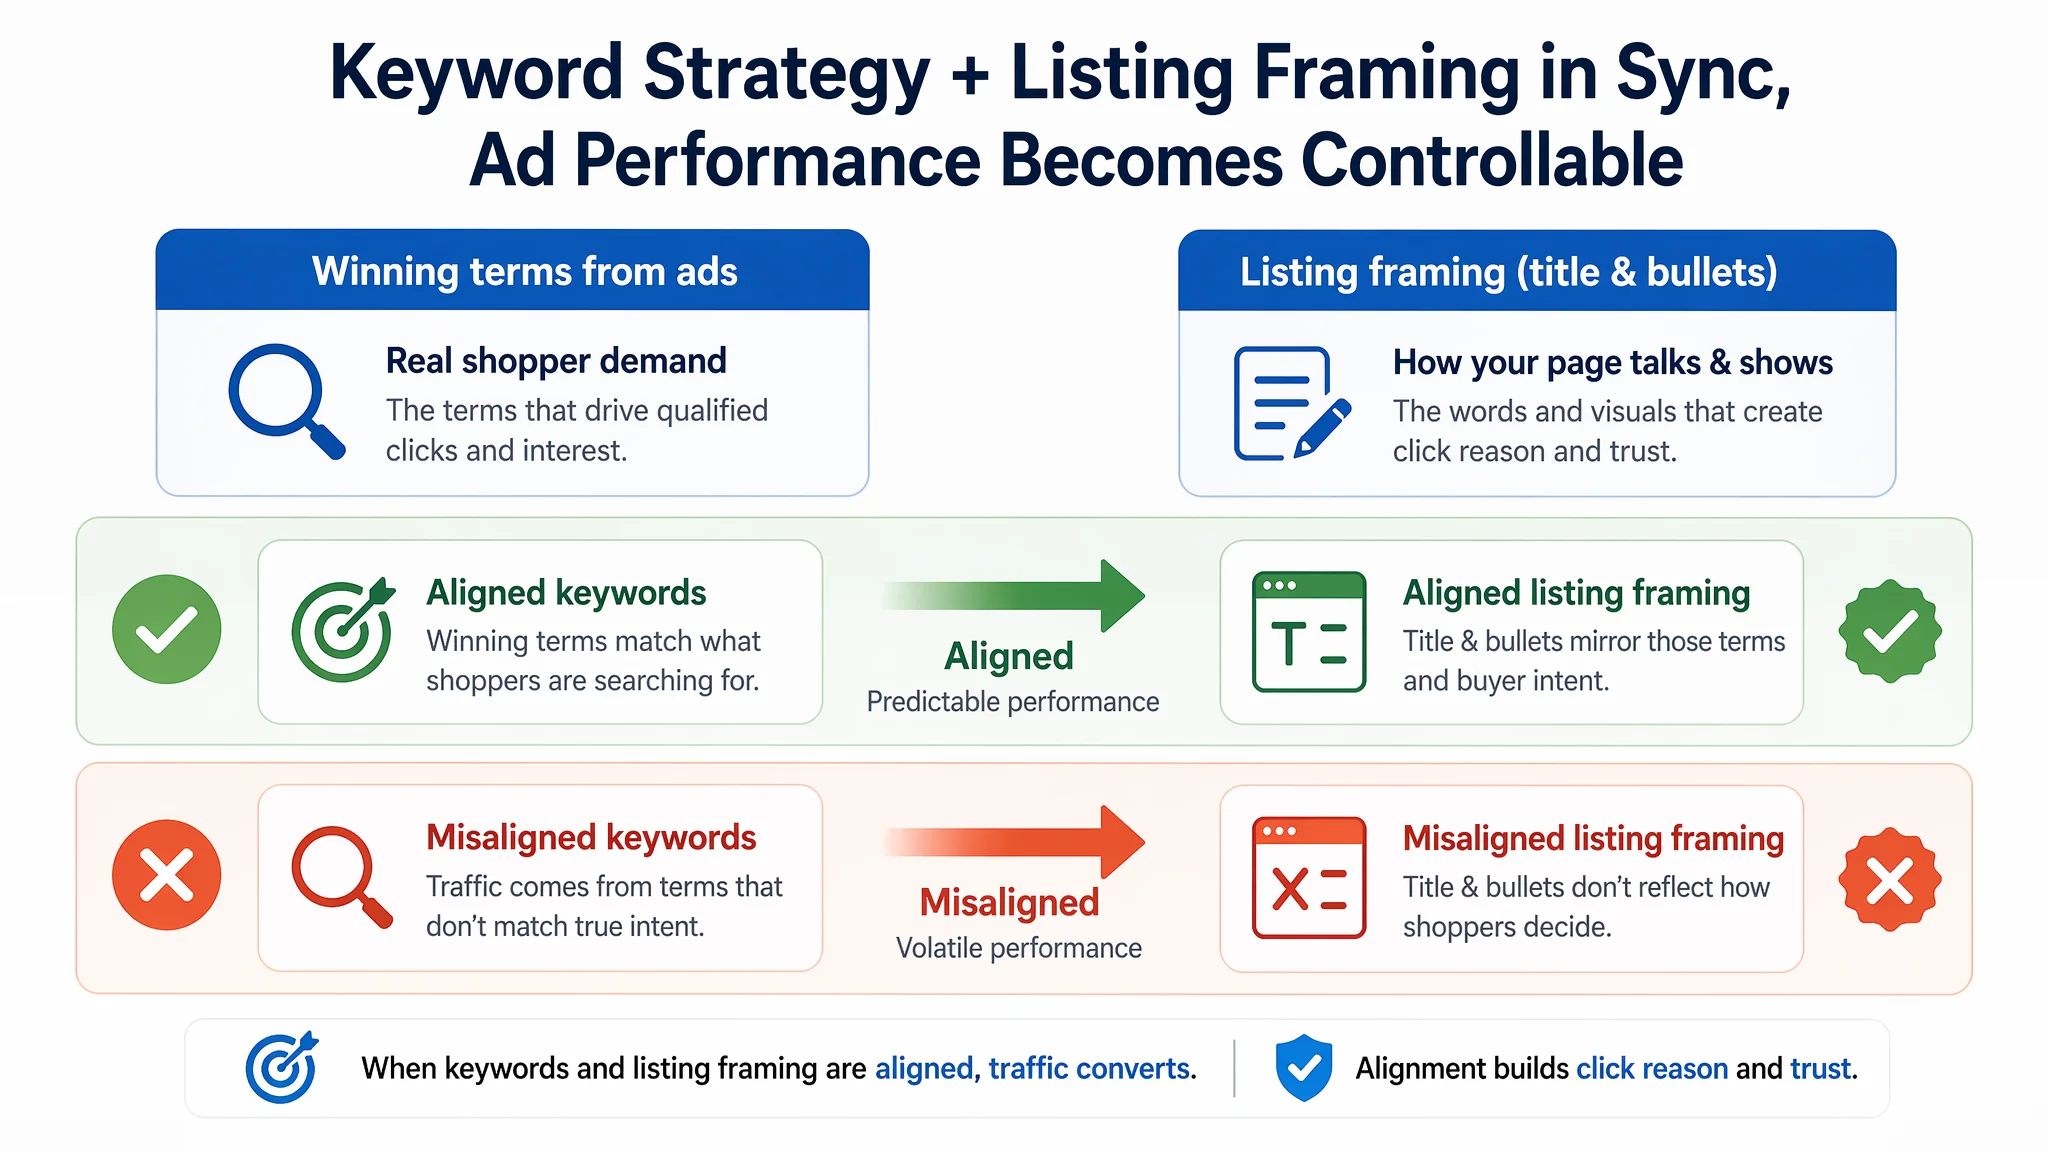
- Targeted Budget and Keyword Optimization: Design dashboards that break down ACoS by campaign, ad group, and even by high-converting "Winning terms." This allows for interactive exploration of budget allocation efficiency, helping you shift spend toward the most profitable and impactful combinations of keywords and creative assets.
Crucially, this keyword work becomes more precise when tied back to listing diagnostics. In the charger example, once the title and bullets were realigned around “retractable multi-port fast charging” and Bluetooth 5.3 as a secondary benefit, the “winning terms” identified in DeepBI could be mirrored directly in the content. Power BI then showed that campaigns leaning on those aligned phrases behaved more predictably than those driving traffic on loosely related Bluetooth-only terms that the page no longer led with. The lesson wasn’t just which words to bid on, but how listing framing and keyword strategy reinforced or undermined each other.
Strategic Advantages: Driving Growth Through Integrated Insights
The integration of DeepBI's automated optimization with Power BI's analytical depth creates a powerful business feedback loop, transforming ad data into a strategic asset. This synergy enables a direct, actionable link between advertising performance and listing quality, fostering healthier long-term growth. By analyzing comprehensive ad reports in Power BI, strategists can move beyond surface-level metrics to diagnose specific performance issues. For example, a low Click-Through Rate (CTR) can be definitively linked to a weak main image, while a poor Conversion Rate (CVR) may point to deficiencies in A+ content.
In real accounts, this distinction between “ad problem” and “page problem” is often blurred. The Bluetooth car charger seller spent a significant amount of time restructuring campaigns because ACOS felt too high. But once DeepBI’s diagnostics were pulled into Power BI and compared against a benchmark competitor, it became clear that:
- The competitor was weaker overall in internal content, but stronger in the exact layers where buyers decide (title, first image, review depth).
- The seller’s listing lacked an immediate click reason aligned with category search intent (messy cables and multi-device fast charging first; Bluetooth as a bonus).
- Visuals were technically polished but not grounded in realistic driving scenarios, which dulled emotional relevance.
Once these insights were visible, strategy shifted: instead of continuing to push more traffic into a misframed page, the team prioritized rebuilding the listing’s decision logic—rewriting the title to lead with “retractable car charger,” simplifying key images into clear, in-car scenes, and tightening bullets and A+ into a “pain → solution → proof → safety” sequence. Only after those changes were implemented did further ad optimization begin to translate into more stable returns.
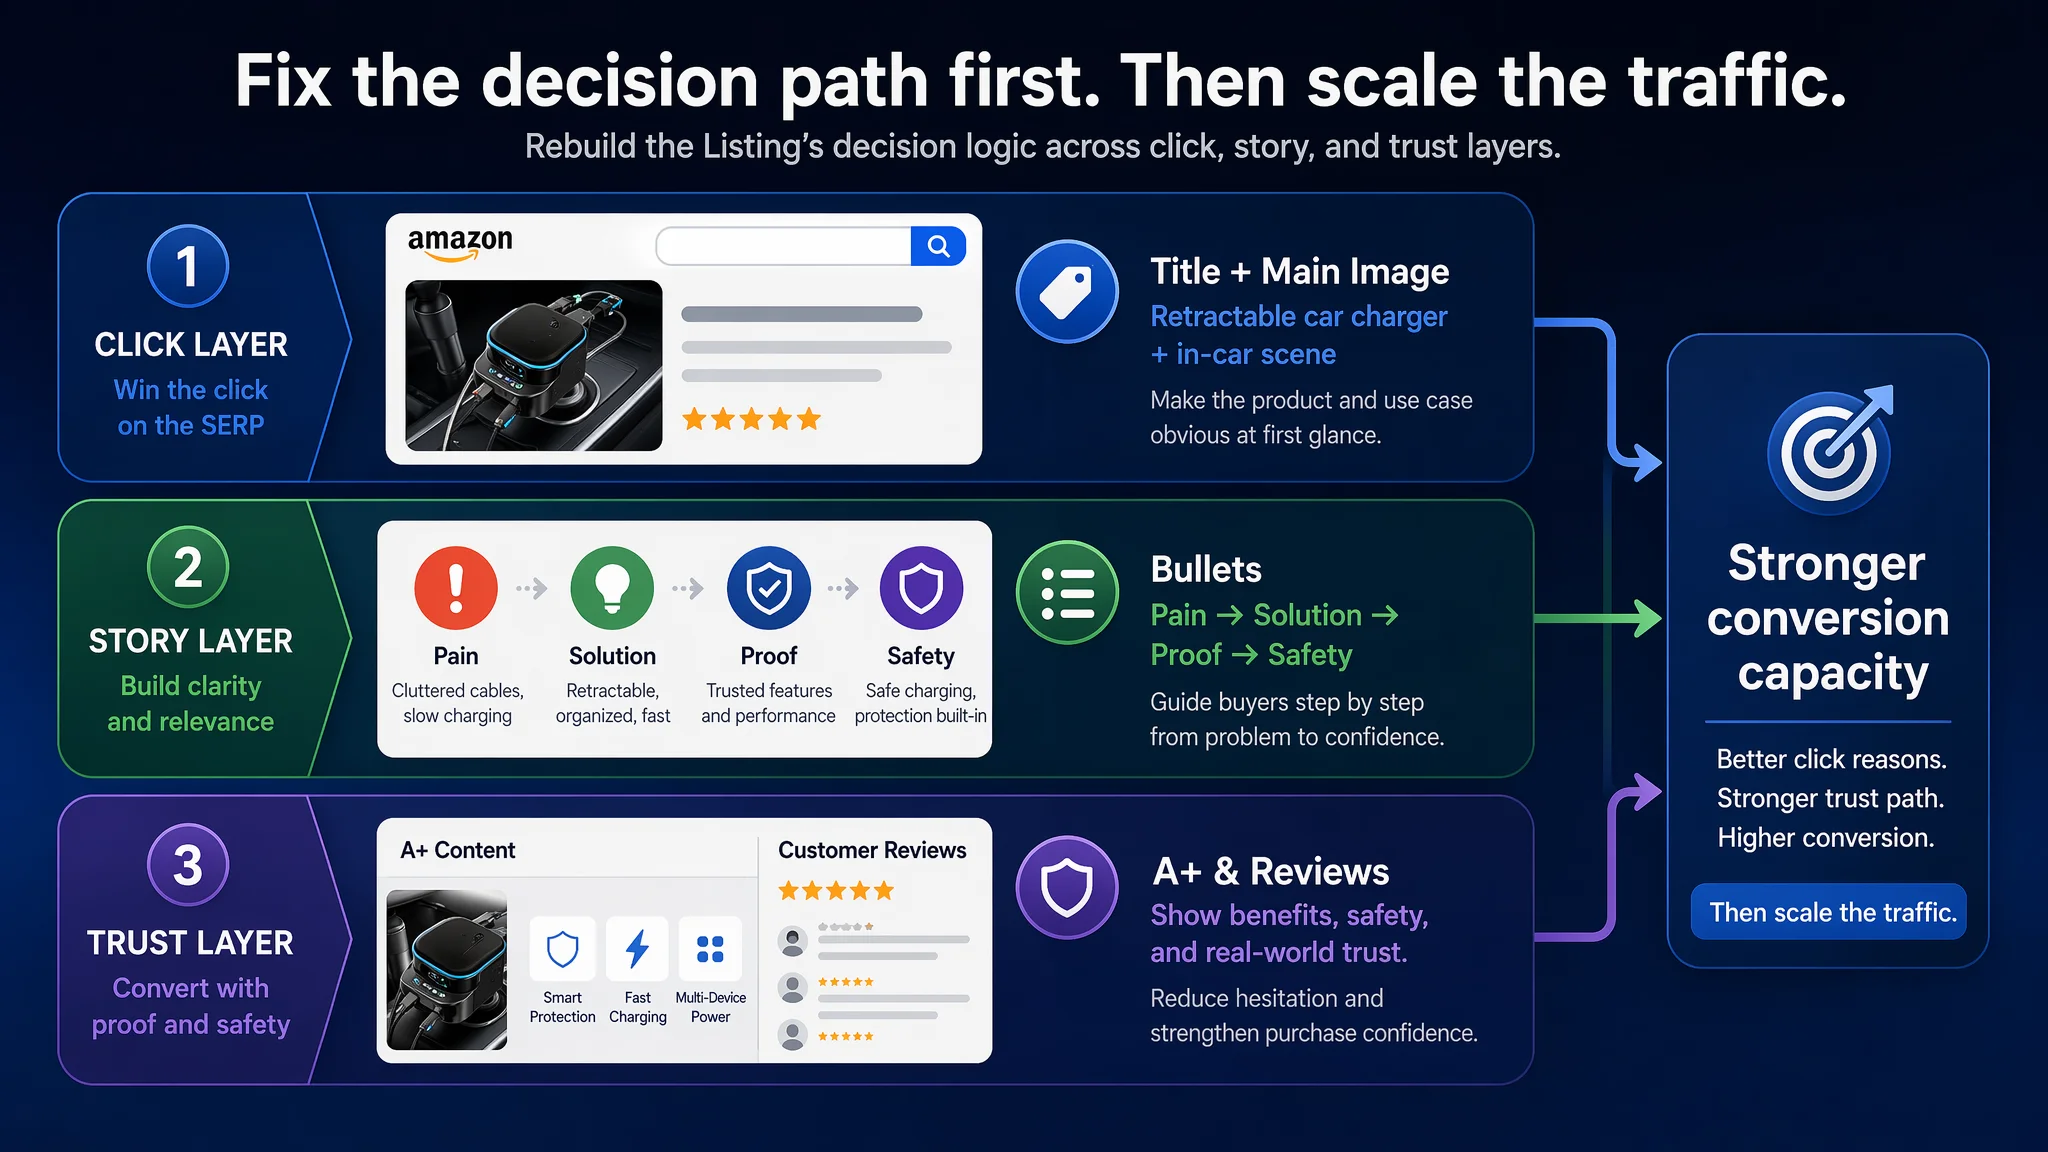
DeepBI uses these precise, data-backed diagnoses to drive automated action. High-converting keywords and visual attributes identified from ad data become direct inputs for optimizing listing titles and images. This ensures that advertising budgets are allocated to strategies with proven conversion potential, leading to more effective campaigns and a lower Total Advertising Cost of Sales (TACoS). The strategic value extends beyond paid media; high-performing keywords validated through advertising become prime targets for organic ranking efforts. This closed-loop system turns ad spend into a direct investment in improving both paid and organic sales velocity, creating a sustainable competitive advantage.
The charger listing case illustrates this closed loop in a concrete way: as the title and A+ began to mirror the language and decision logic of the best-converting pages in its niche, keyword performance data in Power BI stopped being random and started reinforcing listing optimization. Ads no longer had to “fight” against an unfocused page; they amplified a message that buyers already responded to, improving both paid and organic traction.
Implementing Your DeepBI and Power BI Integration Strategy
Successfully integrating DeepBI with Power BI is not just a technical setup but the foundation of a continuous optimization cycle. A strategic implementation roadmap ensures your data remains accurate, secure, and actionable for driving sustained growth.
Begin by establishing a secure connection through Amazon's official Selling Partner API (SP-API). This integration adheres to the "principle of least privilege," ensuring access is strictly limited to image asset management and never touches sensitive business data like pricing or inventory. To maintain data integrity and maximize impact, implement strong governance from the start:
- Define "Product DNA": Lock in core, unchangeable product attributes such as material, structure, and logos. This prevents AI-generated visuals from creating "not as described" issues and protects brand consistency. In the Bluetooth car charger project, for example, the underlying hardware—96W power, retractable cable mechanism, Bluetooth 5.3 capability—never changed. All optimization stayed within this “DNA,” focusing on how these facts were framed and visualized, not inventing new promises.
- Establish a Tracking Protocol: When new images are published via DeepBI, the system automatically tags a "visual iteration event point" in your advertising data. This is a critical best practice for report maintenance and accurate performance analysis. For the car charger, each replacement of collage-heavy images with single-focus, in-car shots was logged as a separate event. When the team later reviewed Power BI dashboards, they could isolate the performance impact of each specific creative decision, avoiding the common trap of bundling multiple changes together and guessing which one mattered.
- Create a Closed Feedback Loop: Use your Power BI dashboards to monitor the impact of visual updates on key metrics like Click-Through Rate (CTR). Analyze the before-and-after data surrounding each event point to validate your optimization strategy and inform the next iteration, transforming insights into a competitive advantage. In practice, this meant that when the charger seller re-anchored Bullet #1 around clutter-free retractable design and Bullet #2 around 96W multi-device fast charging, they could see whether these content shifts, combined with new imagery, improved how traffic behaved—rather than assuming more descriptive bullets were automatically “better.”
This structured approach turns your integration into a powerful engine for data-driven decision-making, ensuring every visual enhancement is measured and refined. It also helps teams avoid a common misstep revealed by the charger case: repeatedly tuning campaigns while leaving the listing’s decision path untouched. With DeepBI and Power BI working together, the first question becomes “Where in the funnel is behavior breaking?” not “Which bid should we tweak next?”
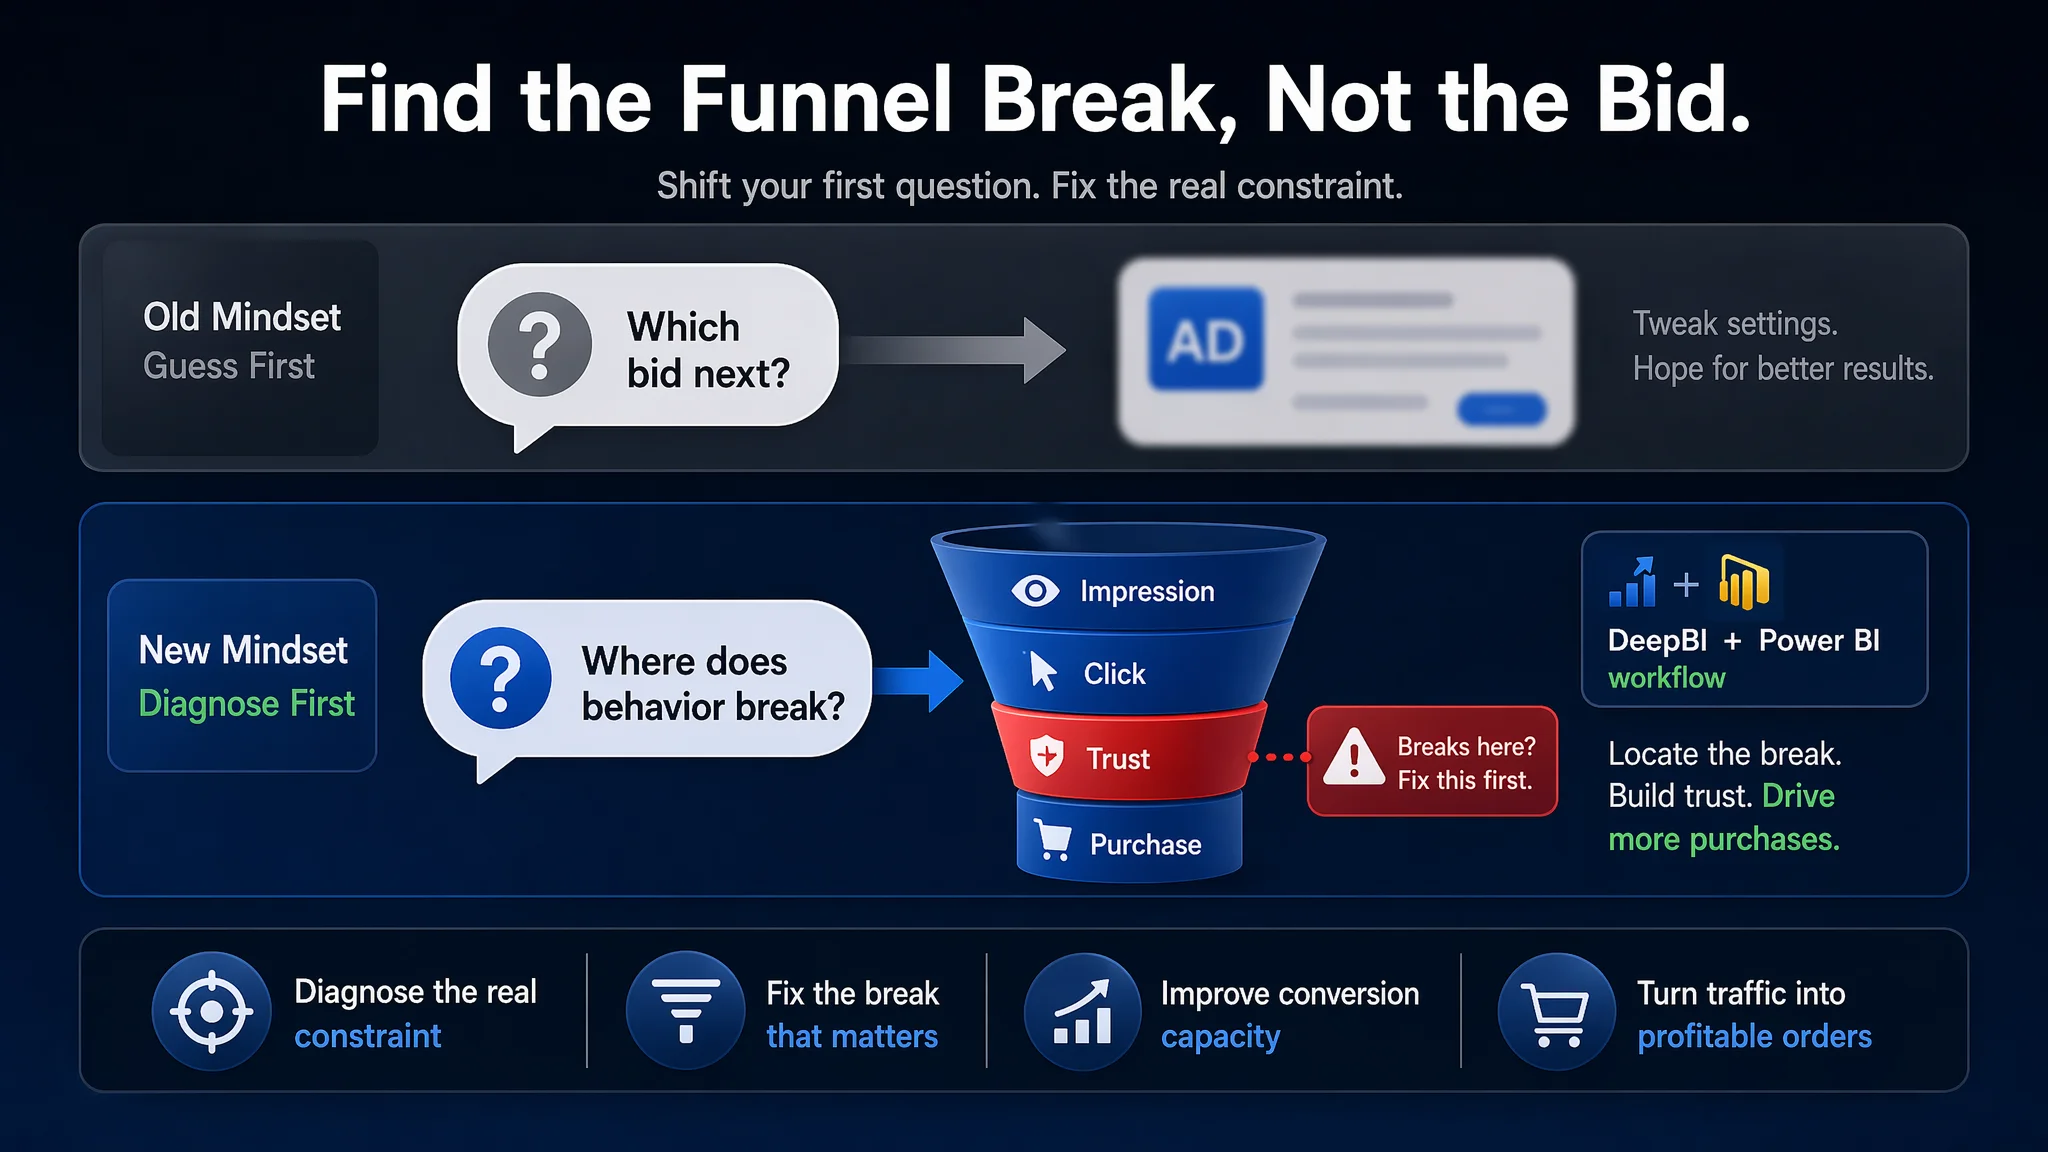
Conclusion: The Future of Amazon Ads Optimization
The era of managing Amazon advertising with disconnected spreadsheets and intuition-based decisions is rapidly closing. Integrating a diagnostic engine like DeepBI with a visualization platform like Power BI represents a fundamental shift, creating a unified command center for strategic growth. This combination transforms the optimization process from reactive, 'blind trial and error' into a proactive strategy built on a clear 'data evidence chain,' effectively breaking the costly separation between analysis and execution.
The Bluetooth car charger listing underscores why this evolution matters. On a superficial level, it looked like a classic “ads are not working” problem. Only after DeepBI’s listing diagnostics, competitor comparisons, and visual event tracking were surfaced in Power BI did it become obvious that the true constraint was conversion capacity—how the page talked, showed, and reassured at each step of the buyer’s journey. Once the page was reframed around real category decision logic, the same ad system began to make economic sense.
This evolution turns ad optimization from an occasional, high-effort project into a dynamic, iterative logic that adapts to market feedback. In the hyper-competitive Amazon landscape, such agility is no longer a luxury but a core requirement for survival and success. By translating complex performance data into actionable, machine-readable instructions, this integrated approach serves as an intelligent decision-making brain for sellers.
Ultimately, this synergy is a powerful technological lever that drives every advertising decision back to its commercial essence. It ensures that creative and strategic choices are engineered to be more profitable, not just aesthetically pleasing. The result is a clear, data-driven path toward definite conversion rate improvements, sustained Best Seller Rank (BSR) growth, and the long-term brand profitability essential for winning on Amazon—especially in those all-too-common situations where, like the car charger seller, your ads are doing their job, but your listing still needs to catch up with how your category really buys.