

The Real Meaning of ACoS - More Than a Percentage
Advertising Cost of Sales (ACoS) is calculated as follows:
ACoS = Advertising Spend ÷ Attributed Sales × 100
If a campaign spends $200 and generates $1,000 in attributed sales, its ACoS is 20%. This metric shows how much advertising cost was required to generate each dollar of sales attributed to the ads. By itself, however, it does not show whether those sales were profitable.
That distinction is essential because ACoS must be interpreted against the product’s contribution margin. A product with a 40% margin may be able to sustain a 25% ACoS while retaining room for profit. A product with a 15% margin may lose money at the same ACoS, even if the campaign appears efficient by category standards. Break-even ACoS therefore depends on the margin remaining after product and selling costs, not on a universal Amazon benchmark.
Conversion rate adds another layer of analysis. A high ACoS may result from high traffic costs, weak listing conversion, or both. If impressions and clicks are healthy but CVR is low, the issue may lie in the listing’s images, A+ content, offer, or message clarity rather than in the bid alone. Cutting spend can lower ACoS while also reducing sales volume and slowing BSR momentum. A sound diagnosis connects CTR, CVR, ACoS, and margin before campaign settings are changed.
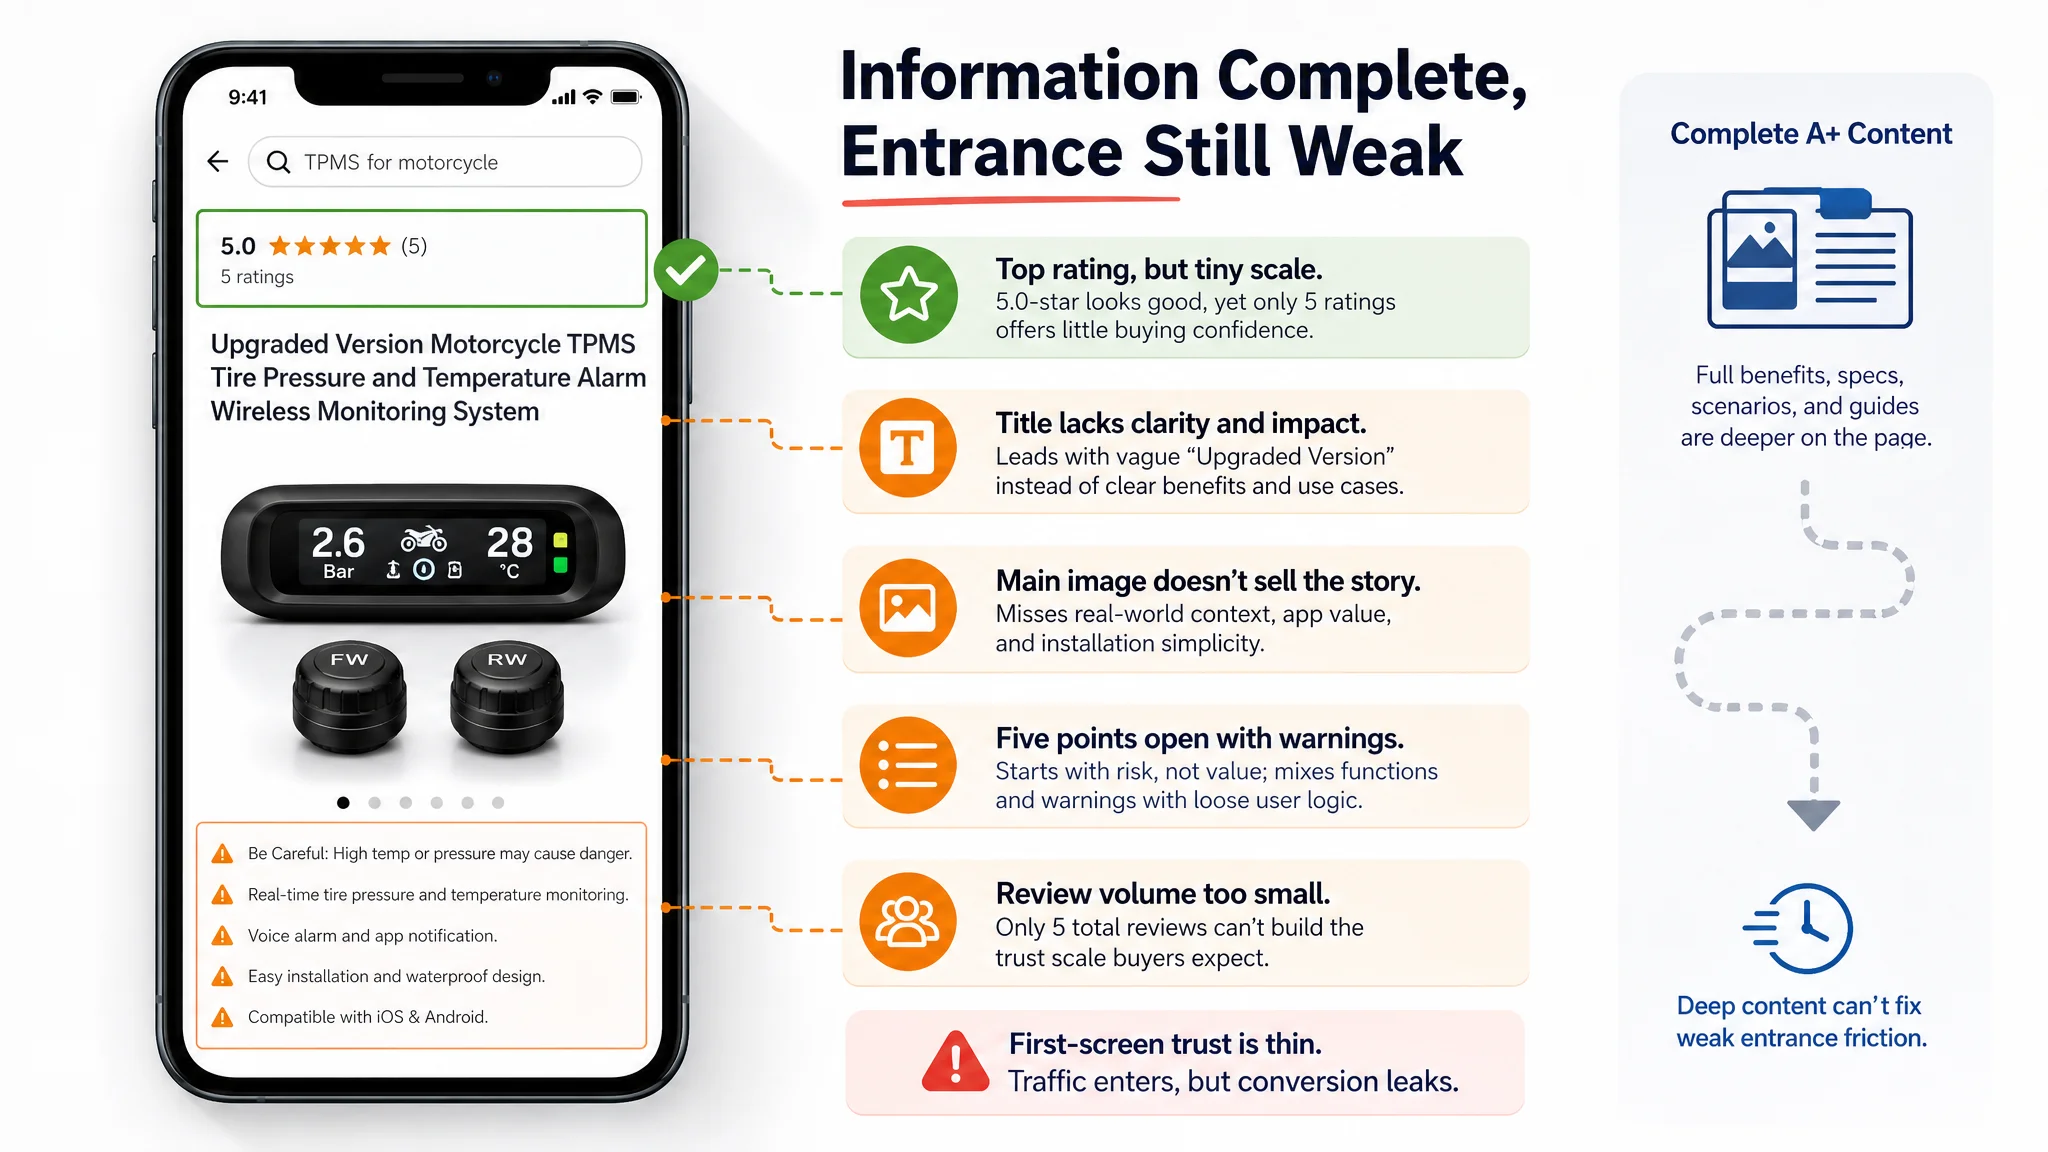
A motorcycle tire-pressure-monitoring seller provides a useful example. The team saw expensive clicks, unstable conversion, and an ACoS that was increasingly difficult to control. The initial assumption was that the campaigns needed better bids, keywords, structures, and budgets. However, a Listing comparison showed that the product page scored 68/100 against 82/100 for a category benchmark. The gap was concentrated in the title, main images, bullet points, and review volume, while the A+ content was actually stronger than the benchmark. The problem was not simply that traffic was expensive; the page was not converting enough of the traffic it received.
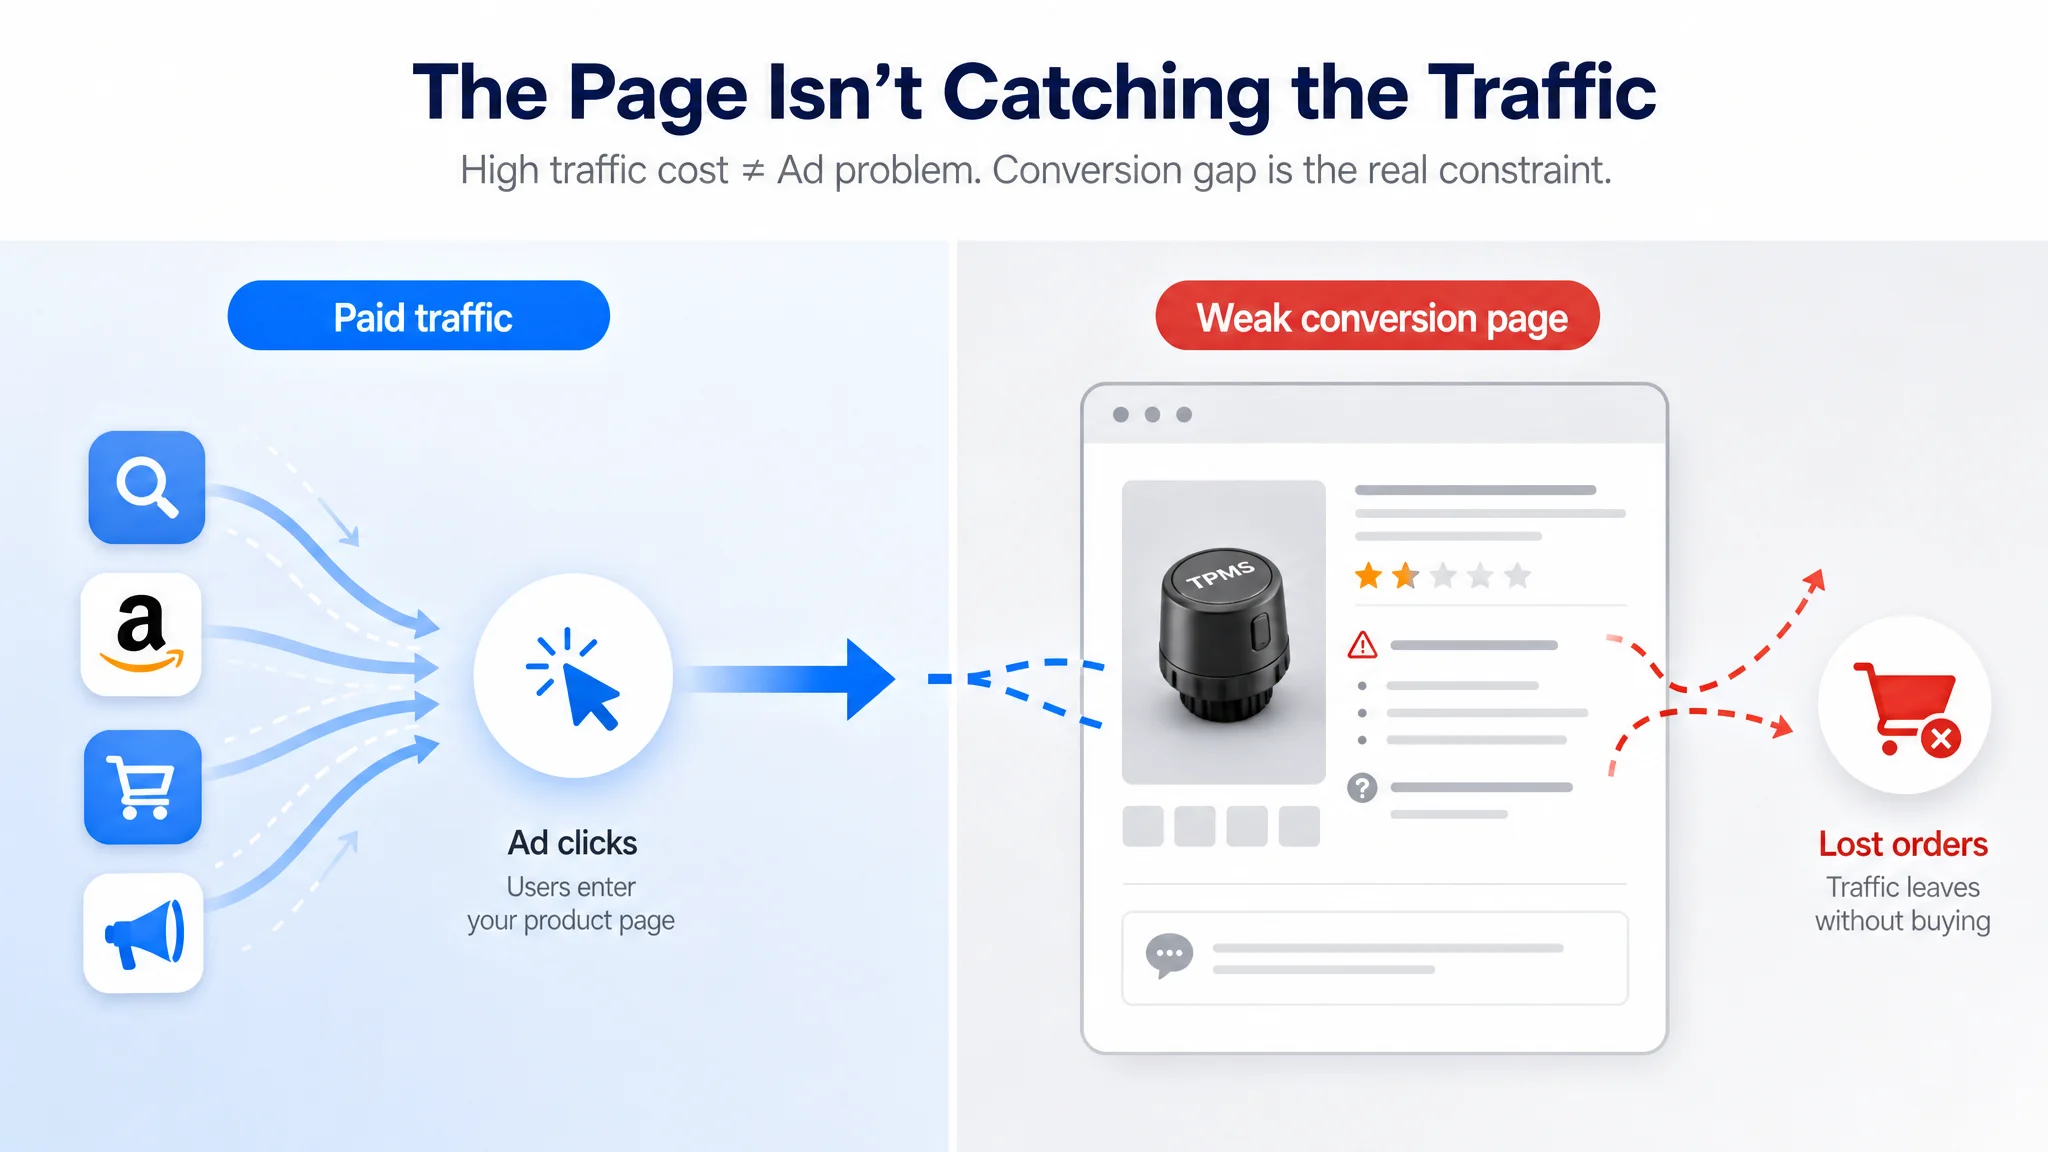
This distinction matters for profitability analysis. If paid traffic enters a page with weak first-screen trust, unclear positioning, and limited buying logic, reducing bids may lower ACoS without solving the underlying conversion constraint. The seller may spend less per day while also losing the opportunity to turn qualified clicks into profitable orders. ACoS becomes more useful when it is interpreted as the result of the entire advertising-to-conversion system.
Placement economics also require careful interpretation. Top-of-search traffic often costs more, but the premium may be rational when that placement converts substantially better. As a working principle, top placement may convert 30% to 50% better than lower positions. A higher CPC can be profitable when the additional conversion rate generates enough incremental contribution margin to offset the added advertising cost. Sellers should compare placement-level spend, CTR, CVR, attributed sales, and profit contribution rather than automatically treating the cheapest click as the best one.
A 15% to 30% ACoS is common across many categories, but the range varies substantially and should never be treated as a universal target. Launch-stage campaigns, defensive branded campaigns, aggressive ranking efforts, and mature profit campaigns may each require different thresholds.
The practical question is not, “Is my ACoS low enough?” It is, “Does this advertising spend create profitable growth at an acceptable CVR and margin?” Advertising reports that include impressions, clicks, conversions, TACoS, and ACoS support that broader assessment. When listing assets change, evaluate the resulting CTR and CVR response, then apply those findings to the next optimization decision. This feedback loop turns ACoS from a scorecard into a profitability diagnostic.
Profit-First Advertising: Why Low ACoS Isn't Always the Goal
A low ACoS can appear efficient while quietly restricting growth. If bids are reduced until only the cheapest, highest-intent clicks remain, impressions and sales volume may decline. That can limit keyword discovery, weaken the flow of conversion data, and reduce opportunities to improve CTR, CVR, BSR, and organic ranking. The more useful question is not “How low can ACoS go?” but “How much profit does each advertising dollar generate, and how much growth can the business support?”
The motorcycle TPMS example shows why this question must include listing quality. The seller’s advertising activity was producing traffic, but the page’s entry layer was weaker than the benchmark. The title relied heavily on vague “Upgraded Version” wording, the bullets opened with warnings and technical information, and the main images did not clearly communicate motorcycle use, app functionality, or installation simplicity. The team was trying to reduce the cost of traffic before determining whether the page gave that traffic a persuasive reason to buy.
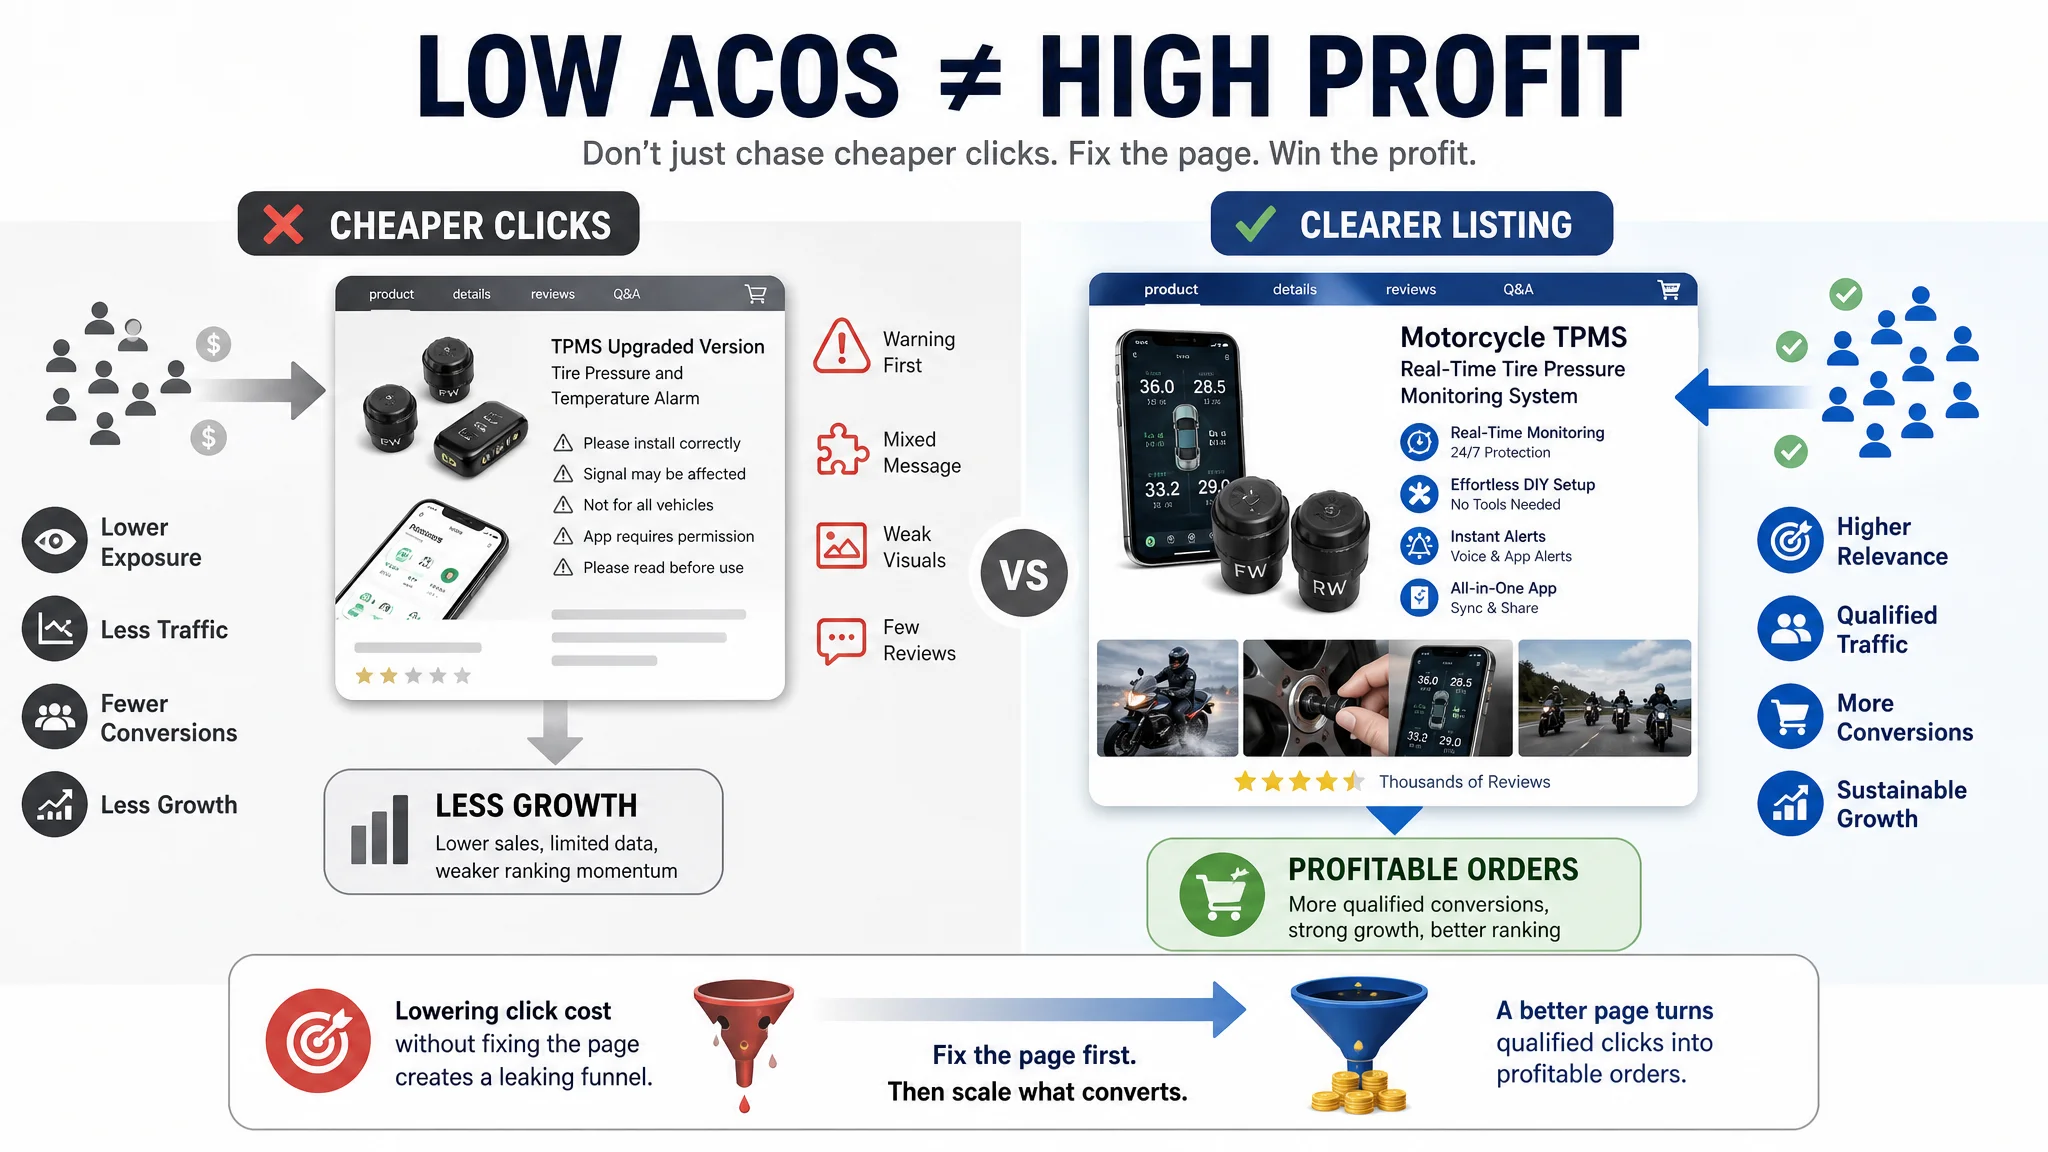
In this situation, a lower ACoS would not necessarily mean healthier advertising. It could simply reflect reduced exposure to a page that had not yet repaired its conversion logic. Profit-first advertising therefore requires sellers to distinguish between the cost of obtaining a click and the economic value created after that click reaches the Listing.
Break-Even ACoS vs. Target ACoS
Break-even ACoS is the maximum advertising cost percentage a product can absorb before its contribution profit reaches zero. If a product sells for $40 and produces $20 in profit before advertising after product, fulfillment, and other operating costs, its break-even ACoS is 50%. Any advertising spend below that level remains profitable on a unit basis.
Target ACoS is a management decision. It should normally be lower than break-even ACoS, but it does not need to be the lowest possible figure. A launch may accept a higher target to build demand and collect conversion data, while a mature product may prioritize contribution profit and a lower TACoS. The appropriate target depends on the product lifecycle, competition, inventory capacity, and growth goals.
Consider a product priced at $40 with $20 in pre-ad profit. Assume CPC is $2.80 and the conversion rate is 20%. Five clicks are required for one order, so the advertising cost per order is:
- $2.80 CPC ÷ 20% CVR = $14 ad cost per order
- $14 ÷ $40 selling price = 35% ACoS
- $20 pre-ad profit − $14 advertising cost = $6 profit after advertising
- $6 ÷ $40 = 15% net contribution margin
A 35% ACoS is therefore not automatically unhealthy. It is profitable in this example, even though it would fail a seller focused solely on minimizing the percentage.
Profit per click provides a more useful decision signal than CPC alone. The $2.80 click costs more than a cheaper click, but the expected pre-ad profit per click is $20 × 20% = $4. After CPC, expected profit is $1.20 per click. A lower CPC paired with poor CVR could generate less profit per click and less total profit.
For CPC budgeting, sellers can choose to invest roughly 15% to 30% of per-unit profit in advertising, adjusting that share for lifecycle, competition, and growth objectives. With $20 in profit and a 20% CVR, this approach implies a CPC range of about $0.60 to $1.20 for a conservative target. The 0.25 multiplier found in some cost guides is arbitrary; a defensible CPC budget must reflect the product’s economics and strategic priorities rather than a universal formula.
The same logic applies when a Listing has a conversion bottleneck. A seller may calculate an acceptable CPC accurately but still receive weak economic results if the page converts poorly. In the TPMS example, the A+ content could explain the product once shoppers reached it, but the title, images, bullets, and review scale were not strong enough to move enough visitors into deeper consideration. The correct response was not to declare every click too expensive. It was to improve the page’s ability to convert valuable clicks before expanding spend.
Calculating Your True Profit: Beyond ACoS to Contribution Margin
ACoS is useful for measuring advertising efficiency, but it does not show whether a product is actually profitable. ACoS is calculated as ad spend divided by advertising sales. It answers one question: how much of the attributed revenue was consumed by ads? It does not show whether enough money remains after product costs and fixed operating expenses.
A more practical starting point is contribution margin after advertising:
Contribution margin after advertising = Selling price − COGS − Ad spend
This figure shows how much each sale contributes toward fixed costs and eventual profit after advertising cost is included. Fixed costs such as salaries, software, storage commitments, and other overhead are not removed from the formula. They must be covered by the contribution generated across all units sold.
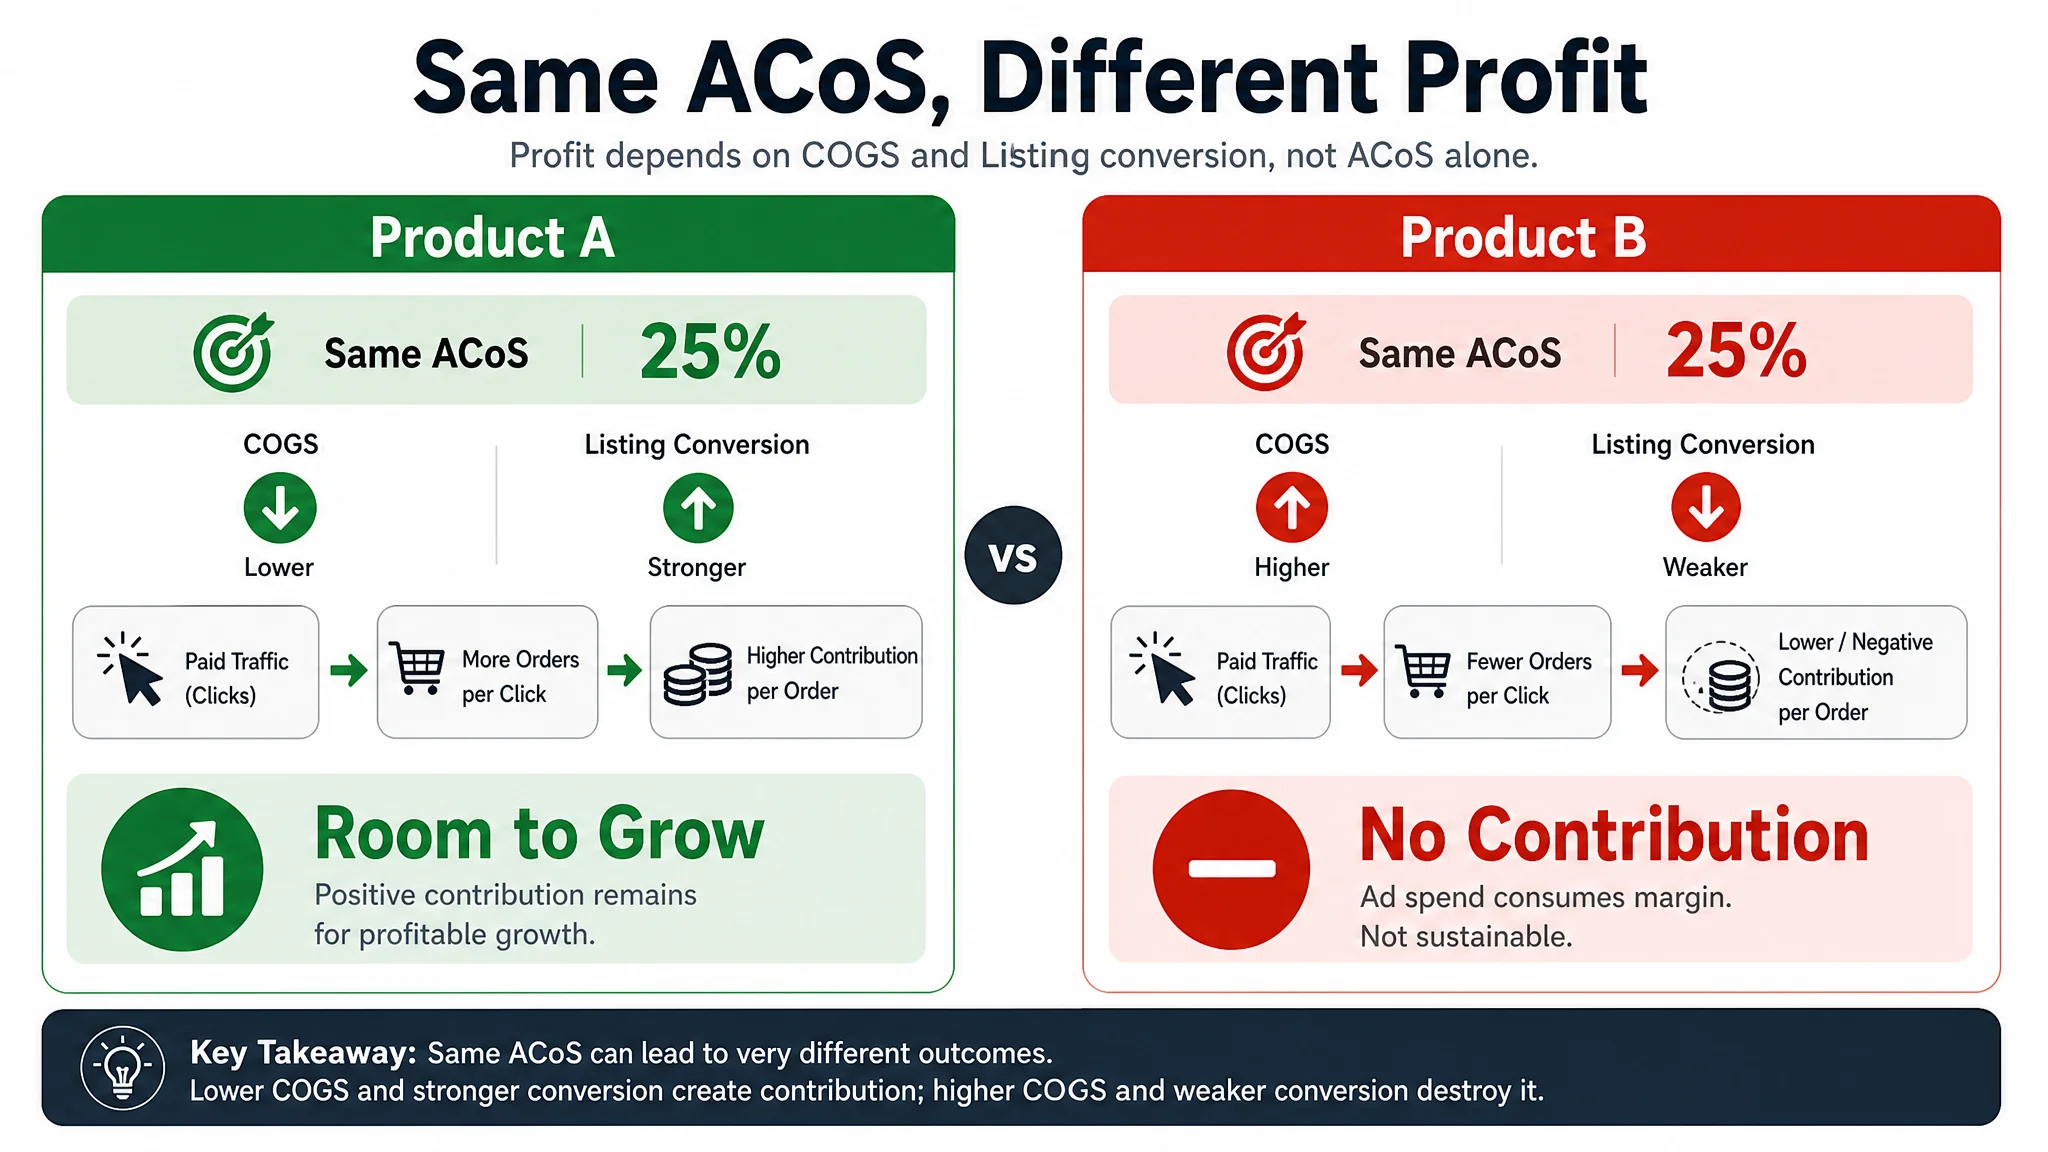
Consider two products with the same selling price and the same ACoS:
- Product A sells for $40, has $16 in COGS, and generates a 25% ACoS. Its ad spend per sale is $10, leaving a $14 contribution margin after advertising.
- Product B also sells for $40 and has a 25% ACoS, but its COGS is $30. The same $10 ad spend leaves no contribution margin before fixed costs.
The advertising ratio looks identical, yet the business impact is very different. Product A may have room to absorb overhead, test higher bids, or accept temporary ACoS pressure to improve CVR and volume. Product B may be destroying economic value even when its ACoS appears controlled. A seller who optimizes only for the ratio may therefore scale an unprofitable product while overlooking a stronger one with a higher—but still sustainable—ACoS.
Listing conversion belongs in this calculation because it affects how much advertising cost is required to obtain an order. If a page has weak CVR, the seller pays for more clicks per sale, increasing ad spend per order even when CPC is unchanged. In the TPMS case, the product had complete A+ content and a perfect rating, but the page still lagged the benchmark because the title, images, bullets, and review volume did not establish enough trust at the beginning of the decision path. The resulting issue was not that the product lacked information; it was that paid traffic reached a page with insufficient conversion capacity.
A spend projection also needs to be tied to actual traffic assumptions. For example, suppose a campaign receives 20 paid clicks per day at an average CPC of $1.20. The illustrative spend would be:
- Daily ad spend: 20 × $1.20 = $24
- Thirty-day spend at the same pace: $24 × 30 = $720
This is only one possible scenario, not a universal forecast. Actual spend will vary with bids, competition, impressions, CTR, targeting, and budget delivery. The next step is to connect that spend to CVR, orders, revenue, and COGS. Advertising reports that combine impressions, clicks, conversions, ACoS, and TACoS can help determine whether traffic is producing economically useful sales or merely increasing costs.
Use ACoS to monitor media efficiency, but use contribution margin after advertising to determine whether additional spend supports sustainable growth. Before assuming that lower CPC or lower ACoS will improve that margin, verify that the Listing is not creating an avoidable conversion loss.
Strategic Bidding: Aligning Spend with Margins and Product Lifecycle
Lower bids are not automatically more profitable. A bid that reduces CPC may also reduce impressions, CTR, conversion volume, and the sales velocity needed to improve BSR. The relevant question is not, “How can I pay less for each click?” It is, “What level of spend supports the product’s profit objective at its current lifecycle stage?”
Start with contribution margin. Identify the amount available after product cost, Amazon fees, fulfillment, discounts, and other variable expenses. Your advertising target must fit within that contribution margin. A product with healthy margins can tolerate more aggressive bidding when CVR is strong and the resulting ACoS remains compatible with the profit target. A low-margin product has less room for testing and should use a firm bid cap, even when additional traffic appears attractive. Without that cap, incremental orders can increase revenue while reducing contribution profit.
However, bid decisions should not be made without checking whether the Listing can convert the additional traffic. A motorcycle TPMS seller initially planned to solve its performance pressure through bid, keyword, and budget adjustments. DeepBI’s comparison found that the Listing scored 68/100 versus 82/100 for a benchmark competitor. The largest gaps were in bullet points and reviews, with additional weaknesses in title and main-image structure. Since the A+ content was already stronger than the benchmark, the page’s constraint was concentrated in the part of the funnel users encountered first.
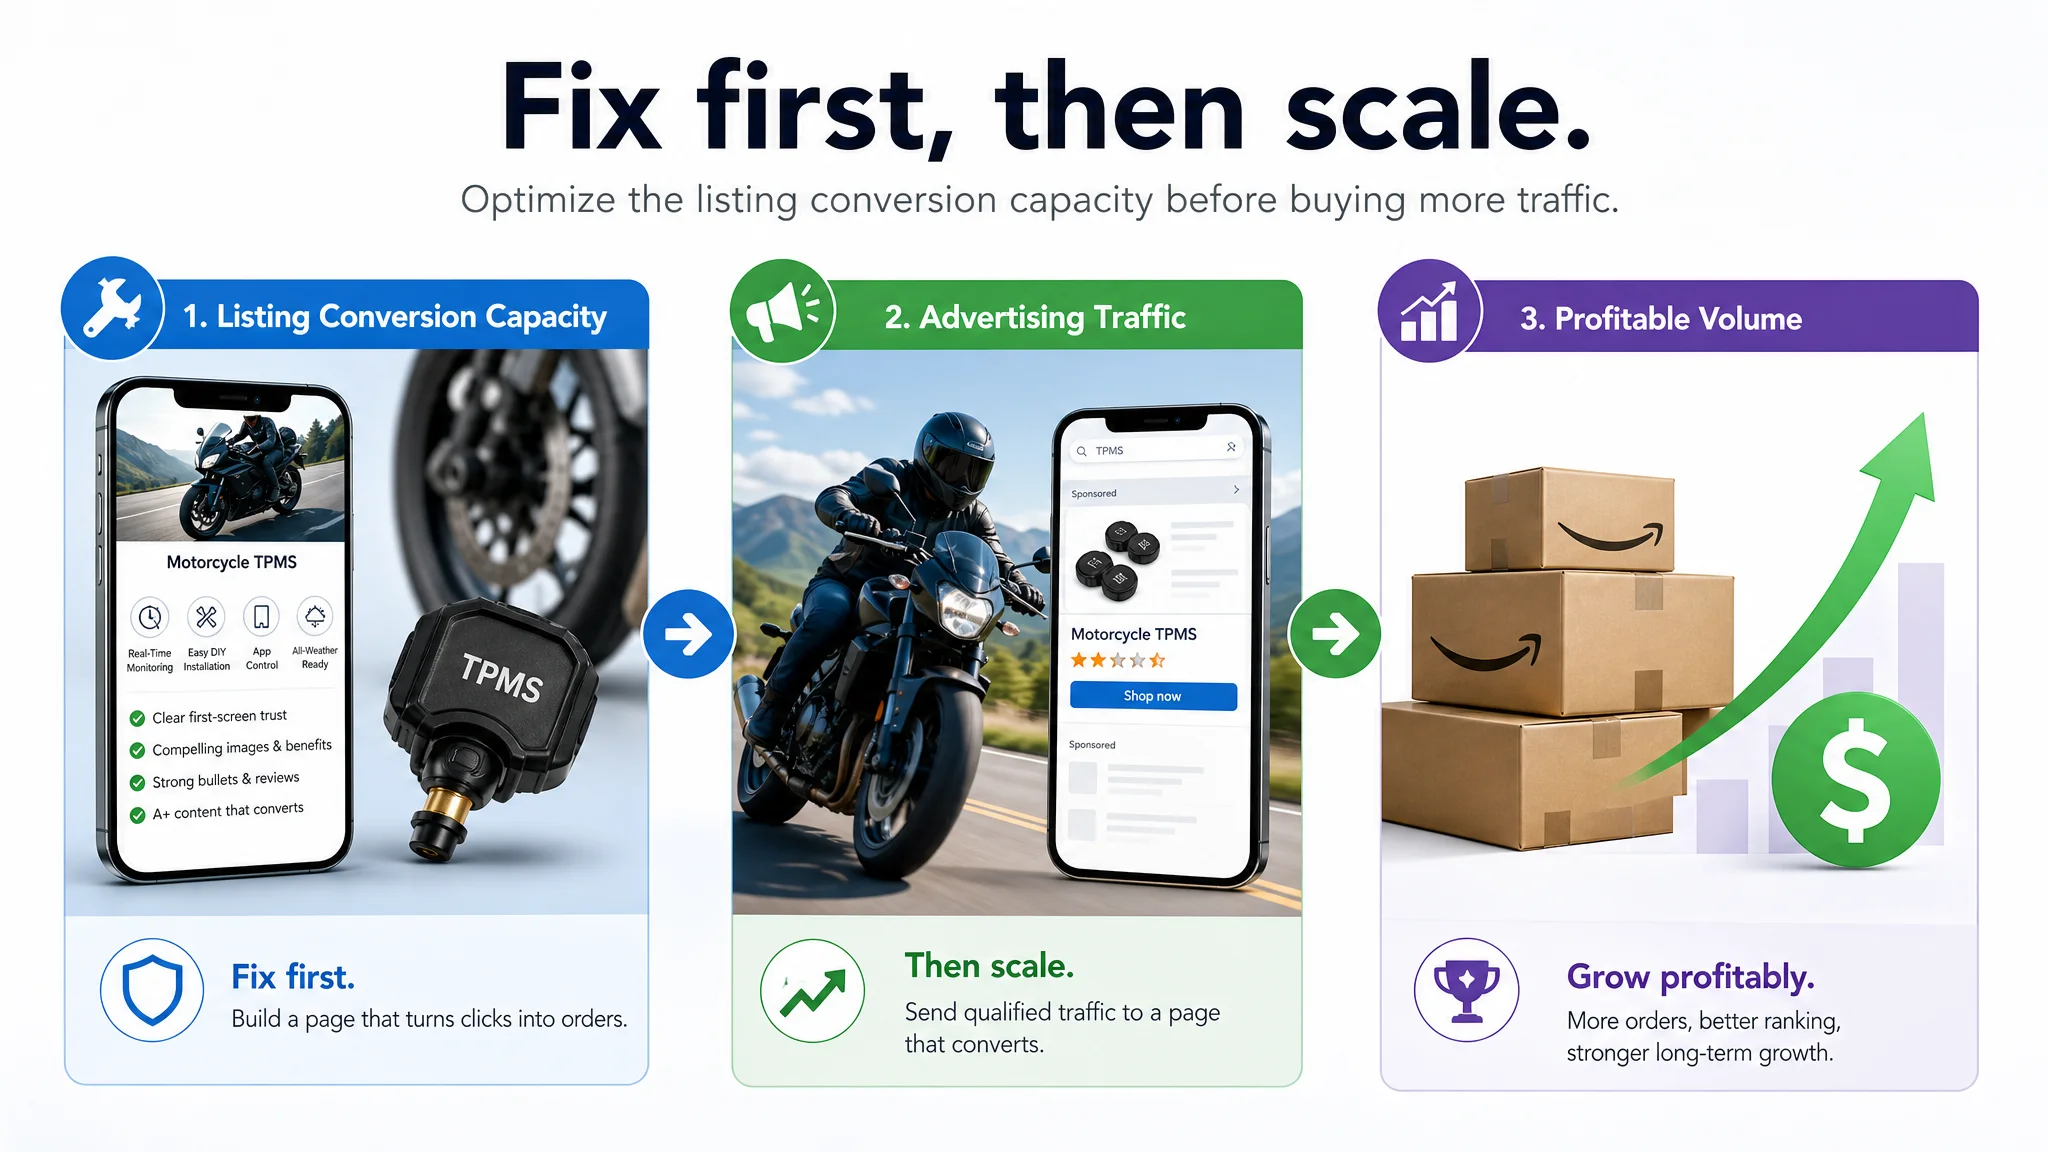
This finding changed the bidding decision. More traffic would not automatically create more profitable volume if the first-screen promise remained unclear, the images were text-heavy, and the bullets emphasized warnings rather than reassurance. The seller first needed to improve the page’s conversion capacity, then allow advertising to retest the revised Listing. Bidding is most effective when it amplifies a page that has a credible chance of converting the traffic.
Placement adjustments should reflect both margin and performance. Top-of-search generally warrants a higher adjustment when the product converts well there and the additional sales support the target return. Strong top-of-search CVR, stable ACoS, and sufficient margin can justify more aggressive exposure. If top-of-search receives clicks but produces weak CVR, raising the placement adjustment simply buys expensive traffic. In that case, reduce the adjustment or redirect spend toward rest-of-search, where performance may be more economical.
Amazon allows top-of-search placement adjustments of up to 900%. However, sellers should not treat the commonly observed 200% to 300% range of average effective costs as an Amazon-imposed maximum. That range is a practical observation, not a hard platform cap. The appropriate adjustment depends on the campaign’s bid, placement multiplier, CPC, CVR, margin, and resulting ACoS.
Lifecycle stage also changes the bidding objective:
- Launch: Accept controlled testing costs when the product needs impressions, search-term data, CTR signals, and initial conversion evidence. Set a loss limit before increasing exposure.
- Validation: Prioritize keywords and placements that demonstrate repeatable CVR and acceptable ACoS. Remove spend that produces clicks without contribution.
- Scale: Increase bids or budgets only after ACoS has remained consistently below the threshold required for the target profit for at least 60 days. A short profitable period is not enough evidence for expansion.
- Maturity or decline: Protect margin as conversion weakens, competition changes, or demand softens. Lower bids, tighter caps, and placement-specific controls can preserve cash flow.
Review advertising reports alongside Listing performance. Changes in CTR and CVR can alter the economics of an existing bid, while Listing iterations may affect ACoS, BSR, and listing cycle time. Treat bidding as a feedback loop: measure, adjust, and verify before committing additional capital.
Leveraging Data and Automation to Optimize Profit
Profit-oriented advertising requires more than lowering ACoS. A campaign can appear efficient while directing traffic to a product page with weak CTR or CVR, allowing wasted spend to accumulate before the underlying issue is addressed. Manual optimization often compounds the problem: sellers review reports separately, adjust bids based on incomplete signals, and make listing decisions without connecting paid performance to margin and organic growth.
A motorcycle TPMS Listing illustrates the cost of analyzing these signals separately. The product had full A+ content and a 5.0-star rating, which could make the page appear healthy when viewed through isolated metrics. Yet DeepBI’s Listing score showed a 14-point gap against a benchmark competitor. The strongest A+ content could not fully compensate for weaker title logic, less effective main images, bullet points that opened with warnings, and only five reviews compared with the competitor’s much larger review base. The team had initially been focused on ad performance, but the diagnostic evidence pointed to a Listing-conversion bottleneck.
DeepBI is an Amazon-dedicated AI operations system and all-in-one platform built exclusively for Amazon sellers. Its purpose is to connect advertising, Listing diagnostics, content optimization, and organic-growth workflows so that decisions are guided by business signals rather than isolated campaign metrics.
Its advertising structure uses four layers:
- Exploration gathers search-term and campaign performance signals without assuming every keyword deserves more budget.
- Filtering separates useful traffic from terms that generate clicks or spend without sufficient commercial value.
- Precision concentrates attention on keywords and targeting patterns that show stronger conversion potential.
- Scaling expands investment only when a keyword demonstrates both high conversion performance and suitable margin potential.
This progression protects profit by preventing every discovered keyword from being treated as a scaling opportunity. The goal is not maximum traffic at any cost; it is to direct more budget toward traffic that can support contribution margin and sustainable ACoS.
DeepBI can also adjust bids and budgets dynamically each day using seven-day ACoS, conversions, and spend. Rather than relying on fixed rules or occasional manual reviews, sellers can use profit-based decision logic that responds to recent performance. This automation does not eliminate the need for margin definitions or business judgment, but it reduces repetitive monitoring and limits guesswork in day-to-day campaign management.
Advertising optimization should not begin with more traffic when the Listing cannot convert it. DeepBI’s Listing scoring system functions as an automated market health check, evaluating areas such as the main image, title, bullet points, detail page, and review signals. Low CTR can point to a weak visual hook, while low CVR may indicate that the detail page or trust signals are not effectively converting demand. Identifying these weaknesses before deploying additional ad spend helps sellers address the conversion constraint first.
The TPMS diagnosis made this process concrete. The benchmark competitor used a clearer title structure, including the core category term, real-time monitoring, and easy installation. Its bullet points followed a buyer-centered sequence from identity and reassurance to use, safety, and compatibility. The customer’s Listing instead prioritized “Upgraded Version,” technical parameters, and warnings. The difference was not merely a copywriting preference; it changed the user’s decision path from “this is a smart riding guardian” to “this product may be complicated and risky.”
When winning ad keywords emerge, DeepBI connects those signals to its fifth layer and Top-of-Search campaigns. Keyword insights can guide Listing and visual optimization, while stronger relevance and conversion support may contribute to organic ranking and lower TACOS over time. Results are not automatic or guaranteed, but the workflow creates a measurable link between paid search learning, Listing improvements, BSR movement, and long-term advertising dependence.
Measuring Long-Term Profitability: TACOS and Organic Growth
A campaign can show an attractive ACoS and still contribute little to the brand’s bottom line. ACoS measures advertising spend against attributed advertising sales, making it useful for evaluating bids, targeting, and campaign efficiency. However, it does not show how heavily the entire business depends on paid traffic or whether advertising is supporting profitable organic growth.
TACOS provides that broader perspective:
TACOS = Total advertising spend ÷ Total sales
Because the denominator includes both advertising-attributed and organic sales, TACOS connects ad investment to overall brand performance. Campaign-level ACoS may rise while TACOS falls if paid traffic helps generate more organic sales. Conversely, a low ACoS may conceal weak economics when total sales remain dependent on expensive traffic, margins are thin, or organic demand is not developing.
Listing quality is part of this broader equation. If paid traffic consistently reaches a page with weak conversion signals, the seller may need more advertising to produce each order, while the Listing generates fewer positive behavioral signals that could support organic visibility. In the TPMS example, DeepBI did not recommend treating advertising as the first lever because the title, main images, bullets, and review scale were not yet strong enough to support efficient conversion. Improving those entry points was intended to make both paid and organic traffic more productive.
For this reason, sellers should evaluate advertising at two levels:
- Campaign level: ACoS, CTR, CPC, CVR, search-term relevance, and conversion quality.
- Brand level: TACOS, total contribution margin, organic sales share, BSR movement, and the proportion of revenue that still requires paid support.
The objective is not to minimize ACoS in isolation. It is to acquire relevant traffic at a cost the product can support while improving the Listing’s ability to convert that traffic. Stronger relevance and CVR can make paid clicks more productive, while sales and engagement generated through relevant traffic may support greater organic visibility. Organic performance can then reduce reliance on paid sales, lowering TACOS over time. The pace and extent of that effect will vary, so ranking improvement should be monitored rather than assumed.
This creates a practical growth cycle:
1. Relevant paid traffic produces qualified impressions, clicks, and conversions.
2. Advertising data identifies high-converting search terms and product attributes.
3. Those signals guide Listing, visual, and messaging improvements that can strengthen CVR.
4. Better conversion performance supports stronger organic visibility and BSR.
5. A larger organic sales base reduces the share of revenue that must be purchased through advertising.
6. Improved TACOS and contribution economics create room to fund further growth.
The TPMS page showed why the cycle can break before the Listing receives enough attention. The A+ content already contained problem–solution messaging, installation information, maintenance guidance, and multi-vehicle adaptation. But users had to scroll far enough to encounter those strengths. The title and image gallery did not immediately communicate the product’s motorcycle specialization, real-time monitoring, compact design, or ease of installation. The page therefore had useful conversion content deeper in the funnel but insufficient trust and clarity at the entry layer.
Campaign segmentation by shopper intent can help diagnose where this cycle is working. Separate discovery, consideration, and conversion traffic, then compare each segment’s CTR, CVR, ACoS, TACOS contribution, and profit impact. A high ACoS in discovery may be acceptable if it introduces relevant demand, while conversion-focused traffic may require tighter profitability controls. This segmentation may reveal opportunities to reduce wasted spend and improve blended ACoS, but any reduction is an illustrative diagnostic outcome—not a guaranteed result or universal benchmark.
Review TACOS alongside organic sales share, margin, CVR, and BSR on a consistent schedule. The strongest advertising decision is not always the one that produces the lowest immediate ACoS; it is the one that improves the brand’s ability to generate profitable sales with progressively less dependence on paid traffic.
Common Pitfalls and How to Avoid Them
Amazon advertising becomes expensive when sellers optimize the wrong signal. A low ACoS can look like proof of efficiency, yet an account built solely around minimizing ACoS may suppress profitable growth. Cutting bids, limiting budgets, or pausing campaigns whenever ACoS rises can remove visibility for high-margin products and reduce qualified traffic. The relevant question is not whether ACoS is low in isolation, but whether advertising generates profitable orders, supports CVR, improves BSR, and creates room to scale within the product’s contribution margin.
A second mistake is treating every advertising problem as a bidding problem. Poor Listing relevance can waste paid traffic before the auction or budget becomes the primary issue. If the title, bullet points, main image, and A+ content do not clearly match shopper search intent, CTR may be weak because the offer is not compelling or recognizable. If the Listing attracts clicks but fails to communicate product details, trust, or use-case fit, CVR declines and ACoS rises because more paid visits produce fewer orders. Diagnose the funnel separately: CTR reflects the quality of the initial attraction, while CVR shows how effectively the detail page converts that traffic.
The TPMS seller initially made exactly this type of misdiagnosis. The team believed expensive advertising required better bids, campaign structures, and keyword organization. The Listing comparison showed that the more fundamental issue was the page’s ability to turn traffic into orders. The title emphasized vague upgrade language, the bullets opened with technical warnings, and the image gallery relied too heavily on text while underrepresenting real motorcycle use and installation simplicity. The A+ content was strong, but it appeared later in the decision path.
This explains why traditional ad optimization kept failing to address the problem. Adjusting placements cannot make a title more precise. Adding keywords cannot make a warning-heavy bullet sequence feel reassuring. Lowering CPC cannot create review volume or make a mobile thumbnail communicate an app’s value. If the page is not answering the shopper’s first questions, additional traffic simply exposes the same conversion weakness to more visitors.
Negative keywords also require precision. Their purpose is to prevent spend on search terms that are demonstrably irrelevant to the product or commercially unsuitable. Used carelessly, they can block terms that generate valuable clicks or orders, narrowing discovery and restricting future scale. Sellers should evaluate exclusions against search-term relevance, orders, CVR, and profitability rather than adding negatives simply because a term has a temporary ACoS spike. A keyword that is unprofitable in one campaign or match context may still warrant a different bid, placement, or budget decision elsewhere.
Content optimization creates another common misconception. Optimized content does not generally cause CTR to fall. More relevant imagery and copy can improve qualified traffic and attract stronger engagement. In some cases, tighter relevance may narrow the audience and slightly depress CTR, but that change is not automatically negative. If the resulting visitors convert at a substantially higher rate, profit per click can increase even with fewer clicks. The opposite is also possible: a high CTR can reflect broad curiosity rather than purchase intent, resulting in weak CVR and poor ACoS.
The TPMS comparison also shows why content should be evaluated by decision logic rather than by volume. The customer had full A+ content and complete product lifecycle information, but its first-screen elements lagged behind the benchmark. Meanwhile, the competitor’s bullets built a clear progression around identity, ease, safety, connected features, and riding use cases. More information did not automatically create more conversion. The information had to arrive in an order that reduced uncertainty and gave the shopper a reason to continue.
Trust signals require the same level of care. A perfect rating may look stronger than a lower average rating, but review volume changes how buyers interpret that rating. In this case, the customer’s 5.0-star rating came from five reviews, while the benchmark had a 4.3-star rating supported by 2,137 reviews. The issue was not rating quality; it was the limited scale of social proof. Five perfect reviews could appear like early-stage evidence, while a larger review base can communicate broader real-world validation. Therefore, star rating alone should not be used as proof that a Listing has strong trust.
Use Listing diagnostics to connect causes with outcomes. A structured audit of the main image, title, bullets, A+ content, and customer feedback can reveal whether the bottleneck lies in attraction or conversion. Combine those findings with impressions, clicks, orders, CTR, CVR, ACoS, and profit per order. “Better-looking” content is not enough; the objective is more profitable traffic, not a stronger single metric.
Actionable Playbook: Balancing ACoS and Profit
Use this checklist to turn ACoS from a reporting metric into a profit-control system. Review each product and campaign against contribution margin, CVR, placement economics, and TACOS rather than applying one universal “good” ACoS target.
- Calculate true contribution margin for every product: Start with selling price, then subtract COGS, Amazon fees, fulfillment costs, discounts, and advertising spend. For example, a product priced at $40 with $18 in non-ad costs has $22 available before advertising; a 30% ACoS consumes $12 in ad spend, leaving $10 contribution before fixed overhead.
- Separate break-even ACoS from target ACoS: Break-even ACoS is the maximum advertising ratio that leaves no contribution after variable costs. Set a lower or higher target ACoS according to lifecycle, inventory priorities, competition, and growth goals—not according to a generic benchmark.
- Set advertising cost as a defined share of per-unit profit: Decide how much of each unit’s contribution you are willing to reinvest, such as 15–30%, then calculate the allowable CPC from expected CVR and that allocation. The 0.25 multiplier found in some cost guides is arbitrary; the right allocation depends on your product lifecycle, competition, and growth goals. Track profit per click, not CPC alone: a more expensive click can be preferable when CVR and contribution are stronger.
- Apply placement modifiers according to margin and conversion performance: Compare top-of-search, rest-of-search, and product-page CVR with the resulting ACoS and contribution per order. Top-of-search may cost roughly 200–300% of the base bid in many observed scenarios while converting 30–50% better, but Amazon allows adjustments up to 900%; treat those figures as decision inputs, not hard limits. Cap aggressive placement bids when a low-margin product cannot absorb the spend.
- Scale budgets only after sustained profit validation: Increase budget when ACoS remains under the target profit threshold consistently for at least 60 days and conversions, spend quality, and contribution margin remain acceptable. Do not scale simply because impressions or clicks are rising.
- Audit search-term reports every week: Identify irrelevant queries, high-spend terms without conversions, and search terms whose ACoS exceeds the product’s profit limit. Add appropriate negative keywords, while preserving terms that generate profitable orders even if their CPC is comparatively high.
- Check the Listing before increasing ad spend: Compare the title, main images, bullet points, A+ content, and review signals against relevant category benchmarks. In the motorcycle TPMS example, the Listing scored 68/100 against a benchmark score of 82/100. The largest gaps were not in deep content but in the front-end elements that establish relevance and trust. A score gap of this kind does not prove that advertising is the sole cause of weak performance, but it is strong evidence that more traffic should not be the first response.
- Repair the conversion logic before asking advertising to scale: Make sure the title communicates the core product and a clear benefit, the main image creates an understandable click trigger, and the bullets move from user identity and benefit to ease, functionality, reassurance, and compatibility. For the TPMS Listing, this meant moving away from vague “Upgraded Version” language and warning-heavy bullets toward clearer promises such as real-time monitoring, easy DIY installation, and the idea of a smart riding guardian. The purpose is not decorative copy improvement; it is to increase the probability that a paid click becomes an order.
- Use DeepBI to automate the advertising feedback loop: Its four-layer funnel—exploration, filtering, precision, and scaling—can prioritize high-converting, high-margin keywords before they reach the scaling layer. DeepBI can also use seven-day ACoS, conversions, and spend for daily bid and budget adjustments based on defined profit rules, reducing reliance on manual guesswork.
- Use Listing scoring to locate the real bottleneck: DeepBI’s Listing scoring system can flag low-CTR or low-CVR product pages before more traffic is purchased. It evaluates the main image, title, bullet points, detail page, and review signals, making it easier to distinguish a media-efficiency problem from a page-level conversion problem. Before pouring money into a campaign, confirm that the page can convert that traffic; otherwise, weak Listing relevance can inflate ACoS.
- Monitor TACOS alongside ACoS: TACOS measures ad spend against total sales and reveals whether paid demand is supporting organic growth. DeepBI can identify winning ad keywords and support Top-of-Search campaigns that contribute to organic ranking, creating a feedback loop that may lower TACOS over time without guaranteeing a specific result.
- Let DeepBI execute the recurring checks continuously, then keep strategy human-led: Its Amazon-dedicated ad automation can apply the defined feedback process while you review margin assumptions, product priorities, placement limits, and growth decisions. Automation handles recurring signals; sellers remain responsible for the profit framework and strategic direction.
The central operating rule is simple: do not ask advertising to compensate for a Listing that has not yet earned more traffic. ACoS becomes easier to interpret when the page has a clear promise, credible trust signals, relevant visuals, and a logical path from click to purchase. Sustainable ad spend is therefore not achieved by chasing the lowest percentage. It comes from aligning media cost, Listing conversion, contribution margin, and organic growth into one decision system.