


The 2026 Snapshot: How to Read Amazon Data Without Getting Fooled by It
Amazon should be read as marketplace infrastructure, not only as a retailer. Its operating system connects shoppers, logistics, advertising, payments, and millions of third-party businesses. For sellers, the relevant question is therefore not simply how large Amazon’s corporate revenue is, but how platform scale translates into traffic access, conversion opportunities, fees, advertising costs, and margin pressure.
A useful starting point is an annual revenue-scale figure reported for Amazon as a company. That figure describes the size of the entire business, including activities beyond the seller marketplace. It should not be treated as the revenue available to third-party sellers, nor as a direct estimate of marketplace profit. Pair it with Amazon’s statement that third-party sellers account for more than 60% of units sold in Amazon’s store. The unit-share figure measures items sold through the store, not more than 60% of Amazon’s total company revenue. Revenue, units, orders, active sellers, and advertising sales are different measures with different scopes.
The same discipline applies to seller-facing claims. A platform statement about reach or business impact may be useful context, but it is not interchangeable with a defined financial or operating metric. Before using any statistic in planning, identify:
- What is being measured: revenue, units, orders, traffic, or sellers?
- What period does it cover?
- Does it describe Amazon globally, one marketplace, or a seller segment?
- Is it a reported figure or a marketing claim?
Amazon’s history also needs precise wording. The company began as an online bookstore in Jeff Bezos’s garage at his rented home in Bellevue, Washington. That origin story is relevant context, but it does not explain today’s economics. Seller decisions should rest on metric definitions and scope, then connect those figures to CTR, CVR, ACoS, BSR, and listing cycle time.
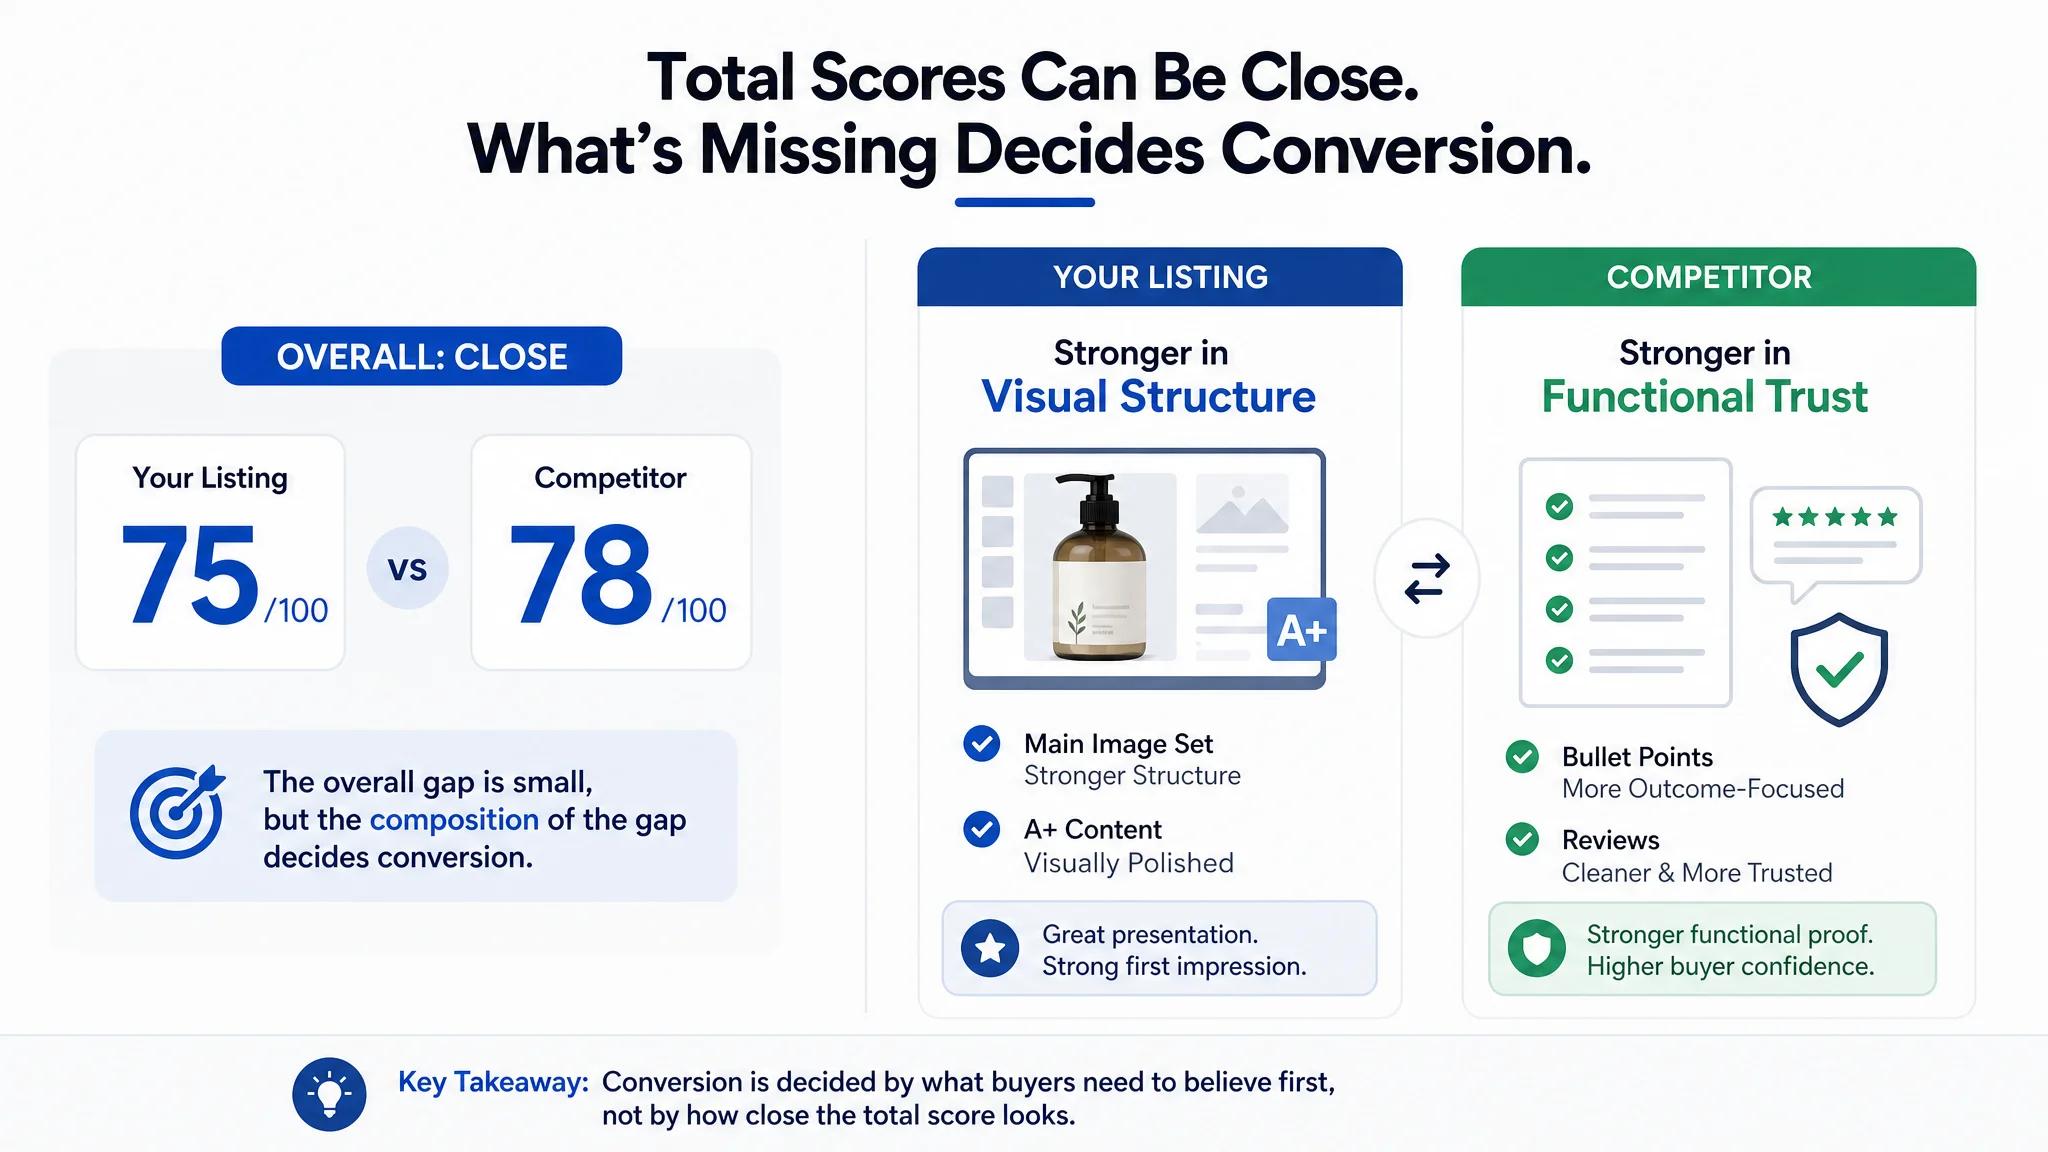
The same principle applies at the listing level. A single Listing score, traffic number, or advertising metric can look reassuring while hiding a commercially important weakness. In one premium hand soap listing, the overall DeepBI score was 75/100 compared with 78/100 for a key competitor. The page looked polished, the main image structure was strong, and the A+ content was visually complete. Yet ACoS remained difficult to control and orders did not grow in line with paid traffic.
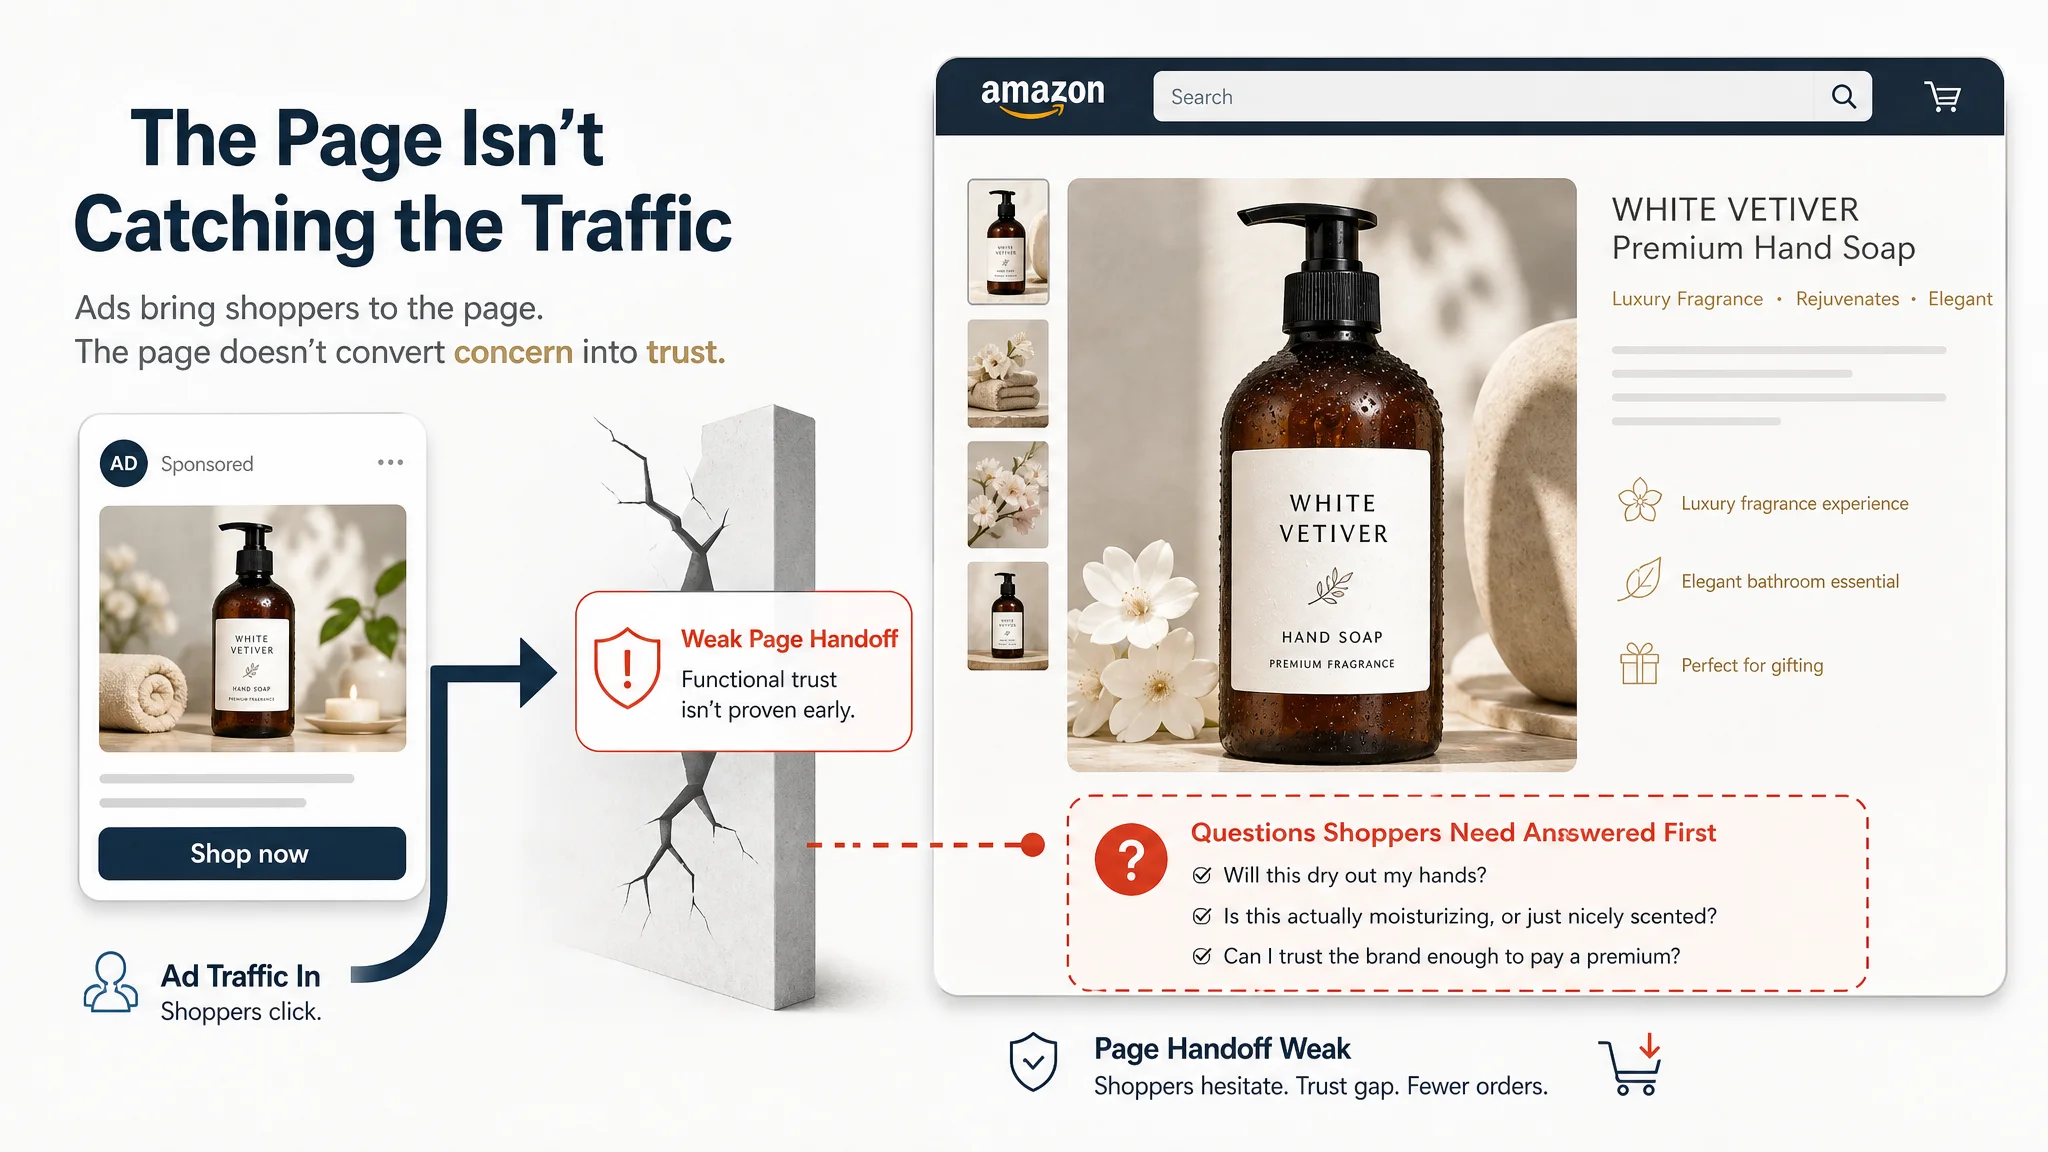
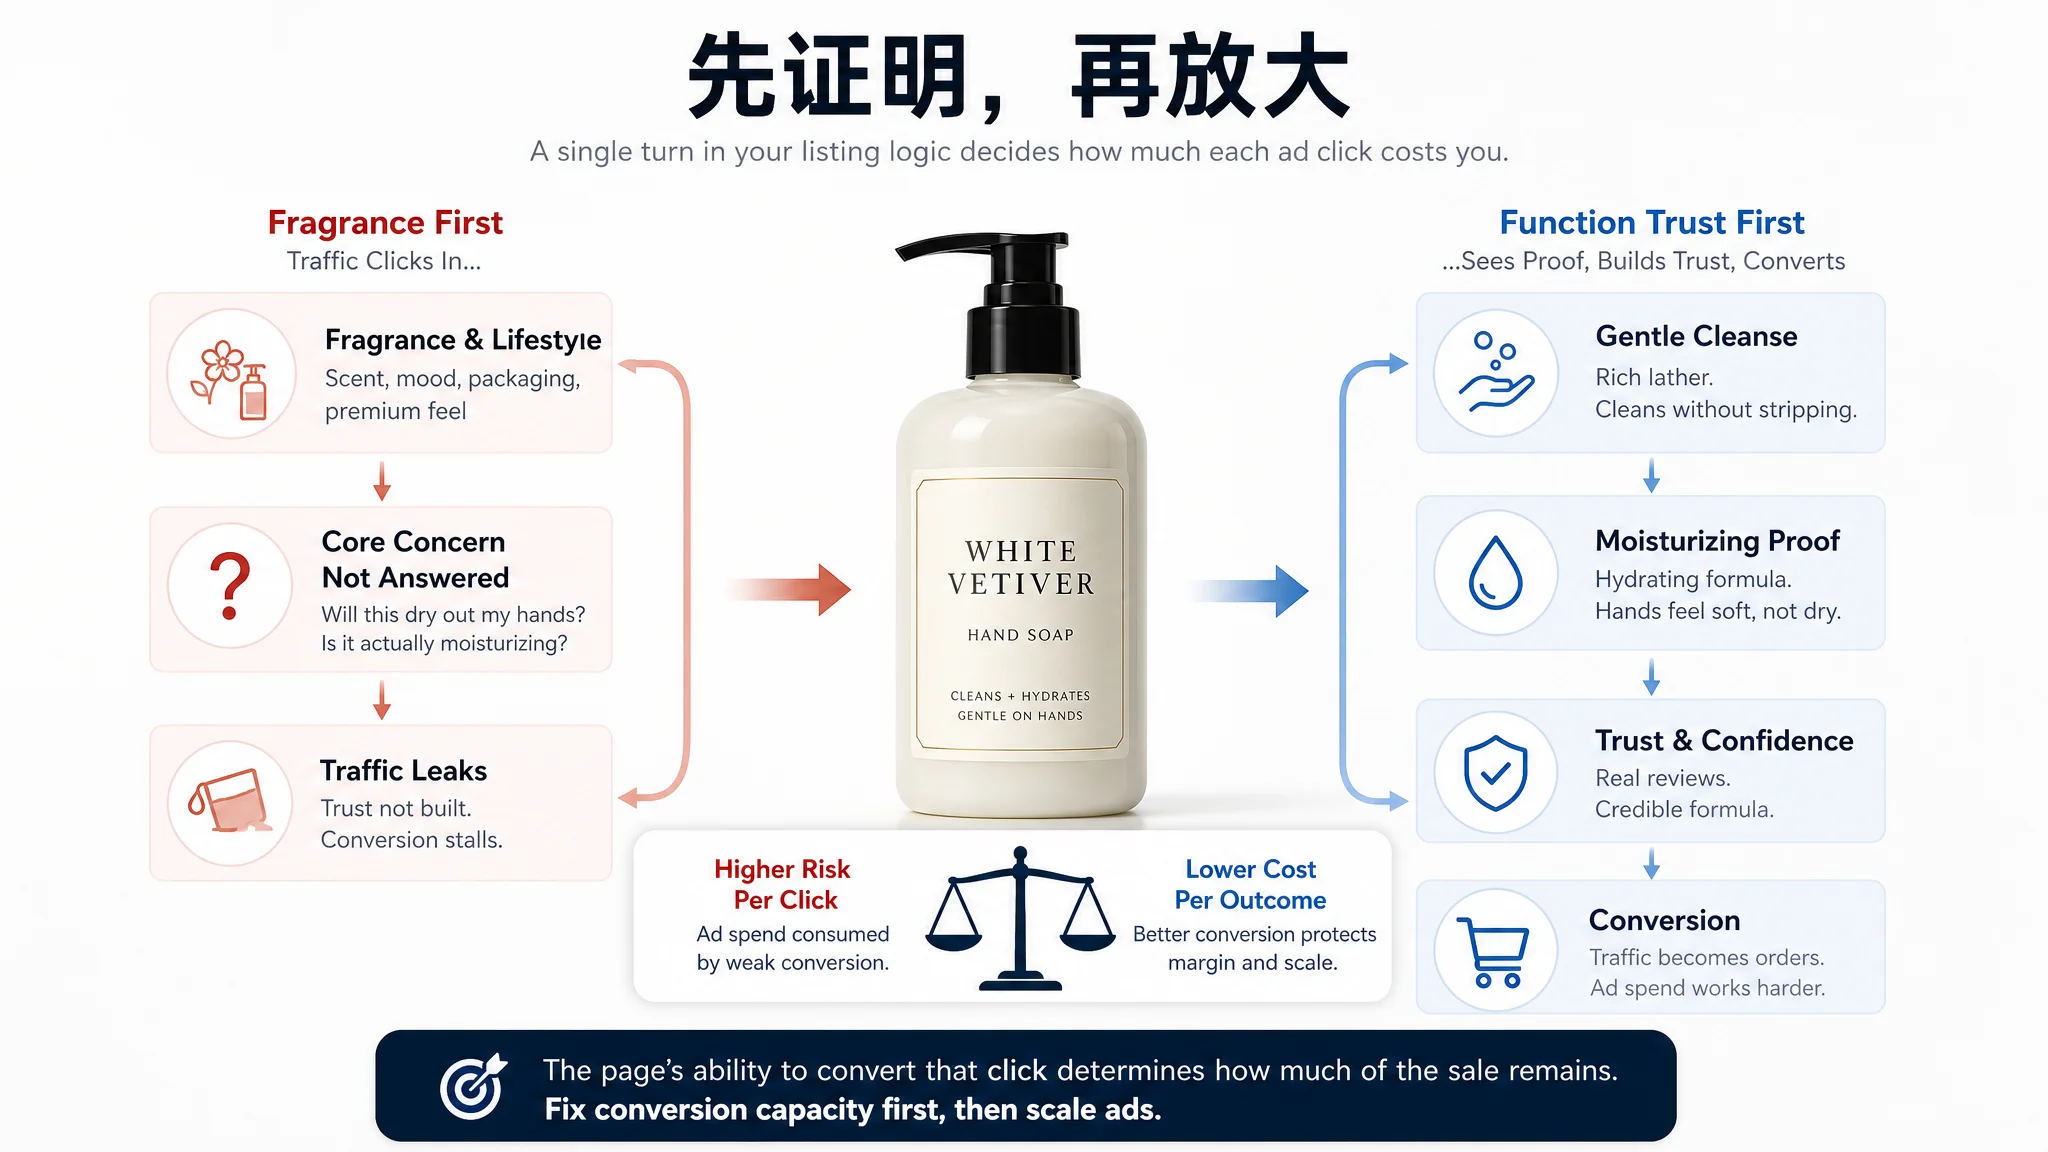
The seller initially interpreted that pattern as an advertising or keyword problem. A closer diagnosis found that the page was emphasizing fragrance and lifestyle before proving the functional promise buyers wanted to confirm: whether the soap would clean effectively without leaving their hands dry. The lesson is broader than that one listing: aggregate scores and headline statistics are useful starting points, but they cannot replace a breakdown of what the metric actually captures and where the conversion path is failing.
Amazon by the Numbers: Revenue, Seller Population, and Global Reach
Revenue and growth trajectory
Amazon’s scale is clearer as a sequence than as a single headline figure. Company revenue rose from $513.98 billion in 2022 to $574.79 billion in 2023, then to $637.96 billion in 2024. Q2 2025 revenue reached $167.7 billion (Amazon quarterly and annual earnings releases, 2022–2025). The annual progression shows sustained expansion, while the quarterly figure provides a more recent operating reference without being directly substituted for a full-year result.
For sellers, corporate revenue is context rather than a forecast of marketplace performance. A growing company can still contain categories with falling demand, rising advertising costs, or weaker conversion. Seller decisions should therefore connect Amazon’s scale to product-level metrics such as CTR, CVR, ACoS, BSR, and listing cycle time instead of assuming that company growth automatically lifts every account.
A listing can receive traffic inside a growing marketplace and still fail to capture the value of that traffic. In the hand soap example, the seller was not operating in a zero-demand environment: ads were running and shoppers were reaching the page. The difficulty was that the listing converted the traffic inefficiently because it answered a secondary question—what the fragrance and lifestyle experience felt like—before answering the primary concern about cleansing, moisture, and trust. Marketplace growth creates access to demand; it does not guarantee that each product page can convert that demand.
Third-party sellers: what the "60%" figure really measures
The frequently cited more-than-60% figure refers to the share of units sold in Amazon’s store attributed to third-party sellers. It does not represent more than 60% of Amazon’s total company sales, revenue, or corporate business. That distinction matters because Amazon also earns revenue from businesses outside the store, including cloud services and other operations.
Estimates of active sellers should likewise be treated as a range, not a precise census. Common estimates span roughly 1.65 million to 2.5 million, with approximately 1.9 million often cited as a practical midpoint. The "more than 60%" framing comes from Amazon's own marketplace disclosures, while the seller-count range is a third-party estimate rather than an Amazon-published census. The useful conclusion is structural: third-party sellers form a large and durable commercial layer, but competition varies sharply by marketplace, category, brand strength, and traffic economics.
A mature global marketplace footprint (North America, Europe, Asia) and the FBA logistics layer
Amazon’s marketplace is mature across North America, Europe, and Asia, giving sellers access to a cross-region operating structure rather than a single-country channel. FBA functions as the qualitative logistics layer supporting that model: sellers can place inventory within Amazon’s fulfillment network and use a more standardized path for storage, delivery, and customer fulfillment across eligible markets.
That reach does not remove regional complexity. Listings, compliance requirements, demand patterns, advertising costs, and inventory economics still need market-level management. Cross-region expansion should be evaluated through contribution margin, CVR, ACoS, and replenishment or listing cycle time—not geographic coverage alone.
Prime, workforce, and the AWS profit engine in context
Prime’s household reach, membership scale, and free-shipping indicators describe customer stickiness more effectively than traffic alone. A recurring membership relationship can support repeat purchasing and lower friction at checkout, although sellers still compete for visibility and conversion inside that ecosystem.
Amazon’s total workforce and corporate workforce figures should be kept separate when evaluating operating structure. The 2025 cuts were one of the largest recent restructuring rounds, but smaller than the reduction wave in 2022–2023. AWS adds another layer of corporate context: its global cloud infrastructure share was approximately 30% in Q2 2025, compared with Azure at about 20% and Google Cloud at about 13% (Synergy Research, Q2 2025). Those figures explain Amazon’s broader profit engine; they do not measure marketplace sales or third-party seller revenue.
Fees and Margins: What Amazon Actually Takes
Referral, fulfillment, and net margin ranges
Amazon margin is not determined by the referral fee alone. A practical cost model combines referral, fulfillment, advertising, selling-plan, product, and conversion-related costs.
The supplied referral-fee range is approximately 8–15% of revenue. Fulfillment can represent approximately 13–47%, depending on category and price point. These ranges are wide enough to change the viability of an offer even before product cost and advertising are included. A typical net-margin range of approximately 15–20% provides a useful benchmark for assessing how much room remains after the full operating stack. DeepBI frames ACoS and effective ad spend against that 15–35% benchmark so the range is read through the product's own margin rather than treated as a target.
Referral and fulfillment costs must remain in the model for every listing, whether a particular listing converts yet or not. A listing can generate impressions and clicks without producing an order, while the seller still carries the economic burden of traffic acquisition and conversion work. Once an order occurs, the referral and fulfillment deductions apply alongside advertising rather than instead of it.
For example, on a $100 sale, a 15–35% PPC ACoS represents $15–$35 of advertising spend. That amount sits on top of referral costs of roughly $8–$15 and fulfillment costs of roughly $13–$47. Before product cost, storage, returns, discounts, and overhead, those three categories can therefore consume approximately $36–$97 of the sale. ACoS is not a substitute for referral or fulfillment expense; it is an additional layer of effective spend.
The Individual selling plan is a separate choice: it charges $0.99 per item sold and has no per-item listing fee. Sellers should include that charge in per-unit arithmetic rather than confusing it with a fee to list an item.
Low CTR or CVR can make the stack worse by forcing more paid traffic to produce each order. Using stable ad signals to guide visual optimization can connect improvements in CTR and CVR with lower ACoS and, potentially, less dependence on paid traffic.
The hand soap listing illustrates why conversion capacity belongs in the margin model. The seller initially viewed rising ACoS as evidence that bids, keywords, or budgets needed further adjustment. However, the listing’s largest weaknesses were in bullet points and reviews: the bullets scored 4/10 compared with the competitor’s 7/10, while reviews scored 10/10 compared with 13/10. The page was visually premium, but its core sales copy and social proof did not quickly resolve whether the product would provide a gentle, moisturizing wash.
In that situation, every additional click carries more economic risk. The advertising spend is not the only variable; the page’s ability to convert that spend determines how much of the sale remains after referral, fulfillment, and product costs. This is why a low or unstable CVR should not automatically lead to more bid adjustments. The first question is whether the listing is giving high-intent shoppers enough reason to purchase.
Buy Box: who wins the default offer
The Buy Box is the default offer presented to shoppers. One seller becomes the primary visible offer and captures the majority of sales, although the exact share varies by category and marketplace conditions. Losing that position can reduce conversion even when the product remains available, so Buy Box performance belongs in margin analysis: traffic without competitive offer placement may not produce efficient CVR or acceptable ACoS.
One short block: how TikTok Shop fees are structured differently
TikTok Shop requires a like-for-like comparison. In the US, referral plus transaction fees typically total under 10% before the 10–20% affiliate commission when affiliates are used. In the UK and EU, referral fees near 9% plus 2–3% transaction fees can push the total above 10%. These figures describe a different cost structure, not a universal platform advantage. Return to Amazon’s full arithmetic—referral, fulfillment, ACoS, plan charges, product cost, and net margin—before comparing channels.
Traffic and Discovery: Keywords, Rank Movement, and Click-Through Benchmarks
Amazon discovery is primarily search-driven. For most sellers, keyword placement, search rank, impressions, and clicks provide more operational value than content virality on other platforms. The practical question is not simply whether a keyword is present in a title or bullet point, but whether the listing gains relevant exposure, earns clicks, and converts that traffic at an acceptable CVR and ACoS.
Reading keyword rank movement
A move from approximately rank #176 to #18 is materially different from a move from #23 to #20. The first signals a much larger change in search visibility; the second may indicate incremental improvement within an already competitive range. Neither movement proves that demand has increased, that sales caused the change, or that the market is easy to enter. Rank is a signal that needs to be read alongside impressions, clicks, CVR, advertising data, and BSR.
Time horizon is equally important. A month-over-month increase may reflect a short-lived event, promotion, or temporary competitive change. Year-over-year comparison helps test whether interest is repeating across a comparable period. A 15-month view can expose whether a keyword has sustained momentum, recurring seasonality, or only a brief spike. Trending terms may attract more attention while also carrying tighter marketplace restrictions, higher bids, and stronger competition.
Keyword analysis should therefore separate discovery from decision-making. Sellers can extract core search terms from titles and bullet points, compare keyword placement against similar ASINs, and then validate the findings against actual exposure, clicks, conversions, and rank movement. Similarity matters: comparisons should account for product form, function, price band, audience, and visual positioning rather than treating every listing as a direct substitute.
The hand soap seller initially considered expanding fragrance and gift-related keyword coverage because the brand was positioned as premium and the listing included extensive scent language. That interpretation focused on whether the listing was discoverable for the right terms, but not on what happened after a shopper arrived. A competitor with a similar overall Listing score was using its title to foreground concrete formula information such as aloe vera and shea butter, while the seller’s title placed more emphasis on premium fragrance and rejuvenation.
The issue was not that lifestyle or scent terms were irrelevant. It was that search relevance alone could not compensate for a page that failed to establish functional credibility quickly. Keyword expansion would have brought more shoppers into the same decision path without changing the answer to their main concern. Rank and traffic data therefore needed to be connected to the listing’s conversion logic rather than interpreted as evidence that more keyword coverage would solve the problem.
What "CTR" can and cannot tell you here
CTR is normally calculated as clicks divided by impressions, but the denominator must be stated. A report using clicks divided by searches, sessions, or another exposure base is measuring a different rate. An unexplained value above 100% should not be presented as standard Amazon CTR; it may reflect a different denominator, aggregation method, or reporting error.
CTR is useful for diagnosing the transition from exposure to traffic, not for proving demand or profitability by itself. Low CTR may point to a mismatch in keyword intent, title clarity, or main-image strength. One product-specific diagnostic treats CTR below 0.35% as a possible main-image weakness only when other scoring and business data support that interpretation. Sellers should connect CTR changes to CVR, ACoS, and listing-cycle decisions rather than optimize a percentage in isolation.
A strong CTR can also conceal a conversion problem. In the hand soap comparison, the seller’s main image system was structurally stronger than the competitor’s, scoring 26 compared with 24. The A+ content also scored higher structurally. Yet the competitor used its second image to show a hand using the soap, visible foam, and messaging around softness and smoothness. The seller used the comparable position to extend the fragrance story.
This distinction matters because visual quality and visual priority are not the same thing. A page can look polished and earn clicks while still failing to explain whether the product is gentle, hydrating, and suitable for repeated use. CTR may indicate that shoppers are willing to enter the page, but CVR reveals whether the page answers the questions that follow the click. The right response to weak orders is therefore not always to improve the click stage; it may be to repair the transition from interest to confidence.

Advertising and Paid Growth: ACoS Benchmarks and Spend Discipline
Sponsored Products work best as a controlled evidence loop, not as a daily reaction to fluctuating clicks or orders. Start with broad exploration across relevant keywords and competitor ASINs. The first layer is designed to discover traffic, so CTR, clicks, and search-term relevance matter before immediate profitability. The second layer filters out traffic that receives attention but produces weak CVR or consumes spend without credible conversion evidence. The third concentrates bids and budgets on terms and ASIN targets that repeatedly convert. The fourth scales only the proven slice. DeepBI structures Sponsored Products work as this four-layer traffic funnel—explore, initial filter, precise, scale—so keyword and ASIN opportunities convert into stable traffic rather than one-off spikes. In practice, only a minority of explored traffic typically deserves additional budget; this is a selection principle, not a guarantee that any campaign will produce a scalable winner.
DeepBI drives dynamic bidding and budget adjustment from the past seven days of clicks, conversions, spend, and ACoS, with each change explainable and reviewable day by day. Use the same rolling seven-day view of clicks, conversions, spend, and ACoS to guide each adjustment. A single day can be distorted by low volume, delayed attribution, or normal marketplace variation. A reviewable operating log should record the prior seven-day evidence, the change made, and the next observation point:
- Weak CTR with relevant impressions: review the main image, offer, and keyword-to-listing alignment before simply raising bids.
- Adequate CTR but weak CVR: investigate the Listing, price, reviews, and traffic quality before expanding spend.
- Repeated conversions with acceptable ACoS: increase bids or budget selectively, while preserving a clear before-and-after record.
- Rising spend without proportional conversions: reduce exposure, isolate the target, or return it to testing.
A 15–35% ACoS range can serve as a planning benchmark, not a universal rule. Compare ad cost with referral fees, fulfillment fees, selling price, and contribution margin to calculate the ACoS the product can actually sustain. Also keep ACoS separate from TACoS: Sponsored Products efficiency can improve while total advertising cost remains high relative to revenue. Ad-validated high-CTR and high-conversion keywords are worth defending at the top of search because short-term ad lift and longer-term natural rank improvement can reinforce each other. Stable advertising signals can also guide Listing and visual revisions, with CTR and CVR reviewed again after the change rather than judged from an isolated daily result.
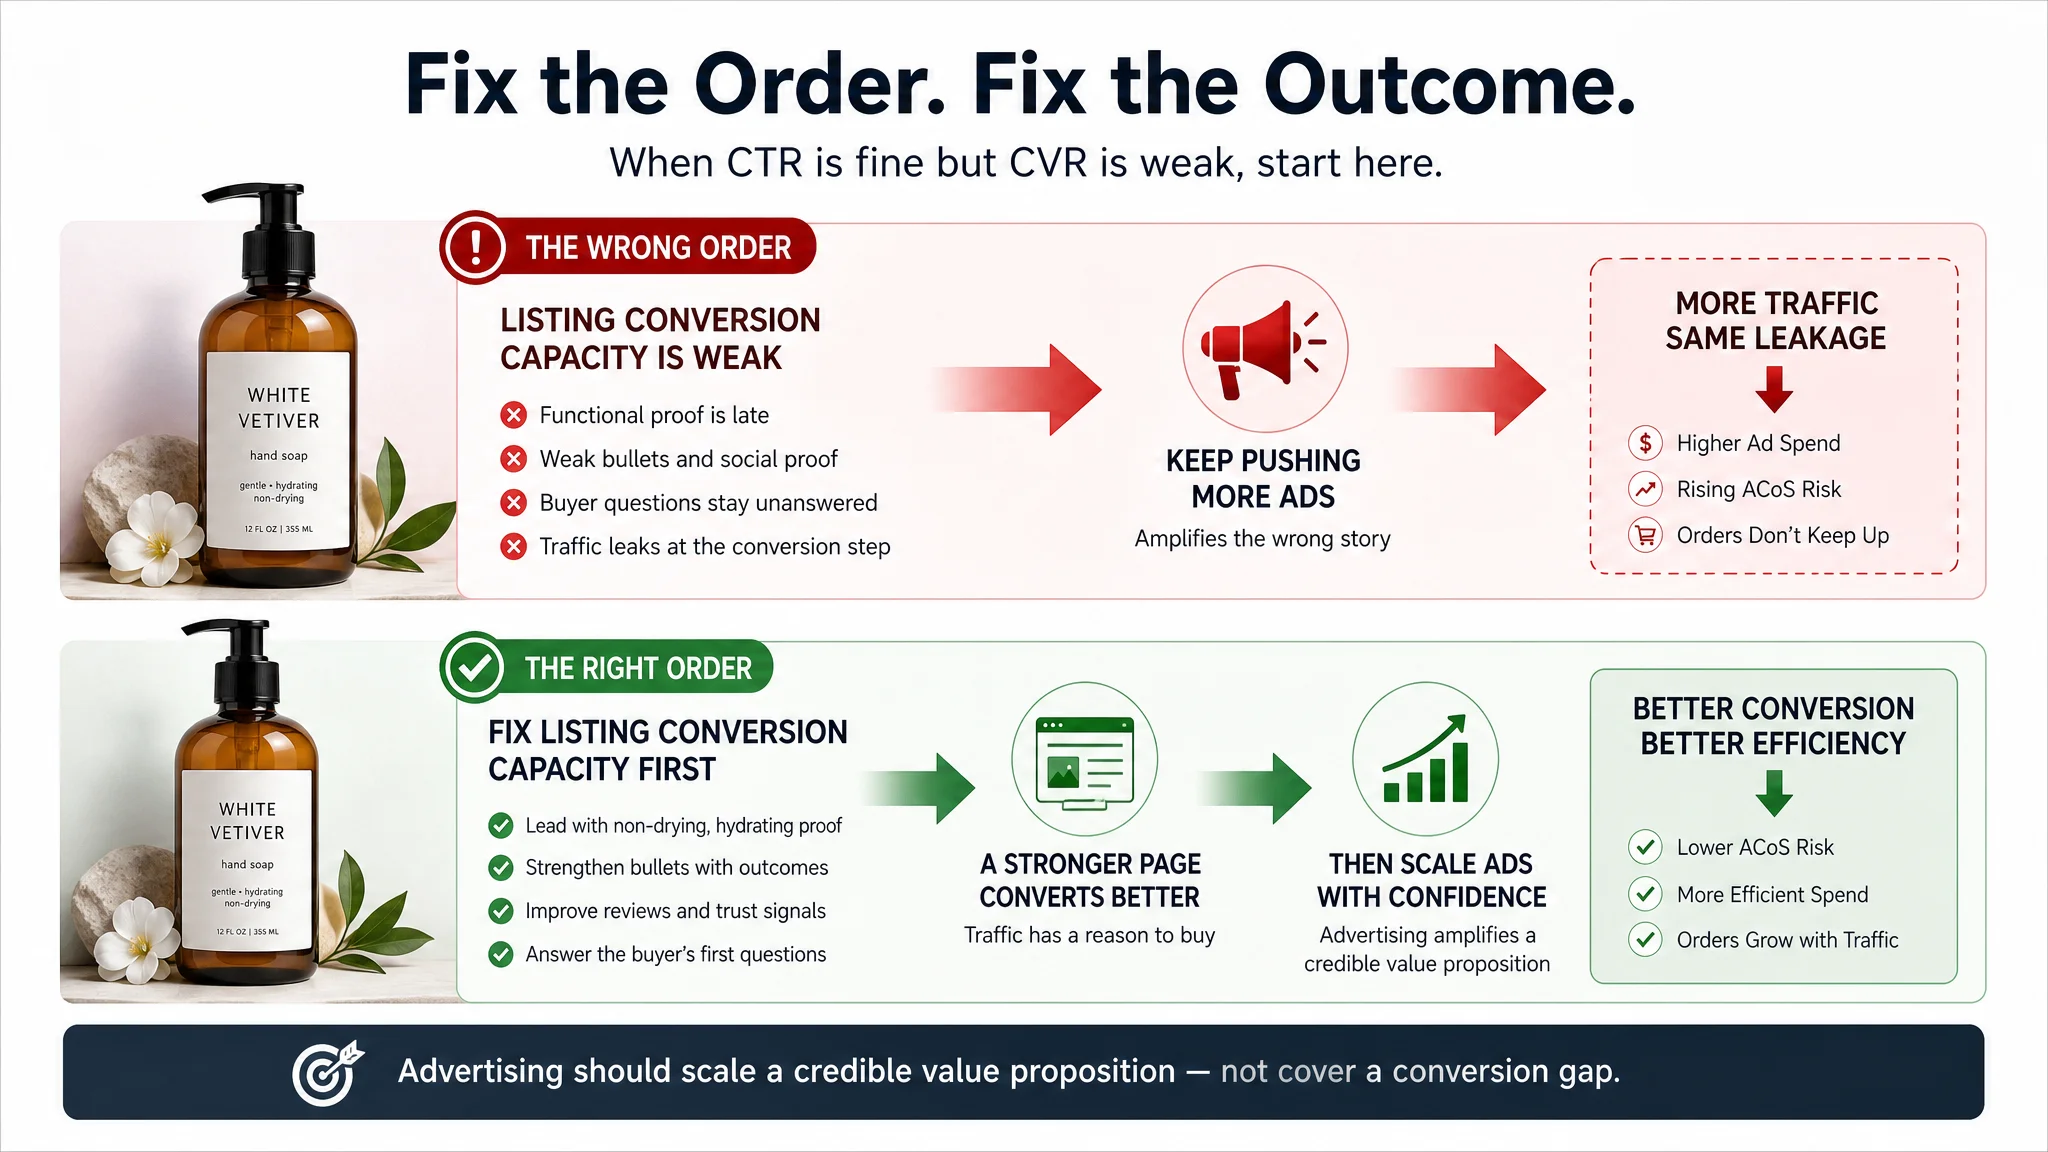
The hand soap listing shows why this sequence matters. The seller’s initial response to difficult ACoS was to expand keyword lists, adjust bids and budgets, and test more lifestyle-oriented ad creatives. Those actions all amplified the same underlying story: luxury, fragrance, and gifting. They did not change the page’s ability to answer whether the product would cleanse without drying the skin.
DeepBI’s diagnosis was not that the ads were incapable of bringing traffic. It was that the page was consuming that traffic. The competitor’s bullets opened with the outcome of soft, smooth hands and connected ingredients such as glycerin and shea butter to care and comfort. The seller’s bullets began with product naming and size, then moved toward scent and packaging. The information was present, but it did not form a buying sequence from concern to formula, outcome, trust, and lifestyle.
That distinction changes the order of operations. When CTR is adequate but CVR remains weak, the seller should examine the listing, price, reviews, and traffic quality before increasing exposure. If the page does not establish functional trust, additional advertising can increase spend without improving the underlying conversion rate. Advertising should scale a credible value proposition, not compensate indefinitely for an unclear one.
Organic Traffic and TACOS: Where Profit Actually Compounds
TACOS, or Total Advertising Cost of Sales, measures advertising spend against total revenue:
TACOS = Advertising spend ÷ Total revenue
ACoS measures the efficiency of paid orders, while TACOS shows how much advertising costs the business as a whole. A campaign can remain within the earlier 15–35% ACoS range and still produce an unattractive TACOS if most revenue depends on paid clicks and the product carries substantial Amazon fees. Those fees already reduce the contribution margin available to absorb advertising costs.
TACOS can fall as organic revenue becomes a larger share of total sales, even when advertising spend does not decline immediately. Organic Amazon sales do not carry a per-click charge. When paid discovery generates relevant traffic, strong CTR, and consistent CVR, the resulting conversion signals can support stronger natural search visibility and BSR. Revenue from that visibility can then grow without requiring ad spend to increase in direct proportion.
Organic share is therefore a profit lever, not merely a traffic metric. The improvement is not created by one image, keyword, or campaign change. It depends on a continuing feedback loop: advertising reports identify high-conversion search terms and product attributes; listing titles, images, and visual emphasis are refined; subsequent CTR, CVR, ACoS, and TACOS results show whether the changes improved commercial performance. Relevance and conversion must remain stable for the organic contribution to compound.
The hand soap case demonstrates why paid and organic performance should be interpreted together. After the listing logic was reframed around non-drying, moisturizing, and trustworthy formula claims, CVR began to stabilize rather than fluctuate with every ad push. ACoS moved in a more controllable direction as paid clicks encountered a page better equipped to convert them. The listing also regained some organic conversion capacity on core hand soap keywords, while traffic became more balanced across branded, categorical, and long-tail terms.
These observations do not establish a universal performance result or justify a specific forecast. They show the mechanism by which paid traffic can become more useful: advertising identifies demand and sends shoppers to the page, while the page converts that demand through clearer functional proof and trust. When the listing improves its ability to convert both paid and organic visitors, TACOS can become more manageable without relying solely on ever-higher bids.
Execution should connect listing work to business reporting. After an image is published, DeepBI automatically tags the event in ad reports, helping sellers compare the visual change with CTR and downstream advertising metrics, so short-term ad lift and longer-term natural rank improvement are reviewed together. The practical question is not simply whether paid sales increased, but whether improved conversion creates more total revenue from the same or more controlled ad investment. That is the path from paid discovery to lower TACOS and stronger Amazon profit economics.
Category and Competitor Gaps: Where a New Seller Can Still Win
Applying competitor_layout_gap to pick your battle
A new seller should not treat the category leader’s BSR as proof that the category is either attractive or winnable. The relevant opportunity is an observable execution gap that can be addressed without exceeding the product’s margin and operational limits. Niche advantages may come from genuine personalization, a specific use case, or a high barrier to entry that discourages casual competition. They do not come from copying a top-ranked ASIN without checking whether the products share the same form, price band, audience, and buying intent.
Use the strategy tag competitor_layout_gap as an execution rule: select comparable products first, then inspect how their listings communicate value. Review top-ranked and high-competitiveness reference ASINs for:
- Weak visual hierarchy or a main image that does not make the product’s purpose immediately clear
- Thin image coverage, limited scene coverage, missing size or parameter graphics, or little diversity in image types
- Shallow bullets whose order, readability, or pain-point coverage does not connect features to buyer problems
- Incomplete A+ content, including limited usage explanation, comparison support, trust credentials, or deeper product education
A qualitative weakness becomes commercially useful only when paired with observable evidence. Low CTR alongside weak main-image focus supports a click-stage diagnosis; low CVR alongside thin A+ content or weak trust signals supports a conversion-stage diagnosis. Add search or category position, impressions, clicks, advertising signals, ACoS or TACoS, and known fee or margin pressure to determine whether the gap matters financially.
The comparison should be multidimensional rather than rank-based. A diagnosis can cover the title, bullets, main image, image set, A+ content, and trust signals, while keeping the benchmark within meaningful product boundaries. DeepBI can merge a diagnostic report with product constraints to produce mapped optimization instructions, while Amazon policy, product consistency, and brand rules define what may be changed. The action is to rank weaknesses by likely CTR, CVR, ACoS, and listing cycle-time impact, then address the most material gap—not to assume a ranking increase or guaranteed profit.
The hand soap comparison makes the idea concrete. The overall Listing score gap was only three points, but the composition was commercially more important than the total:
- Title: 14 versus 15
- Main image set: 26 versus 24
- Bullet points: 4 versus 7
- Detail/A+ content: 21 versus 19
- Reviews: 10 versus 13
The seller was ahead in the main image structure and A+ presentation, yet behind in bullets and reviews. The competitor’s advantage was not simply that its page looked better. It used the available content to make functional claims and trust signals easier to process: formula information appeared earlier, the second image showed product use and visible foam, and the bullets connected ingredients to softness and care.
The seller’s page, by contrast, devoted more attention to fragrance storytelling, packaging, and the wider brand family. Those elements supported a premium position but did not answer the first questions for a product that touches skin repeatedly: whether it would dry the hands, whether the moisturizing claim was credible, and whether the brand could be trusted enough to justify a premium.
A+ sequencing provided another observable gap. The seller’s A+ content showcased hand soap, candles, diffusers, lotion, and other products through a polished lifestyle concept. However, another scent appeared before the White Vetiver hand soap’s formula and use case were fully established, and cross-sell modules appeared before the hero product’s value was secured. The competitor’s design was less elaborate but kept reinforcing the same hand wash and scent family.
This does not mean that lifestyle branding, cross-selling, or premium design are inherently weak. It means they should be evaluated in sequence. For a page with a functional trust gap, the most useful improvements may be to lead with non-drying and moisturizing proof, connect ingredients to outcomes, and establish the hero product before expanding into the broader brand universe. A competitor gap becomes actionable when it identifies the point in the decision path where one page answers a buyer’s concern more efficiently than another.
Amazon vs. TikTok Shop: A 2026 Decision Lens for Sellers
Quick verdict
The better platform depends on how a product creates demand and how reliably that demand converts into profitable orders. TikTok Shop is content-first: reach, creator distribution, and live selling can test whether a novel or trend-driven product attracts attention. Amazon is search-intent-first: shoppers arrive with a defined need, and sellers compete to capture that demand through discoverability, CTR, CVR, fulfillment, advertising, and listing quality.
Supplied TikTok Shop context indicates that LIVE contributes approximately 26% of platform GMV and that conversion is approximately 7.8%. These are bounded platform-level reference points, not universal seller expectations. A seller still needs to test product-market fit, creative execution, affiliate commission, fulfillment cost, and contribution margin.
The decision should therefore start with four questions:
- How much budget can be assigned to content, affiliates, advertising, and fulfillment?
- Can the team consistently produce or source effective video and live-commerce content?
- Is the product novel and impulse-friendly, or does it already have identifiable search demand?
- Does the business need rapid testing, durable listing assets, or a combination of both?
Choose TikTok Shop if…
TikTok Shop may fit a seller with strong content capability, a product that benefits from demonstration, or an offer driven by novelty and trends rather than established search behavior. It can support faster testing of hooks, use cases, and creator-led positioning, although the speed of feedback can come with higher volatility.
The cost structure also needs careful modeling. Performance-based affiliate commissions should be evaluated alongside product cost, shipping, returns, discounts, and any other selling costs. Regional assumptions matter: in the United States, referral plus transaction fees are typically under 10% before affiliate commission. In the UK and EU, referral fees near 9% plus transaction fees of roughly 2–3% can exceed 10%. The UK is an established market, while France, Germany, Italy, Spain, and Australia are newer or ongoing expansion markets in the supplied context.
Choose Amazon if…
Amazon is usually the stronger base when customers already search for the product, when fulfillment economics can be managed, and when the seller wants to build a durable listing asset. Titles, images, bullets, A+ content, reviews, and keyword coverage can compound through repeated improvement.
The operating test is not traffic alone. Track exposure, CTR, orders, CVR, ACoS, TACOS, BSR, and listing cycle time. Comparable-ASIN benchmarking and search-term analysis can connect listing changes to business outcomes. Sellers must still absorb fulfillment and advertising costs, but they retain a clearer path from search intent to repeatable demand capture.
The hand soap case reflects this search-intent logic. The seller did not need to abandon premium fragrance positioning; it needed to place that positioning in the correct order. The revised title retained scent and lifestyle language while bringing formula and cleansing outcomes closer to the center. Bullet points were reorganized around after-wash feel, fragrance profile, ingredient-to-benefit links, trust, and daily use. Images were reordered so functional proof came before more subjective scent storytelling.
The A+ page was also reframed around three steps: validate that the hand soap was premium and credible, prove the formula and experience, and only then expand into other formats or cross-sell. This is the value of a durable listing asset: it can preserve the brand’s distinctive positioning while making the buyer’s first decision easier. Search demand still needs to be captured through keywords and advertising, but the page must convert that demand through a clear decision path.
Consider both if…
A hybrid path can use TikTok Shop to test creative angles, product attributes, and audience reactions, then transfer validated signals into Amazon titles, images, bullets, A+ content, and keyword strategy. Amazon remains the long-term profit base rather than a channel to abandon: content can discover demand, while Amazon can capture search intent and convert it through an improving, durable listing.
Methodology, Corrections, and What These Numbers Do Not Say
Amazon statistics are only useful when their scope is clear. Seller-count estimates and fee figures vary across sources because they may use different populations, regions, seller definitions, or calculation methods. Ranges are therefore used deliberately rather than replaced with false precision. A range helps an operator test whether a decision remains sound across plausible conditions—for example, whether margin survives a higher fee assumption or whether traffic growth is meaningful after accounting for its denominator.
Report-based metrics require the same caution. Keyword-report selection thresholds and report scope may change from month to month, affecting which terms, products, or competitors appear in the output. A keyword position transition should not be treated as a complete market result without checking the report period, selection rules, and comparison scope. The same discipline applies to revenue, traffic, CTR, CVR, ACoS, TACOS, and BSR: the metric’s denominator, period, marketplace, and attribution window matter as much as the headline number.
Tool and vendor claims need a verification record before they are repeated. Record the verification date, plan tier, and billing term for any pricing statement. Do not repeat annual-plan savings claims unless the underlying terms are available and comparable. Unattributed superlatives, self-reported user counts, and trust or credibility metrics should be treated as marketing claims until independently sourced.
Listing diagnostics require the same separation between aggregate scores and underlying evidence. A score of 75/100 versus a competitor’s 78/100 did not explain the hand soap listing’s conversion difficulty by itself. The breakdown showed that the seller was ahead in image structure and A+ organization but behind in bullets and reviews. A qualitative review then showed that the page prioritized fragrance and brand lifestyle while the competitor prioritized formula, softness, and functional trust.
This is why a score should be used as a starting point for investigation rather than as a final business judgment. The relevant question is not whether a page is “close” to a competitor overall. It is whether the page is strong at the specific stage that is limiting performance: search relevance, click generation, functional reassurance, social proof, offer confidence, or conversion.
Where the supplied evidence does not establish a figure or methodology, the responsible conclusion is qualitative: the evidence is insufficient to state it. Estimating a missing seller count, fee total, keyword threshold, price, or performance outcome would create a stronger-looking claim with a weaker decision basis. Corrections should narrow the claim, identify its scope, or present a range—not conceal uncertainty behind an exact number.
FAQ: Amazon Facts and Statistics for Sellers
Does Amazon’s more-than-60% third-party figure represent more than 60% of Amazon’s revenue?
No. The figure measures the share of units sold in Amazon’s store by third-party sellers, not third-party sellers’ share of Amazon’s total company revenue. Revenue analysis must separate marketplace unit volume from Amazon’s retail sales, service revenue, advertising, and other business lines.
How should sellers compare Amazon and TikTok Shop fees?
Use a like-for-like cost model rather than comparing one headline referral rate. Include marketplace fees, fulfillment, PPC, and affiliate commissions, then adjust for regional differences because the applicable charges and commercial structure can vary by market. The relevant seller comparison is total acquisition and fulfillment cost against contribution margin, not the platform fee alone.
Should a new seller start on Amazon or a content platform?
The decision depends on search intent, product type, budget, and content capability. Amazon is more aligned with demand captured through product search, while a content platform may require stronger creative production and audience development; sellers should compare the investment required to generate traffic with expected CTR, CVR, ACoS, and listing cycle time rather than assume one platform is universally better.
Why can a listing with a high score still have weak conversion?
An aggregate Listing score may hide weaknesses in the specific content that controls the buyer’s decision. A page can have polished images and strong A+ design while still underperforming in bullets, reviews, formula proof, or functional reassurance. In one premium hand soap listing, the overall score was close to a competitor’s, but the seller’s bullets and reviews were weaker, while the page emphasized fragrance before answering whether the product would clean gently without drying the hands.
Should sellers fix ads or the listing first when ACoS is high?
Look at the full conversion path. If ads generate relevant impressions and clicks but CVR remains weak, review the listing, offer, price, reviews, and traffic quality before expanding spend. In the hand soap example, the initial diagnosis blamed keywords and bidding, but the deeper issue was that the page did not convert functional concern into confidence. The appropriate sequence was to improve Listing conversion capacity first and then test further advertising changes.
Why do some reports show values above 100% for CTR?
The denominator may be a nonstandard measure, such as clicks or engagement relative to a different traffic base, rather than impressions served. Standard impression-based CTR is calculated from clicks divided by impressions, so sellers must identify the denominator before comparing reports or judging campaign performance.
Were Amazon’s 2025 layoffs the company’s largest ever?
No. The 2025 layoffs were one of Amazon’s largest recent restructuring rounds, but they were smaller than the reduction wave across 2022 and 2023. Calling them the largest ever confuses a major single period with the larger combined scale of the earlier cuts.