Amazon Listing Conversion, Defined Before You Optimize Anything
Amazon listing conversion is best defined as Unit Session Percentage = Units Ordered ÷ Sessions. It measures how often listing sessions become orders, regardless of whether the shopper arrived through advertising or organic search.
Do not confuse this with ad conversion. Ad conversion is calculated from ad clicks, so it evaluates the performance of paid traffic after a shopper engages with the advertisement. Listing conversion evaluates the product detail page across its traffic sources. A weak result may come from the listing, the campaign, or both: low CTR can limit qualified sessions, while weak CVR can indicate that the images, offer, content, or product positioning are failing after the click.
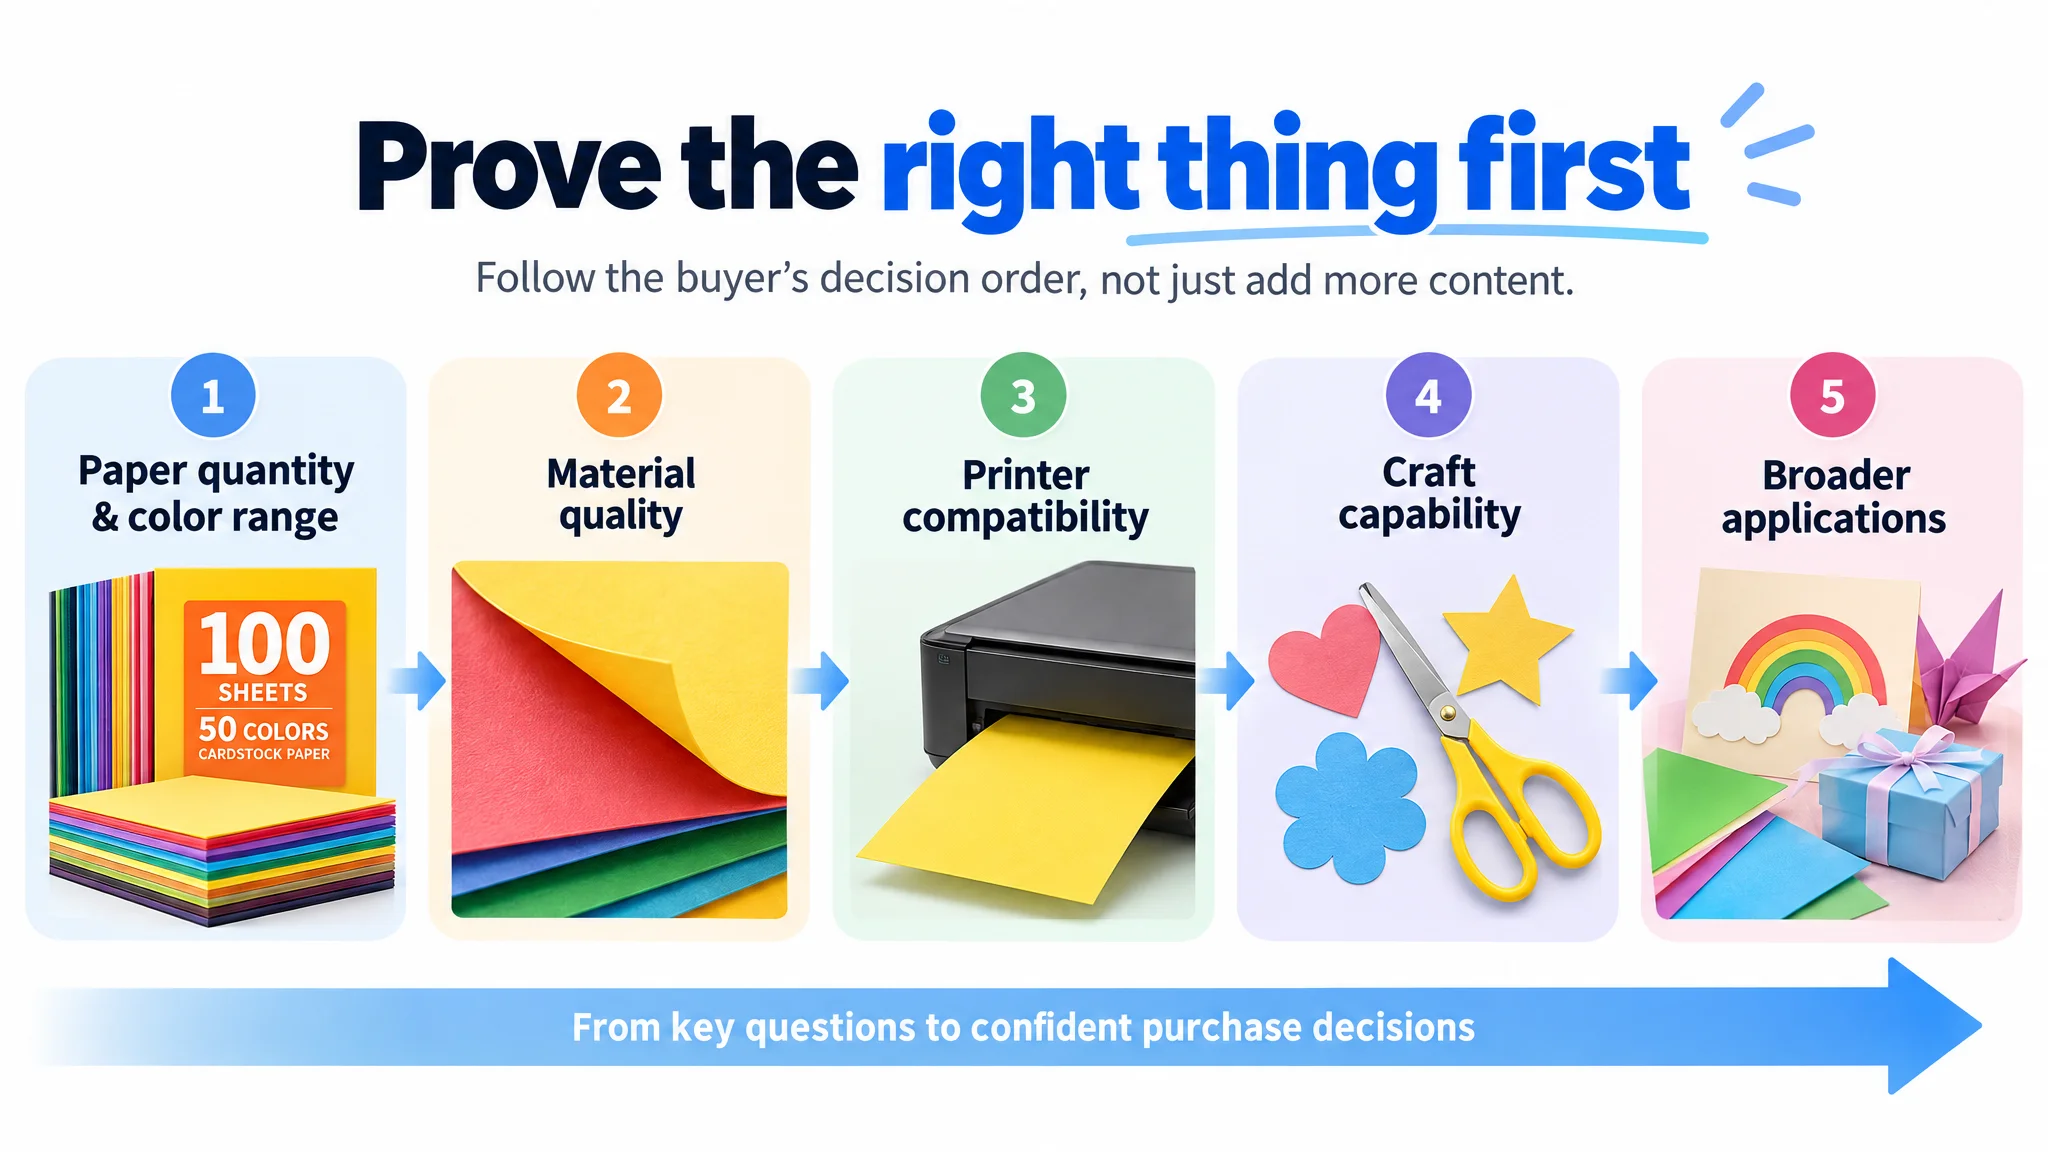
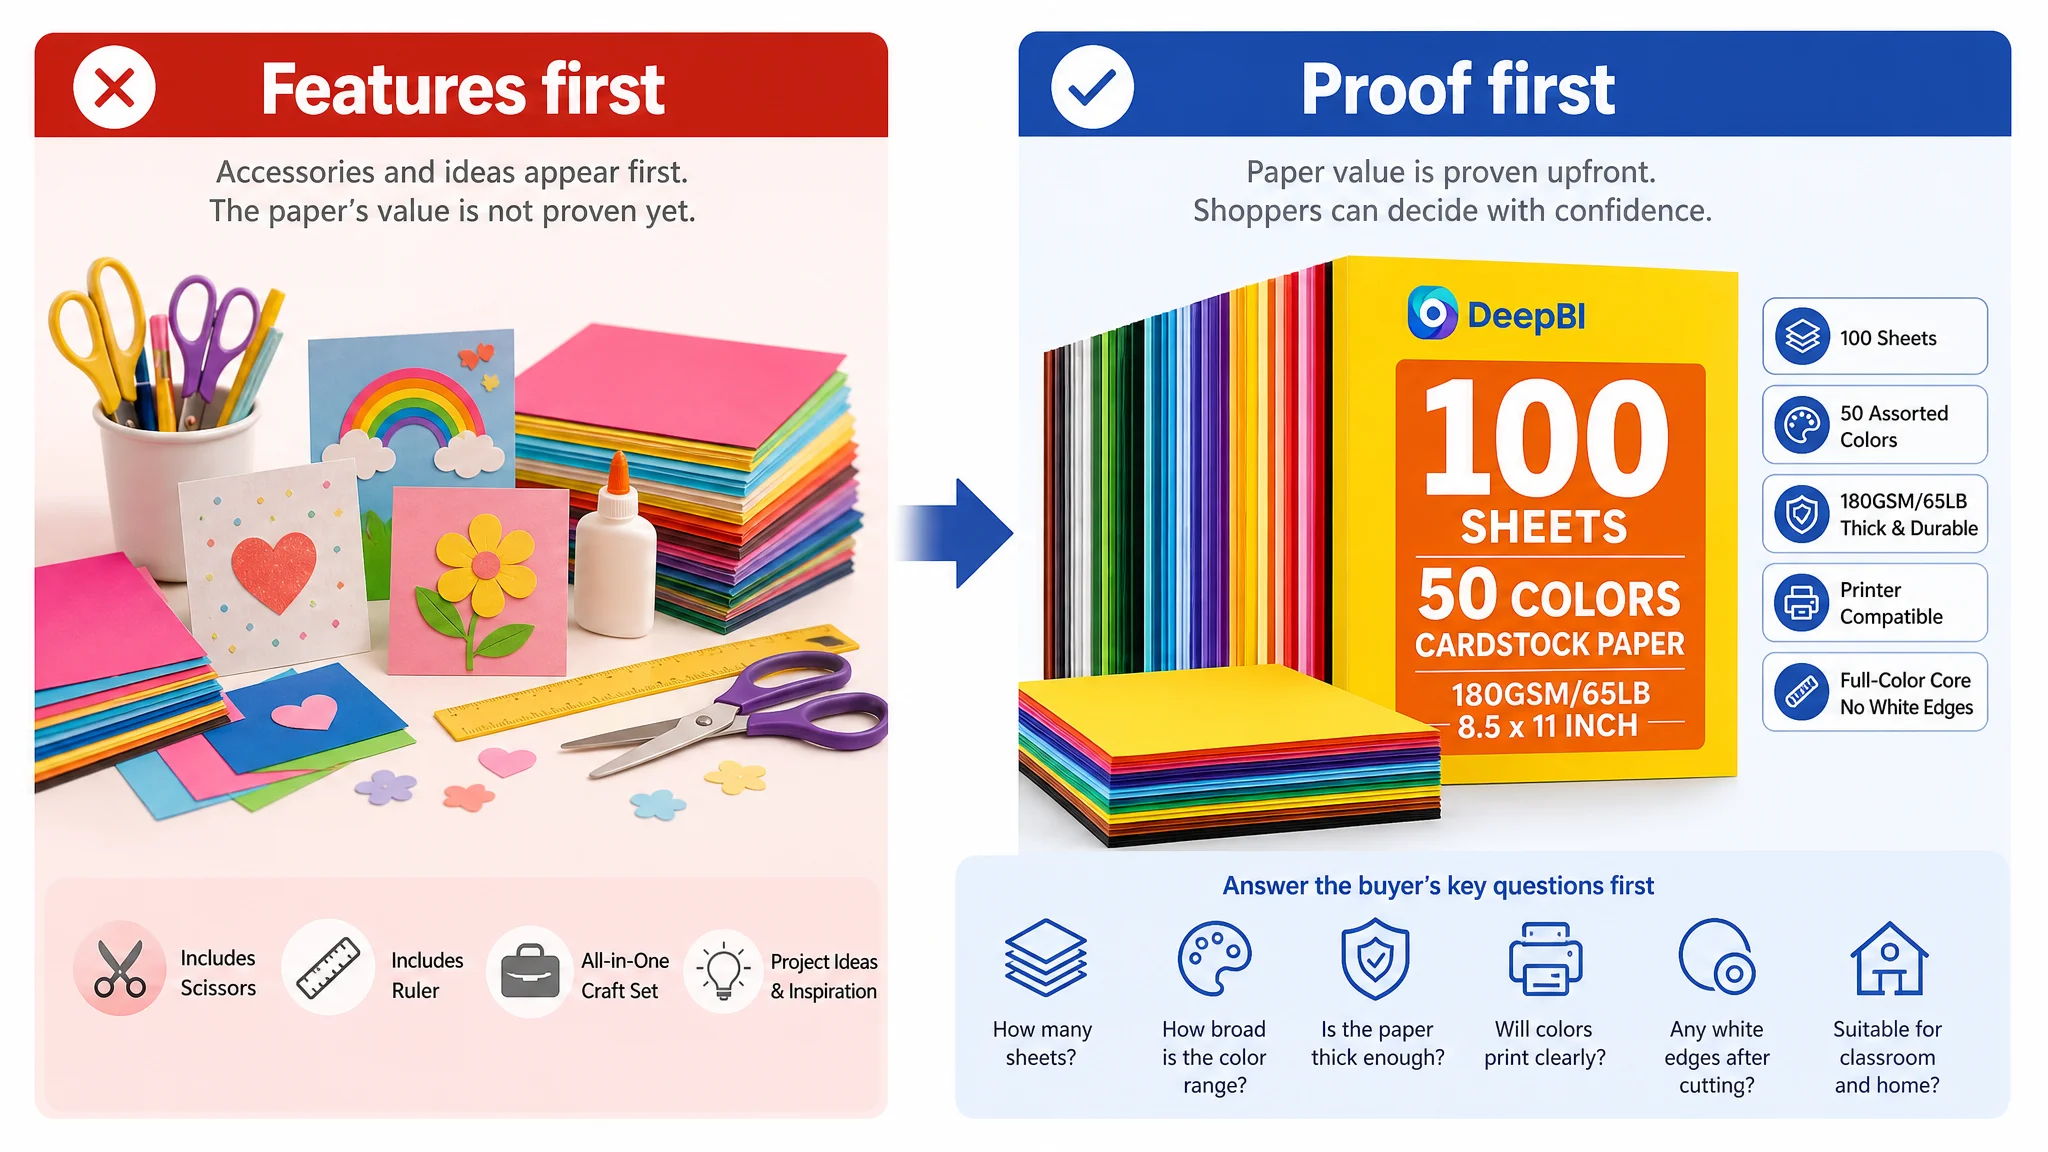
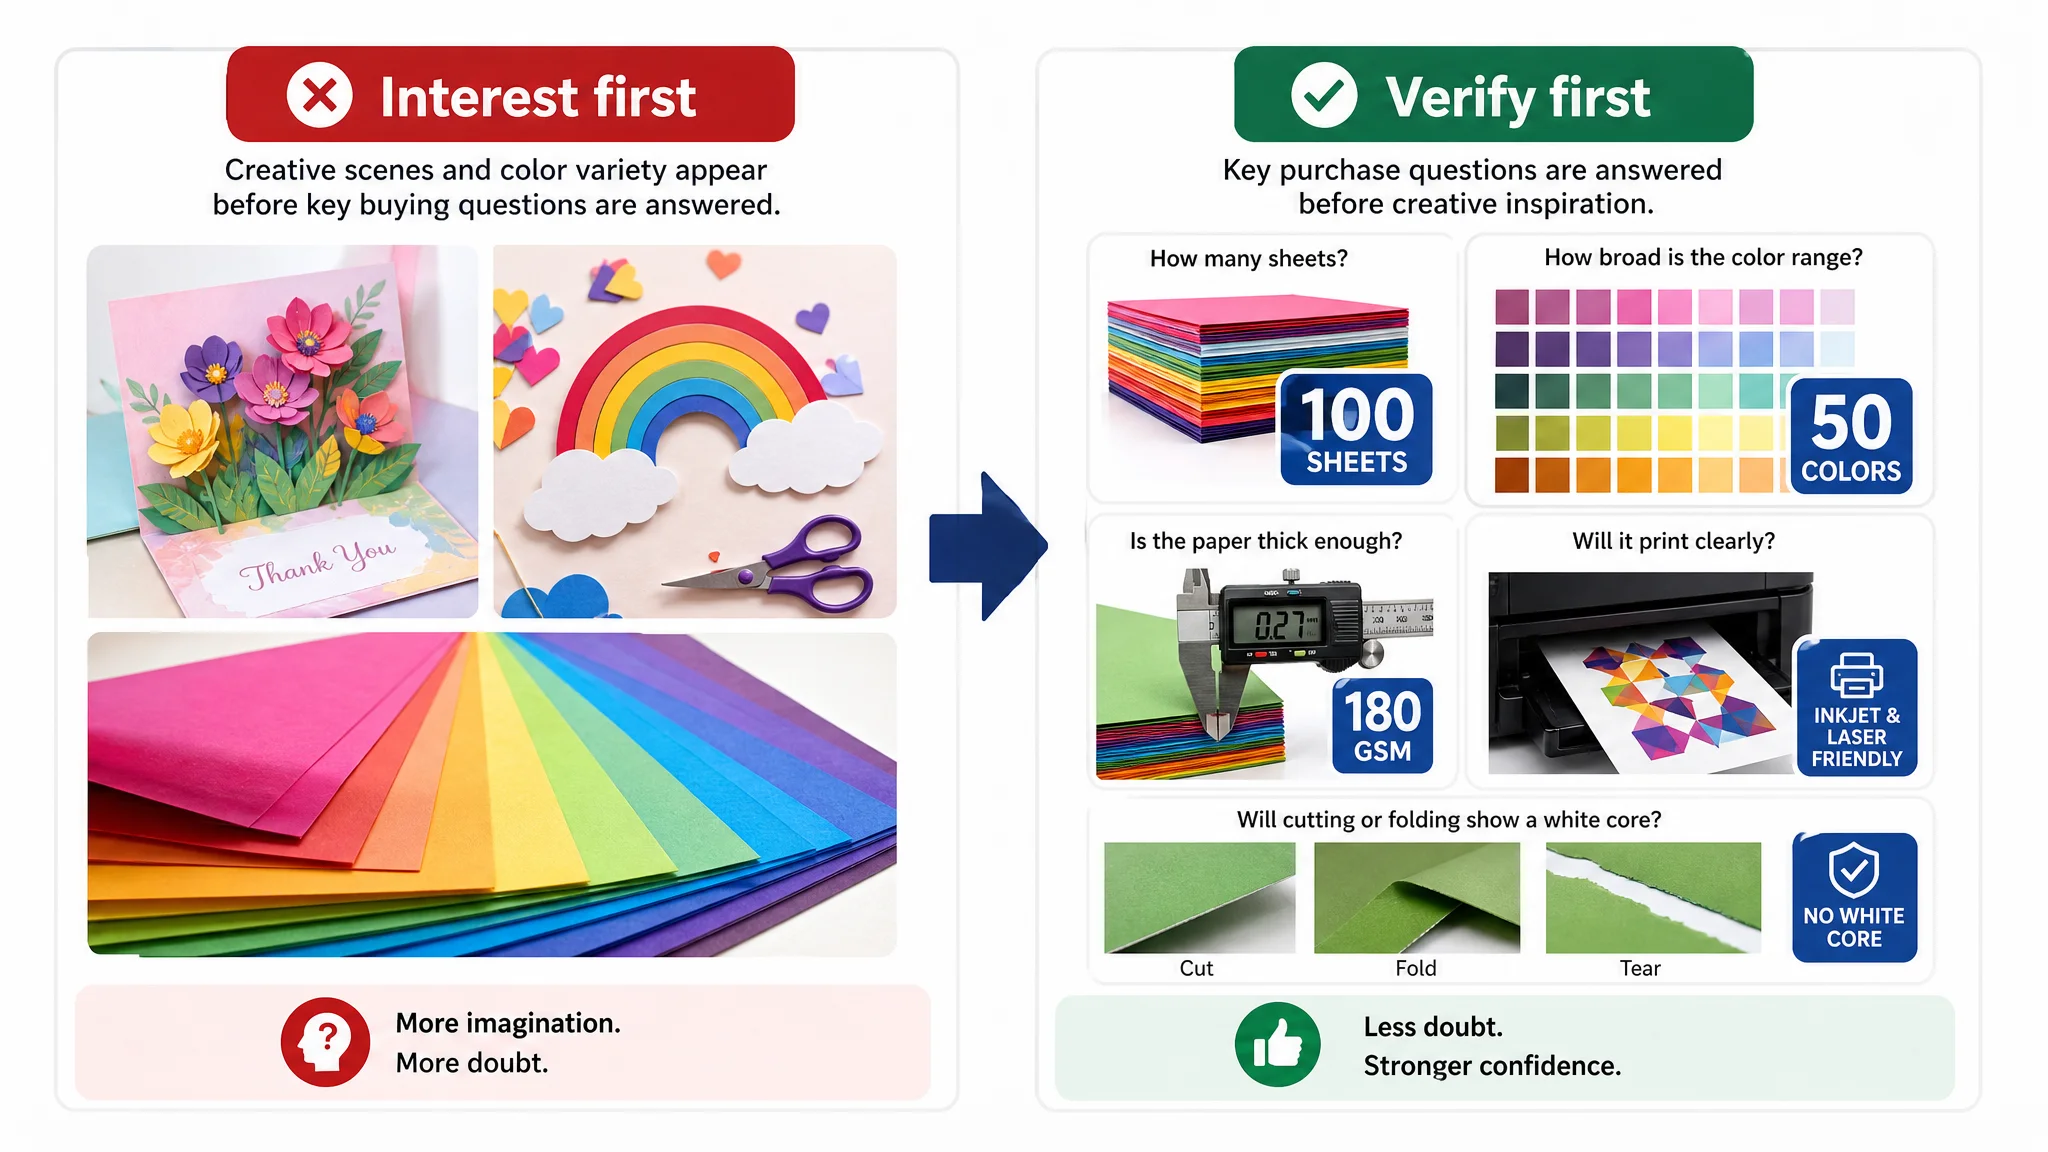
A useful real-world example is a colored cardstock listing that already communicated several tangible selling points: 100 sheets, 50 assorted colors, 180GSM/65LB paper, printer compatibility, and included scissors and a ruler. The page was not empty, and the product had plenty of information to work with. However, the initial direction was to add more product information, emphasize the accessories, and show more crafting scenarios. The deeper diagnosis found that the problem was not a lack of content. It was a lack of priority.
The page was asking shoppers to notice the craft set and creative possibilities before proving the paper’s core value: quantity, color range, weight, printability, durability, and the absence of white edges after cutting or folding. This distinction matters because more content does not automatically improve Unit Session Percentage. The content has to answer the buyer’s most important questions in the right order.
Conversion is also part of the Amazon growth flywheel, not a standalone ranking promise. When a listing converts more effectively, the same advertising budget can produce more orders, potentially lowering ACoS. Stronger sales productivity can support organic velocity and BSR, which may reduce dependence on paid traffic. None of these outcomes is guaranteed, and ranking should not be reduced to one metric or one presumed factor.
Optimization should therefore operate as a feedback loop. Compare CTR, CVR, ACoS, BSR movement, and listing cycle time before and after meaningful changes rather than judging a new image or headline by appearance alone. Benchmark against relevant competitors selected within comparable product, price, audience, and market-validation boundaries. Exclude weak or tiny comparison samples. Systematic benchmarking turns visual judgment into a testable diagnosis and gives each listing revision a measurable business purpose.
The Cost of Watching the Wrong Sellers
A high-ranking brand is not automatically a useful benchmark. If it does not appear for the same search, serve the same use case, sit in a comparable price range, or address a similar buyer, tracking it creates false priorities. Teams can spend weeks collecting screenshots, prices, titles, and image changes from sellers that their actual shoppers never compare.
The result is tracker sprawl: too many rivals, too many fields, and no clear link to a listing-conversion decision. Maintenance becomes difficult, and the tracking process often collapses within weeks. Worse, the wrong benchmark can provoke the wrong response. A competitor’s price move may lead to an unnecessary price-war reaction, even when the products are not competing for the same buyer.
The benchmark should be narrower: rivals a buyer sees on the same screen, at the same time, for the same search. Filter out products that cross major differences in product form, price band, function, or audience. Then connect the shortlist to listing decisions that can affect CTR and CVR.
This relevance test was important in the colored cardstock diagnosis. The listing was compared with a genuinely comparable high-performing listing rather than an arbitrary bestseller. That comparison revealed a total Listing competitiveness score of 71/100 against 87/100 for the benchmark. More importantly, the comparison showed that the gap was concentrated in particular dimensions rather than spread evenly across the page. The title, gallery, and bullets were behind, while the review dimension represented a much larger trust gap.
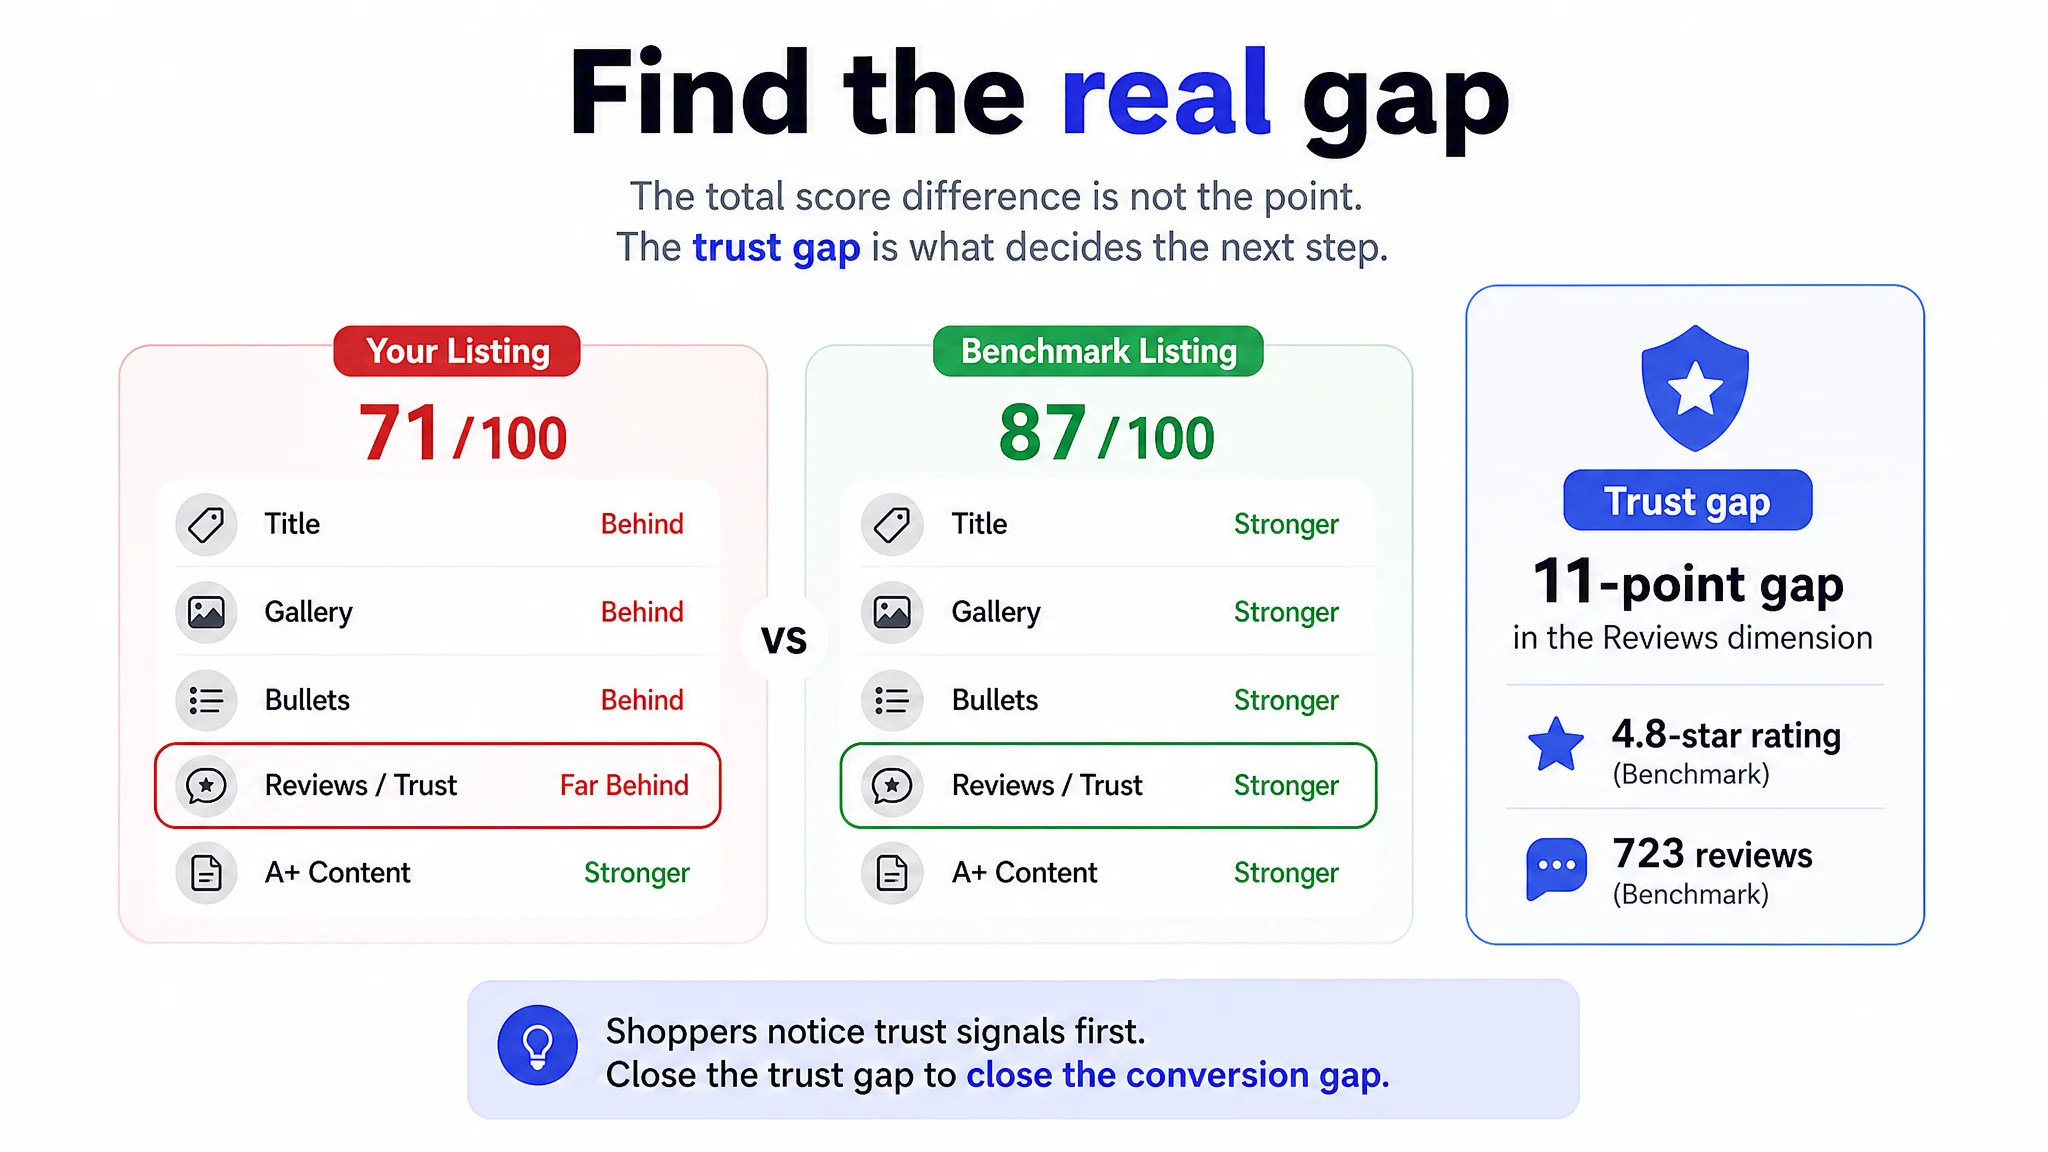
That kind of comparison is more useful than simply copying the most attractive page in the category. It shows where a listing is losing the conversion argument and whether the answer involves content hierarchy, visual proof, product positioning, or a separate trust risk.
Use benchmark scoring to compare the main image, title, bullet points, detail content, and review signals. The score should show not only the overall gap, but where the gap sits. Competitor layout-gap analysis can then translate that difference into a specific action—such as changing information density, image structure, or text logic—without copying a layout the product cannot legitimately support. This replaces the chain of wrong rival, wrong benchmark, and wrong priorities with a focused listing optimization queue.
What a Rival's Listing Actually Tells You
A rival listing shows observable conversion inputs, not the rival’s private performance data. Start with the page itself: assess the main image’s visual clarity, the title’s keyword layout and front-loaded benefit, the order and readability of the bullets, the overall content hierarchy, and the sequence and depth of A+ modules. Then record review volume, rating distribution, recurring complaint patterns, visible price position, and Buy Box and seller context at the time of capture.
Keep facts separate from interpretation. “The first bullet states the primary use case” is an observation. “The structure may reduce shopper uncertainty” is a hypothesis. Neither the page nor its review count proves the rival’s CTR, CVR, demand, sales, or promotion performance. A visible price is a snapshot, not historical pricing evidence; a visible Buy Box state does not reveal past changes or cross-seller inventory movement. Reviews can inform trust and complaint analysis, but they are scoring inputs, not direct conversion evidence or a review-intelligence feature.
The colored cardstock comparison demonstrates why this separation matters. The comparable listing displayed a 4.8-star rating supported by 723 reviews, including detailed image and video feedback, while the customer listing had no valid rating or review count displayed on the homepage. That observation supports the conclusion that the customer listing faced a trust disadvantage. It does not prove that the benchmark’s reviews caused a specific CTR or CVR difference, nor does it establish the rival’s sales volume.
The review gap also had to be treated separately from the content gap. Improving the title, gallery, bullets, and A+ content could make the product’s value easier to understand, but those revisions could not manufacture social proof. When shoppers are already uncertain about paper thickness, color consistency, printability, or durability, the absence of reviews removes one of the normal ways that uncertainty is reduced. A strong teardown therefore distinguishes between a page-structure problem that can be addressed immediately and a trust deficit that represents a separate commercial risk.
Use a consistent teardown score across five dimensions:
- Main image
- Title
- Bullet points
- A+ detail page
- Reviews and trust signals
Tie every score gap to a specific change, such as clarifying the first image, restructuring bullet order, or adding missing comparison and use-case content. Compare only genuinely similar products by form, function, audience, and price band. Finally, treat one capture as a market snapshot, not a trend. Validate any demand or promotion hypothesis against your own CTR, CVR, ACoS, BSR, and other corroborating seller data before acting.
How to Find Your Real Competitors on Amazon
Begin with the exact phrases a buyer would type, not with brand names or the category’s bestseller. Pull likely search terms from your product’s title, bullets, and core use case, then search those phrases in a clean incognito session. This reduces the effect of personalization on the results you observe.
Treat the first page as a candidate set, not a competitor list. Apply a practical filter:
- Same core product form
- Same use scenario and functional logic
- Comparable price band
- Similar target audience
Use the same-screen criterion as a fast relevance test: listings that repeatedly appear on the same visible results screen for the same query are competing for the same immediate buyer attention. Record the exact query, marketplace, and placement context, then repeat the search. If the same products continue to appear, the observation is more reliable and can support later CTR and CVR comparisons.
For a colored cardstock product, the relevant comparison set would need to reflect the same paper form, use scenarios, material expectations, and price position. A general craft kit with a different primary function might share some keywords but still be a poor conversion benchmark. A listing that emphasizes paper quantity, color range, printer compatibility, and classroom or craft use is more useful when diagnosing a cardstock page than a product that competes mainly through unrelated accessories.
Read the Sponsored and Organic Slots Separately
Separate sponsored placements from organic results when reviewing the screen. Do not assume either slot automatically proves stronger product relevance. Instead, note which listings occupy each context and whether the same ASINs recur across repeated searches. This prevents a paid placement from being confused with an organic benchmark.
Check Frequently Bought Together and Comparison Tables
Use Frequently Bought Together and comparison tables as secondary context. They may reveal products Amazon presents alongside yours, but they should not replace the search-based test. Confirm that each candidate matches your product’s form, use case, price range, and audience before adding it to the competitor set. Keep the process tool-light: the query, screen context, repeated observation, and similarity check should remain the evidence base.
Sort Rivals Into Tiers You Can Actually Manage
A competitor list is useful only when you can review it consistently and connect each observation to a listing decision. For a solo seller, roughly ten to fifteen ASINs is a practical working range, not a universal rule. A shorter list that can be maintained weekly is more valuable than a large export that quickly becomes outdated.
Direct Rivals, Substitutes and Aspirational Brands
Assign each ASIN a role before adding it to the watchlist:
- Direct rivals: Match the core product form, use case, price band, and target audience. Use these listings to compare image sequencing, titles, bullets, offers, reviews, CTR-related creative signals, and CVR-relevant content.
- Substitutes: Solve the same customer problem through a different product form or feature logic. These reveal alternative solutions customers may consider when your listing fails to communicate value.
- Aspirational brands: May not be close commercial matches, but provide reference points for visual hierarchy, brand presentation, comparison charts, and A+ content structure.
Do not use bestseller rank alone to define relevance. A leading ASIN can be a poor benchmark if its function, price, or audience differs materially from yours. A focused watchlist helps turn comparison into an evidence chain: identify a gap, select a listing change, and monitor its potential effect on CVR, ACoS, or BSR.
In the cardstock comparison, the benchmark was valuable because it exposed a specific difference in how two similar products presented the buying decision. The customer page treated scissors, a ruler, and broad crafting applications as prominent differentiators. The comparable page made the paper’s core search and decision terms easier to identify. This was not evidence that accessories had no value. It showed that the accessories should support the product’s category identity rather than replace it.
Knowing When to Drop a Seller From the List
Remove an ASIN when it no longer appears for the tracked terms, permanently moves into a different price band, remains out of stock for a sustained period, or shows no meaningful listing change across a full review cycle. Replacing weak benchmarks keeps weekly reviews focused on rivals that still influence customer choice.
The Metrics That Deserve Your Attention
A metric earns attention only when it points to the next listing change. A large tracker can show movement without explaining what to fix, while a smaller decision set connects performance to CTR, CVR, ACoS, and listing cycle time.
Treat price, Buy Box share, and stock movement as market signals, not direct inventory measures. Stock observations may explain traffic or conversion volatility, but they should not be treated as reliable inventory figures. Likewise, BSR movement requires corroboration from review velocity, stock swings, or advertising placement before it supports a diagnosis.
Use review velocity, rating quality, and question-thread activity as demand and satisfaction signals. Interpret rates with three filters: rate quality, statistical confidence, and revenue volume. A high or low rate from a small sample is not automatically a problem.
The cardstock comparison shows why review signals should be examined without allowing them to overwhelm the diagnosis. The customer listing’s lack of a valid homepage rating or review count was a material trust weakness, especially compared with a benchmark showing a 4.8-star rating and 723 reviews. However, that finding did not mean that title, image, or copy work was irrelevant. It meant that content changes and trust limitations needed to be recorded as separate parts of the conversion picture.
Track the elements you can change: listing-quality dimensions, title and bullet structure, A+ content, image strategy, and trust content. Use keyword rank and advertising placement footprint to connect discovery with conversion. Analyze paid traffic beside listing performance; a higher-converting listing can make the same ad spend cheaper by improving CVR and lowering ACoS.
For each important term, compare your ASIN with a genuinely similar benchmark on module order, information hierarchy, image sequence, comparison tables, scene coverage, and parameter visuals. Then convert every gap into one action: redesign the main image, reorder bullets, strengthen A+ content, or clarify a key specification.
Use a multidimensional CTR/CVR diagnostic to rank weak elements by likely impact, and use listing-quality scoring to fund the gap with the clearest business consequence first.
Estimating What a Rival Sells Each Month
Best Sellers Rank (BSR) is useful for reading relative demand, not for converting rank directly into unit sales. Compare genuinely similar ASINs across core search terms, bottom-level category, product form, use case, price band, and audience. Then track whether a rival’s BSR is consistently strong or only moves briefly. A single rank observation, or rank movement without another signal, is not a demand estimate.
Use a second method to test the reading. One practical approach is a keyword-demand model: identify the rival’s main terms, estimate the traffic available for those terms, and apply a conservative CVR range drawn from your own comparable listing or a verified category benchmark. Where available, cross-check that result against marketplace research data or observed order signals from a reliable external source. The purpose is not to produce a precise total. It is to build a defensible evidence chain.
Report the outcome as a range, such as a lower, expected, and upper planning band. If the BSR reading suggests stronger demand than the independent method, plan against the lower band and make the gap explicit. Do not treat cart quantity as inventory; purchase caps can create a false ceiling and do not establish monthly sales.
The estimate should end in a listing decision: which volume band must the ASIN compete for, how large a review moat must it overcome, and how deep its image, video, comparison, and copy content must be before further development is justified.
The cardstock diagnosis illustrates why this final question should not be reduced to a score or a presumed sales number. The available evidence established a 71/100 competitiveness score against 87/100 for a comparable listing, along with identifiable differences in reviews, gallery structure, title focus, and content sequence. It did not establish the rival’s monthly sales or prove a specific performance outcome. The responsible next step was therefore to convert the observed gaps into listing decisions rather than claim an unsupported demand estimate.
Turning Rival Findings Into On-Page Conversion Changes
Use competitor findings to create a prioritized brief tied to CTR, CVR, ACoS, and listing cycle time—not a collection of observations.
- Structure the title around the brand, primary keyword, decisive feature, use case, and key specification, while removing redundant modifiers and avoiding keyword stuffing.
- Treat 150–180 characters as a readability guideline within the category’s permitted limit, not as a ranking cause; front-load decisive information because mobile results may truncate titles earlier.
- Write each bullet with a feature-to-benefit-to-proof sequence: name the selling point, connect it to a shopper concern, then provide a confirmed specification or factual support.
- Replace feature-only copy such as “20-ounce capacity” with a grounded pattern such as: “Compact 20-Ounce Capacity — Holds a practical daily portion, with the stated capacity supporting routine use without adding unnecessary bulk.” Do not add unsupported performance claims.
- Tally recurring complaint phrasing across several well-matched rivals, then separate the findings into a copy brief for messaging gaps and a design brief for image or visual communication gaps.
- Keep every recommendation tied to the product’s confirmed attributes and physical constraints; competitor strengths can identify a gap, but they cannot justify inventing functions, materials, sizes, or results.
- Place backend search terms within Amazon’s 250-byte limit, counting bytes rather than characters, and use relevant terms rather than repeating visible-title language indiscriminately.
- Apply the workflow in order: diagnose the competitor and product gap, generate an ordered strategy, then generate copy from the product profile into an execution checklist.
- Use DeepBI for diagnosis, prioritized strategy generation, and product-profile-based copy generation; treat its output as an evidence-led brief, not a guarantee of higher CVR or a variation-testing capability.
The colored cardstock listing provides a clear example of why ordering matters. Its title included relevant use cases such as scrapbooking, card making, DIY crafts, and decorations, but the craft-set concept and included scissors and ruler interrupted the primary product phrase. A more focused direction would establish the paper first—100 sheets, 50 assorted colors, 180GSM/65LB colored cardstock, printer compatibility, and core use cases—before presenting the accessories as a supporting differentiator.
The same principle applied to the bullets. The customer’s bullets covered the right general territory, but the first bullet began with the set contents while the benchmark began with color variety. The paper specifications were present, yet they were not fully connected to practical outcomes such as dependable handling, print suitability, and the appearance of cut or folded edges.
A stronger sequence would be:
1. Establish the color range and quantity.
2. Connect paper weight and material characteristics to practical use.
3. Explain the solid-dyed core as a visible finished-result benefit.
4. Present printer compatibility as a decision-relevant reassurance.
5. Introduce scissors and the ruler as convenience features.
6. Describe applications through the projects and outcomes the paper can support.
This is the difference between listing what a product contains and explaining why each characteristic matters. The recommendation is not to add unsupported performance claims. It is to give confirmed product attributes a clearer role in the buyer’s decision path.
Visual Assets and A+ Content: The Conversion Layer
Visual assets determine how quickly shoppers understand the offer and how confidently they move toward purchase. The main image earns the click; secondary images and A+ content resolve doubts about function, fit, quality, and risk. When a competitor makes a core parameter visible, shows credible proof, or explains a use case clearly, a weaker information hierarchy can suppress both CTR and CVR.
The cardstock gallery showed why visual sequence matters. It contained useful assets and attractive craft scenes, but the quality message about thick, sturdy paper with a solid-dyed core and no white edges appeared too late. Creative project imagery created interest before the page had fully proved color range, paper robustness, and print suitability.
The issue was not that lifestyle imagery had no value. It was that the images were performing the wrong job at the wrong time. A craft scene can show possibility, but it does not directly answer whether the paper will hold its shape, print clearly, or avoid white edges after cutting and folding. Those practical doubts should be addressed before the shopper is asked to imagine more advanced projects.
Use the competitor layout as a design brief. Within Amazon’s seven-module A+ cap, prioritize the strongest three to five modules, typically covering:
- The primary benefit and supporting facts
- A shopper pain point and its resolution
- Functional or parameter comparisons
- Trust or authority proof
- Usage guidance where decision friction remains
For a paper product, a stronger proof sequence could be:
1. Establish the quantity, color count, dimensions, weight, and included tools.
2. Show the complete color range in a systematic format.
3. Prove the 180GSM weight, sturdy feel, and no-white-core construction.
4. Reintroduce the all-in-one craft-set convenience.
5. Demonstrate printing and broader project applications.
Connect each attribute to a customer problem and outcome instead of repeating specifications. An AI assistant can help map competitor gaps to value-focused messages, generate coordinated image-and-copy options, and compare alternatives, but it cannot guarantee a recommendation or conversion result.
A color gradient may suggest variety, but a structured color grid or swatch matrix makes all 50 colors easier to verify. A general crafting scene may suggest versatility, but a close-up of a folded, cut, punched, or torn edge can communicate the solid-dyed core more directly. These assets are not necessarily more decorative; they are more closely tied to specific decision questions.
Validate every asset against the current Amazon requirements for its specific module, including pixel dimensions and file-size limits. Incorrect dimensions can produce cropping, scaling, or letterboxing; DPI does not govern on-screen image quality. Preview the front end before applying changes. DeepBI can compare old and proposed assets side by side and use SP-API application to replace selected images, closing the analysis-to-publish loop.
Treat A+ as a conversion lever, not a universal lift. Results vary by category, price point, and execution quality. Calculate ROI from your inputs: incremental orders × contribution profit per order − production cost, divided by production cost. Set your own sample size and observation period, then review CTR, CVR, ACoS, and BSR; a 7–14 day view is an observation example, not a testing rule.
The cardstock A+ content scored 21/25, slightly above the comparable listing’s 20/25. That matters because it shows that the strongest-performing dimension is not always the first one that needs attention. The page contained real user-operation imagery, finished craft photographs, application labels, and demonstrations of complex handmade results. Yet its earlier modules still focused on general crafting and included tools before fully validating the paper specifications.
The appropriate response was not to discard the strongest material. It was to change the role and order of each module:
- Verify 100 sheets and 50 colors.
- Prove 180GSM construction and no-white-core quality.
- Show the full palette systematically.
- Explain inkjet and laser printer compatibility.
- Connect the paper to classroom and educational use.
- Demonstrate complex folded and cut results.
- Provide printing and handling guidance where technical hesitation remains.
A strong A+ page cannot fully compensate for weak early proof. Buyers often form their first judgment through the title, main image, gallery, and bullets before reaching the deepest content modules. The page therefore needs to make the paper the subject again before using accessories and craft scenes to expand the offer.
Keeping an Eye on Prices Without Losing Margin
Price monitoring should focus on the ASINs that matter most to revenue, inventory exposure, and competitive positioning. Set alerts only for strategically important products; tracking every rival move creates noise and encourages reactive decisions. A competitor is also a valid benchmark only when the products are reasonably comparable in form, audience, and price band. Otherwise, the comparison can distort both pricing and listing diagnosis.
Treat a rival’s price cut as a signal, not an automatic instruction. Match it only when the reduction persists beyond a stated period and your own conversion has visibly declined. Before the season begins, document a floor price that protects the required margin. That boundary should be agreed before pressure arrives, not improvised during a sales drop.
If your offer is priced above a relevant benchmark and the listing also lags in images, content, or trust signals, improve the listing experience before sacrificing margin. A weak CVR may indicate that traffic is not being converted effectively, rather than proving that price is the only problem. Any optimization detached from meaningful market benchmarks wastes resources.
The cardstock diagnosis is a useful warning against treating every conversion concern as a pricing problem. The listing faced clear gaps in title focus, gallery sequence, and review visibility, while its A+ content was comparatively strong. The available material did not establish that price was the root cause, and it did not provide post-change CVR or sales results. The defensible conclusion was that the page needed stronger proof and a clearer hierarchy before price changes could be evaluated fairly.
The final decision is a listing-conversion decision: define the price position the listing should hold, then evaluate its effect through Unit Session Percentage and units ordered. If a price change increases units ordered without improving conversion, it did not fix the listing; the underlying content or trust gap still requires attention.
Building a Monitoring Rhythm You Will Stick To
Listing optimization fails when every review becomes an emergency. Use two monitoring levels: a weekly light check for operating signals and a quarterly deep dive for structural decisions.
Each week, log:
- Price and stock status
- BSR and review velocity
- Sessions, units ordered, and Unit Session Percentage
- CTR, CVR, and ACoS from advertising
The weekly review should identify changes that require fast correction, such as a price gap, weakening conversion, inventory risk, or a sudden shift in competitor momentum. During the live festive-sales window, increase the check frequency. Price cuts, new entrants, and review-velocity spikes can develop within days, leaving a weekly review too slow.
The quarterly deep dive should examine longer patterns: whether listing changes altered CTR or CVR, which competitors consistently set the market standard, whether review growth and BSR movement support the current positioning, and which content gaps still affect conversion. Compare before-and-after performance rather than relying on impressions.
A structured review also prevents teams from reacting to a single overall score. In the cardstock comparison, the 71/100 result could have led to a broad “make everything better” response. The dimension breakdown created a more useful monitoring queue: a 16-point total difference, a 2-point title gap, a 3-point gallery gap, a 1-point bullet gap, a comparatively stronger A+ dimension, and an 11-point review gap. Each of those observations implied a different action or limitation.
Search conditions also require active re-auditing. Treat A10-era relevance and semantic or AI-assisted discovery surfaces as live operating context. After search-surface changes, review the wording again: copy that clearly answers one discovery surface may appear noisy or overly repetitive in another.
Advertising data should guide organic reinforcement. Prioritize keywords showing high CTR, high CVR, and high order value, then assess whether they deserve stronger placement in the listing. Track paid and organic performance together; stronger listing conversion can help paid traffic generate more orders and potentially support organic rank, but no ranking outcome is guaranteed.
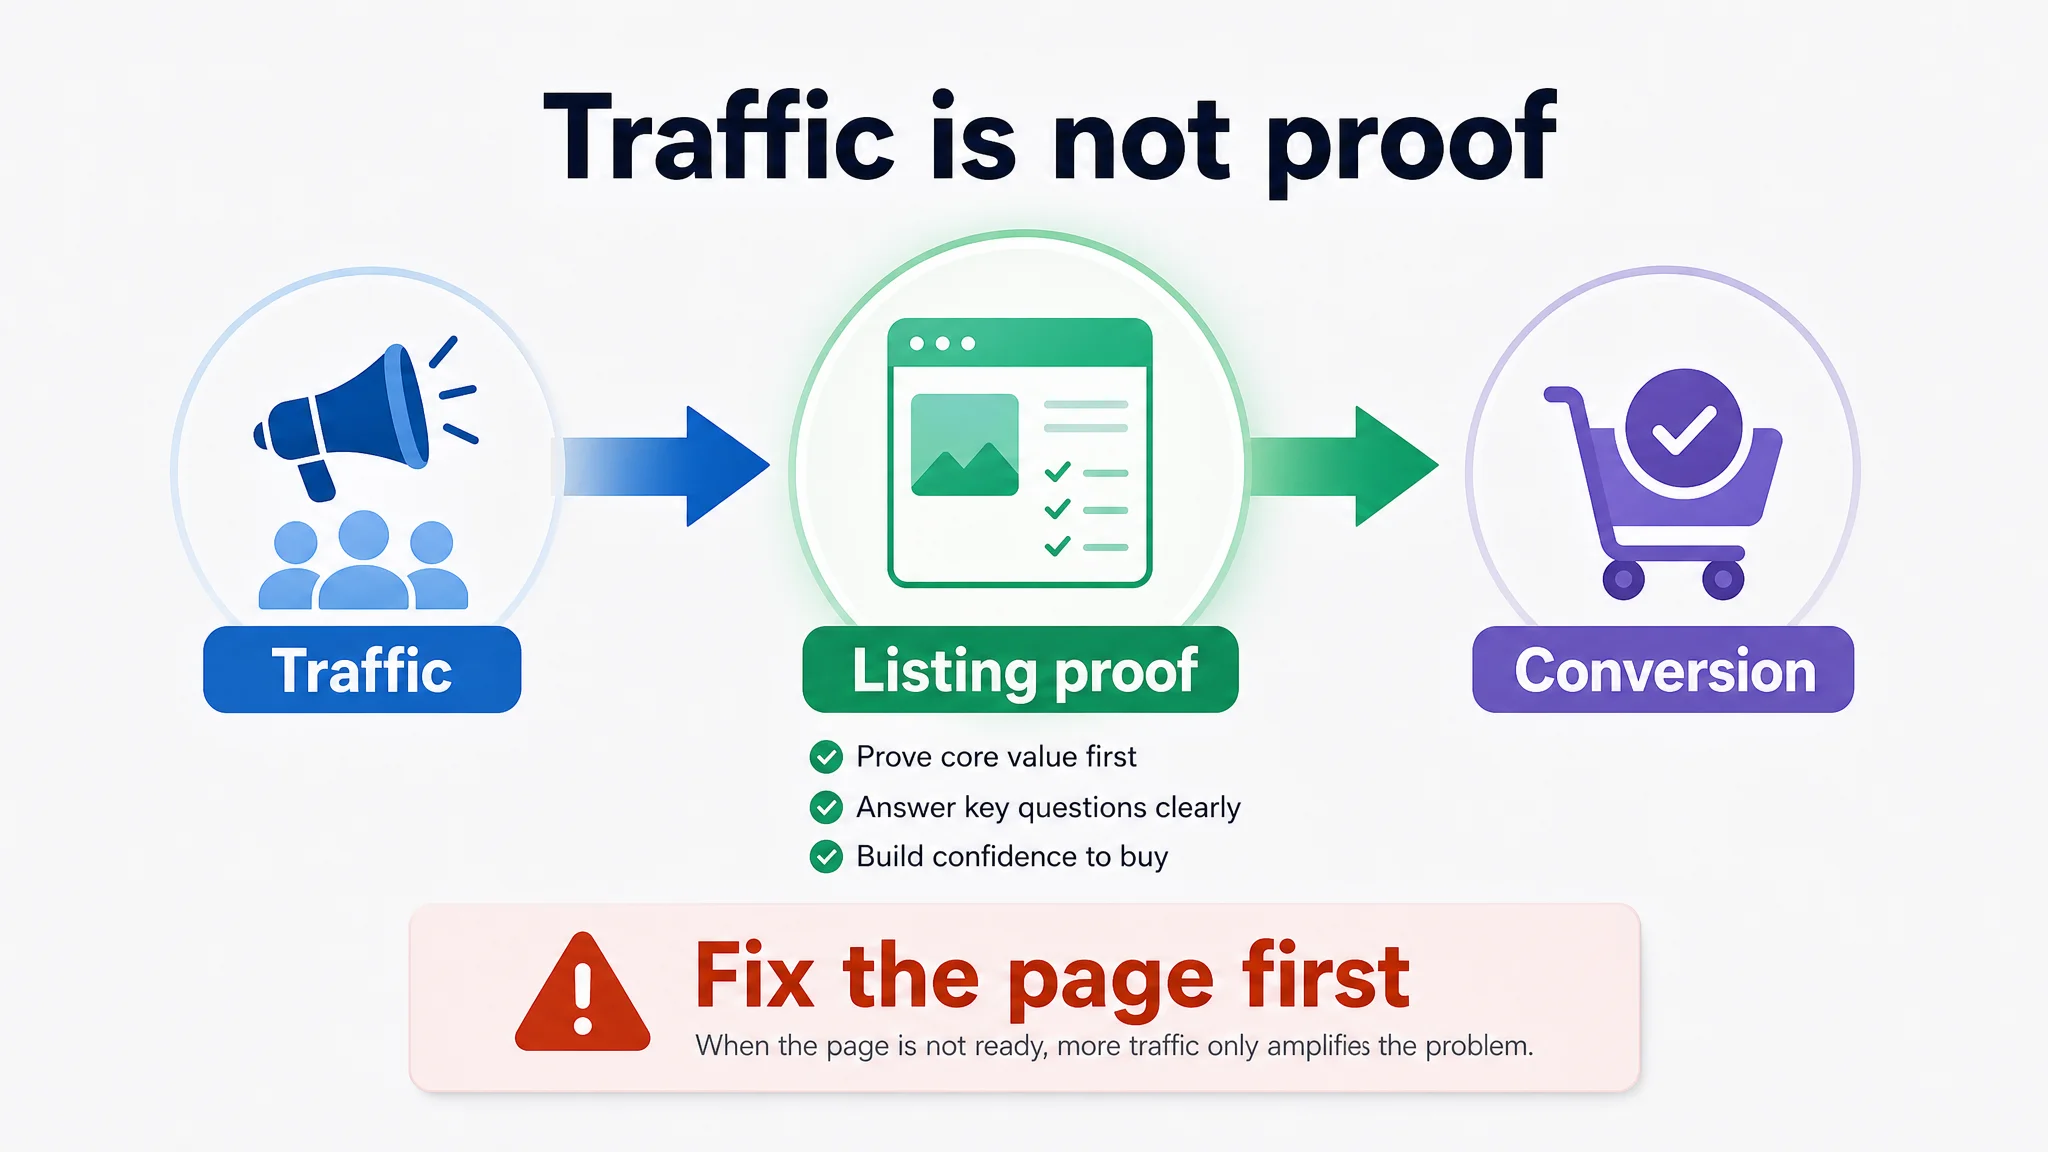
Do not use advertising optimization to avoid diagnosing the product page. In the cardstock case, the available material did not provide post-optimization CTR, CVR, ACoS, TACoS, or organic-order recovery. Therefore, it would be misleading to claim that the listing changes improved ad efficiency or sales. What the diagnosis established was the correct order of operations: determine whether the page can explain and prove the product’s core value, repair the content hierarchy, recognize the review gap as a separate trust risk, and only then evaluate additional traffic.
Frequently Asked Questions
How do I find my real Amazon competitors?
Start with your product’s core search terms, then inspect the relevant subcategory and search results. Select ASINs with the same product form, use case, function, target audience, and comparable price range. Do not use a single Bestseller as your only benchmark. A product with a different audience, price band, or function can create a misleading comparison. Also preserve product-entity consistency: competitor references can guide presentation, but they cannot justify changing your product’s inherent attributes.
Which metrics matter most when optimizing listing conversion?
Read the funnel in sequence: impressions, clicks, orders, CTR, and CVR. Low CTR usually directs attention to the main image, title, and click appeal. Low CVR points to weaknesses in detail-page information, trust, reviews, pricing, or product-value communication. Track BSR and ACoS as supporting business signals, but connect every listing change to its likely effect on CTR or CVR rather than judging it by appearance alone.
A listing can also show a mixed diagnosis. The cardstock page had meaningful product information and comparatively strong A+ content, but weaker early-page prioritization and a substantial review gap. That combination could not be reduced to one metric or solved by adding more features. The useful question was which buyer uncertainty each page element was supposed to remove.
How can I estimate a rival’s monthly sales honestly?
Treat monthly sales as an estimate or range, never as a confirmed number. Combine observable signals such as BSR or category position, recurring search visibility, review volume, price, and stock status. No single public signal reliably converts into exact monthly sales, so record the evidence and state the uncertainty.
How often should I repeat competitor research and optimization?
Run the manual observation cycle weekly. Use Amazon’s search-term reporting to identify top-converting terms, search them in an incognito window, and log recurring ASINs, prices, BSR, and stock status on one sheet. Optimize when recurring gaps appear, then review the next weekly cycle for continued evidence.
Can I conduct useful competitor research without paid tools?
Yes. A disciplined manual process can identify comparable products, market signals, and listing gaps. Paid tools mainly accelerate the same loop; they do not replace the need to verify similarity, interpret CTR and CVR, or protect product accuracy.
Conclusion
Higher conversion is the Amazon listing metric that compounds. When a listing turns more qualified sessions into orders, it can support stronger organic velocity and make the same advertising spend work harder, although the result still depends on traffic quality, price, stock, and market conditions.
Treat listing optimization as an operating system, not a one-time project. Find rivals that share your search results, audience, use case, and price position. Read their listings as evidence without assuming you know their internal CVR or sales volume. Then connect the data to one action: a main image change when CTR is weak, a title or bullet revision when relevance is unclear, or stronger proof and information hierarchy when CVR is weak. Hold a defensible price, protect product truth, and repeat the review on a defined rhythm.
The colored cardstock diagnosis shows why this process must focus on decision order rather than content volume. The product page had 100 sheets in 50 colors, printer compatibility, 180GSM/65LB paper, included tools, and many craft applications. Yet shoppers were being asked to notice the accessory bundle and creative possibilities before receiving clear proof of the paper’s quantity, color range, durability, print suitability, and no-white-core construction.
The page did not need to say everything first. It needed to prove the right thing first.
Do not respond to every competitor movement. Use each cycle to separate a real listing gap from a temporary market signal, then measure the effect through CTR, CVR, ACoS, BSR, or listing cycle time.
This week, choose one metric, one rival set, and one listing change to ship. Record the baseline, publish the change, and use the next data review to decide what deserves attention next.