


Judge Campaigns by Profit, Not by ACOS
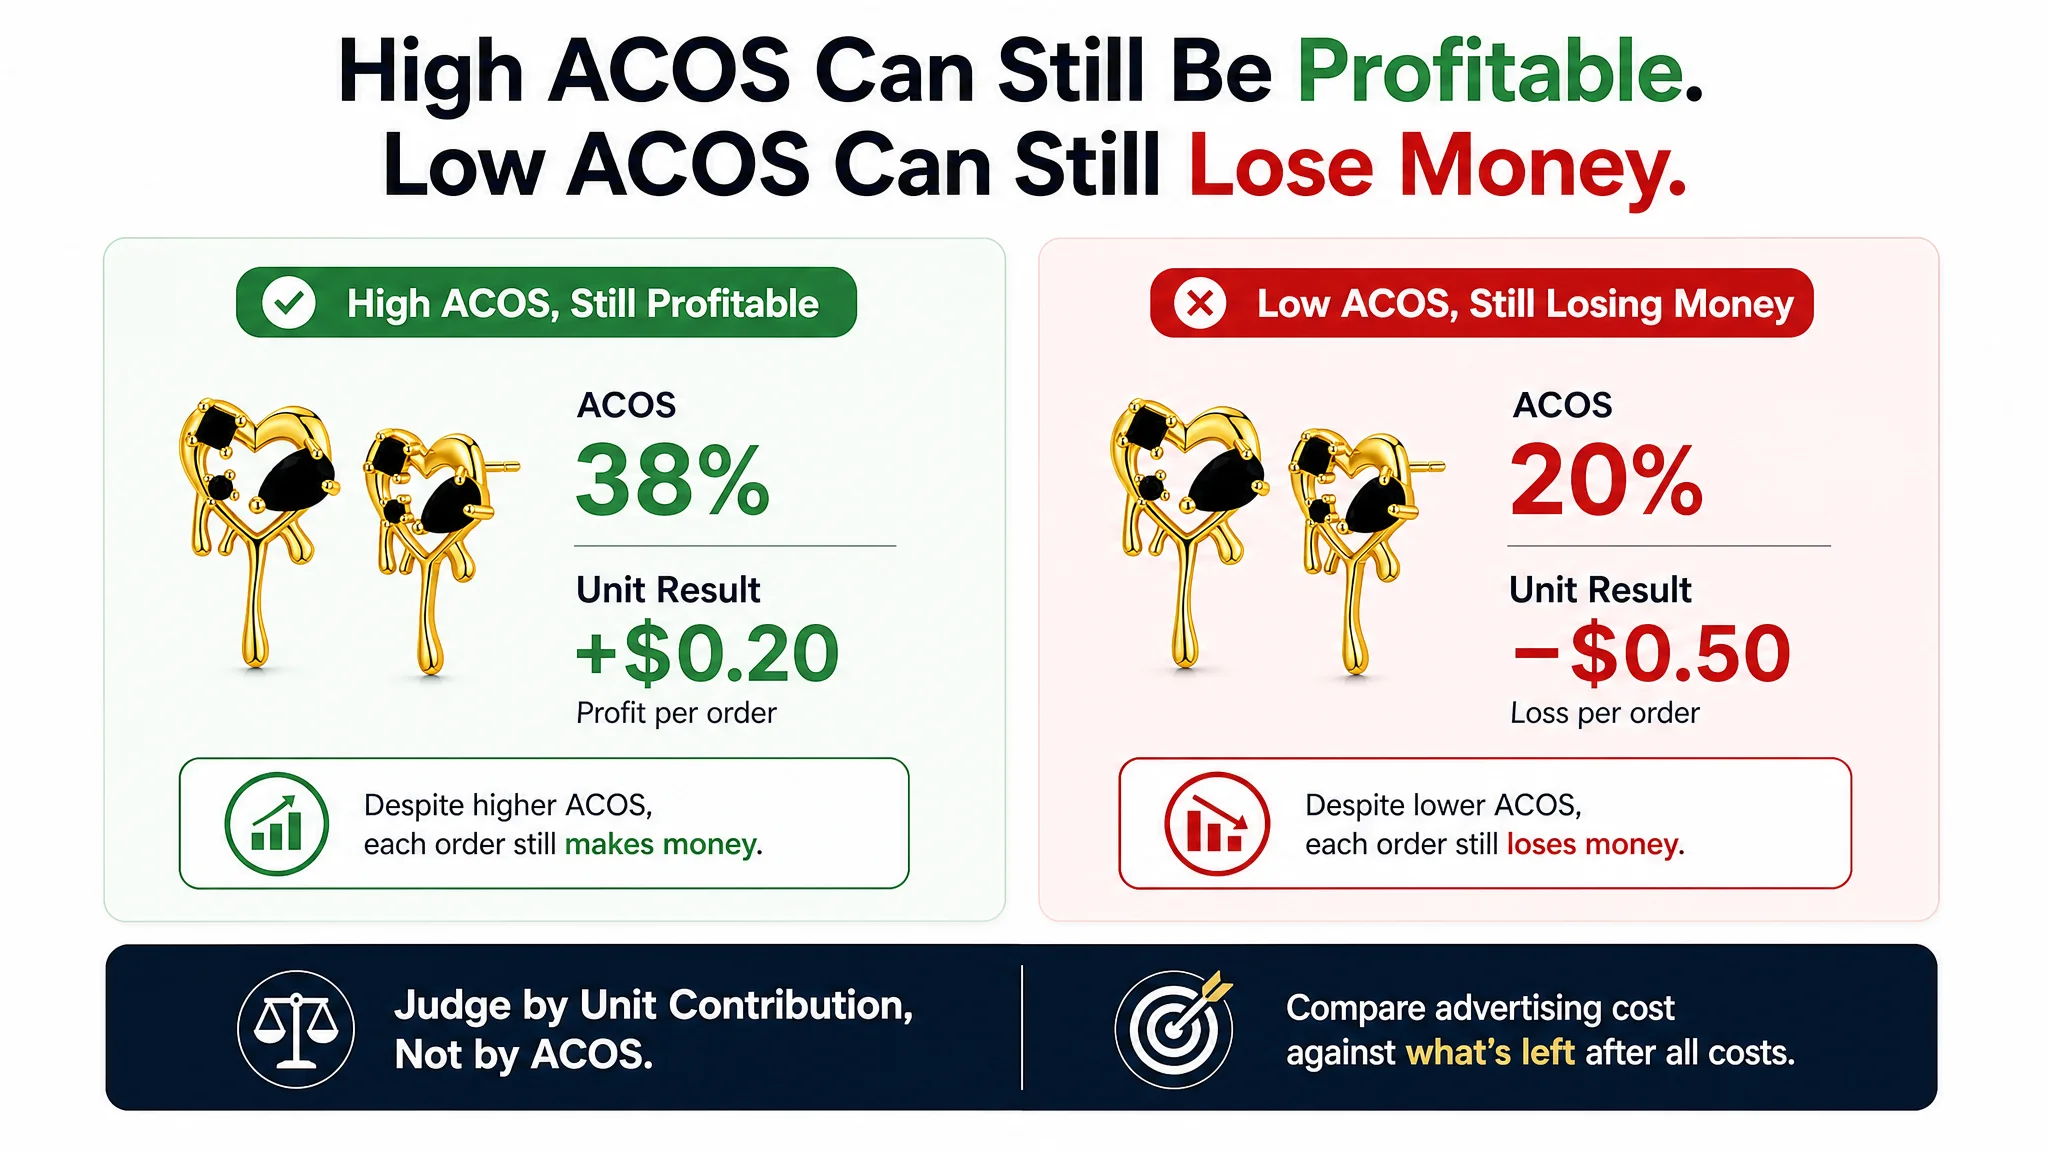
A campaign dashboard shows a 38% ACOS, and the immediate recommendation appears obvious: reduce the bid or cut the budget. Yet suppose an author is advertising a $9.99 print edition. After printing, fulfillment, royalties, and other variable costs, the contribution margin before advertising is $4.00 per unit. A 38% ACOS costs approximately $3.80 on that sale, leaving about $0.20 in contribution profit. The campaign is not efficient by percentage standards, but it is still paying its variable costs and contributing to the business.
Now compare a campaign with a 20% ACOS on the same price point. If its contribution margin before advertising is only $1.50, the roughly $2.00 advertising cost produces a loss of about $0.50 per order. The lower ACOS campaign is economically weaker, even though the console makes it look cleaner.
ACOS tells you what a campaign costs relative to attributed sales. It does not tell you whether the campaign pays after the costs required to produce and deliver each unit. That distinction is critical for thin-margin and low-price sellers. A small change in printing cost, fulfillment cost, royalty, or selling price can turn a seemingly acceptable percentage into a loss. Borrowed ACOS targets are especially dangerous when they are applied without the product’s own contribution margin.
The same mistake can occur when sellers assume that an apparently strong product page will automatically make advertising efficient. In one Amazon jewelry account, the Listing scored higher than a closely matched competitor across several page dimensions. It had stronger reviews, more polished A+ content, and refined visuals, yet ad costs remained difficult to control. The team initially kept looking for a bid, keyword, or creative problem. Further diagnosis showed that the page was not answering buyers’ most important concerns early enough: fit, comfort, allergy safety, durability, and after-sales reassurance. The ads were generating traffic, but the page was not converting that traffic efficiently.
The operating decision should therefore start with profit per unit derived from contribution margin. That figure should guide the bid, budget, and pause decision. A campaign can justify continued spend when its incremental orders remain contribution-positive, even if its ACOS looks high. A campaign deserves reduction or a pause when its percentage looks attractive but each attributed order destroys contribution.
ACOS remains useful as a cost signal for comparing campaigns and monitoring change. It is not the final business verdict. Read it alongside unit economics, then decide whether the next dollar of spend adds profit or adds revenue at a loss. Just as importantly, confirm that the page receiving the traffic can convert it. Advertising efficiency is constrained not only by the price of the click, but also by the page’s ability to turn that click into a commercially useful order.
ACOS vs Profit vs TACoS: Keep Each Metric on Its Own Denominator
Amazon advertising decisions deteriorate when one ratio is treated as a substitute for another. A campaign can show an acceptable ACOS while contributing little profit, or show a high ACOS while supporting meaningful total sales and organic ranking. The first control is to keep each metric tied to its own denominator.
- ACOS: Formula: Ad spend ÷ ad-attributed sales, What it measures: Advertising cost against sales credited to the ads
- TACoS: Formula: Ad spend ÷ total sales, What it measures: Advertising cost against all sales, including organic sales
- ROAS: Formula: Ad-attributed sales ÷ ad spend, What it measures: Sales generated for each unit of advertising spend
Suppose a campaign spends $500 and generates $2,500 in ad-attributed sales:
- ACOS = $500 ÷ $2,500 = 0.20 = 20%
- ROAS = $2,500 ÷ $500 = 5.0
ROAS is the reciprocal view of ACOS: a 20% ACOS corresponds to a 5.0 ROAS. The two figures describe the same advertising relationship from opposite directions. Neither one is a profit calculation.
TACoS uses a different denominator. If the same $500 in ad spend supports $4,000 in total sales, then:
- TACoS = $500 ÷ $4,000 = 12.5%
The console ACOS row and the all-sales ratio must remain separate. ACOS answers, “How much did advertising cost relative to sales attributed to advertising?” TACoS answers, “How much did advertising cost relative to the entire sales result?” Replacing one denominator with the other can make a campaign appear more or less efficient without changing its underlying performance.
Profit per unit is the goal metric because it accounts for the economics left after revenue and costs. A practical calculation is:
Profit per unit = selling price − product cost − fulfillment cost − Amazon fees − allocated advertising cost
The relevant decision is therefore not whether ACOS looks attractive in isolation. It is whether the resulting orders leave acceptable profit per unit, while the campaign’s TACoS and broader sales contribution are interpreted separately. Record console ACOS, TACoS, ROAS, and profit per unit on distinct rows. Then use the correct denominator when deciding whether a campaign is economically viable.
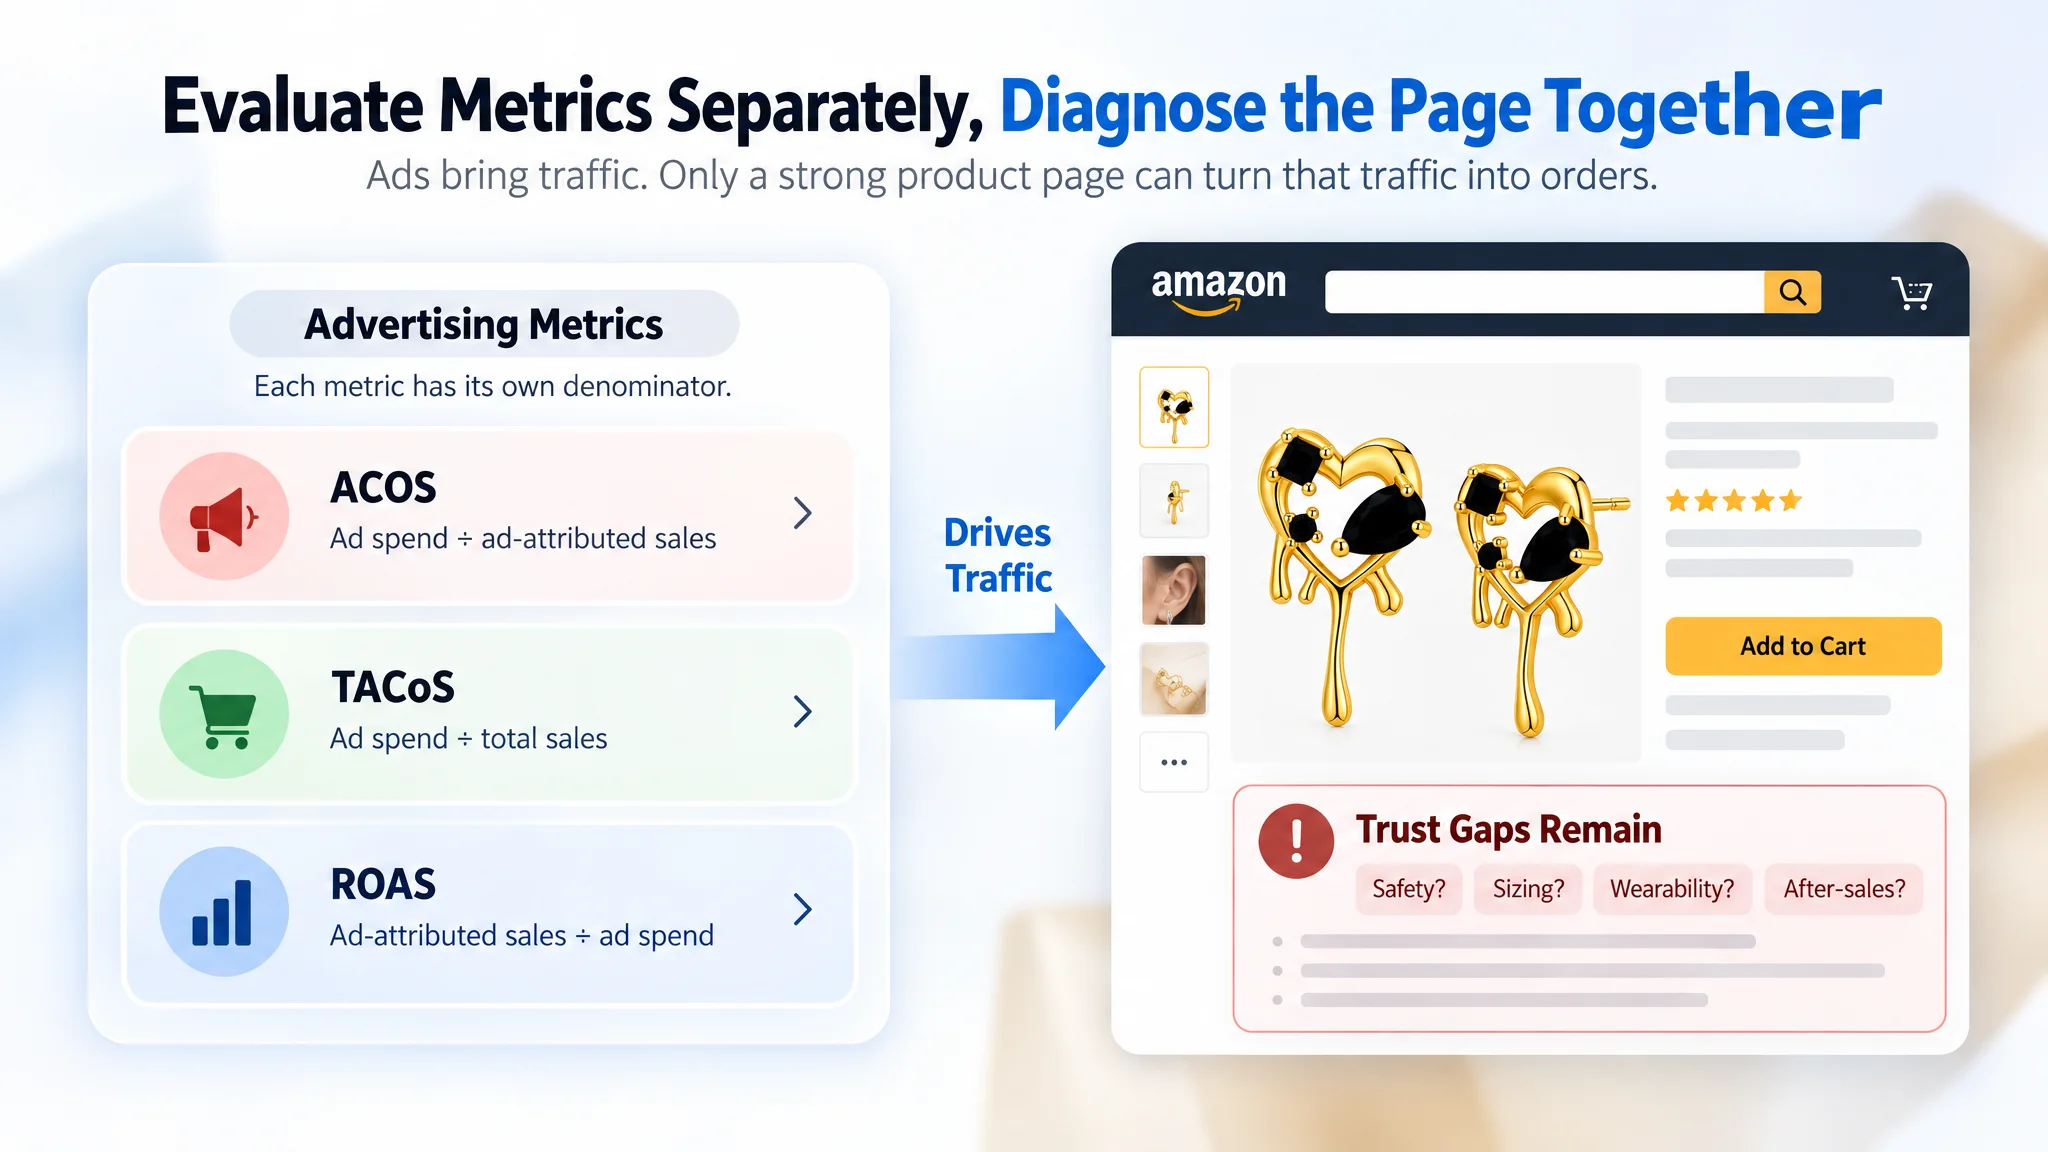
A separate page-level review is also necessary. In the jewelry account, the team’s strong Listing score and polished A+ content could have made the advertising data appear to be the only issue. However, the competitor’s page used its bullets and visuals to answer safety, sizing, wearability, and after-sales questions earlier. The customer’s page had more refined assets, but those assets were arranged in a less effective decision sequence. A lower TACoS or acceptable ACOS would not, by itself, explain whether the page was converting paid traffic efficiently. The metrics had to be read alongside the page’s ability to reduce purchase risk.
Break-Even ACOS: Derive Your Own Line Instead of Borrowing 30%
A 30% ACOS is not automatically good, bad, or acceptable. Its meaning depends on how much contribution remains from each sale before advertising cost is deducted. The relevant comparison is not ACOS against a borrowed industry threshold. It is ACOS against the product’s own break-even line.
Break-even ACOS equals the contribution margin measured before advertising cost:
Break-even ACOS = contribution margin before ad spend ÷ attributed sales revenue
Use the same revenue basis on both sides. If ACOS is calculated from attributed ad sales, calculate the margin against the same sales value. The margin should include the product’s relevant non-advertising costs, such as manufacturing or printing, Amazon fees, fulfillment, discounts, and other variable costs used in the seller’s unit economics. Advertising cost must remain outside this calculation. If advertising has already been deducted, the resulting margin cannot be compared directly with ACOS as a break-even ceiling.
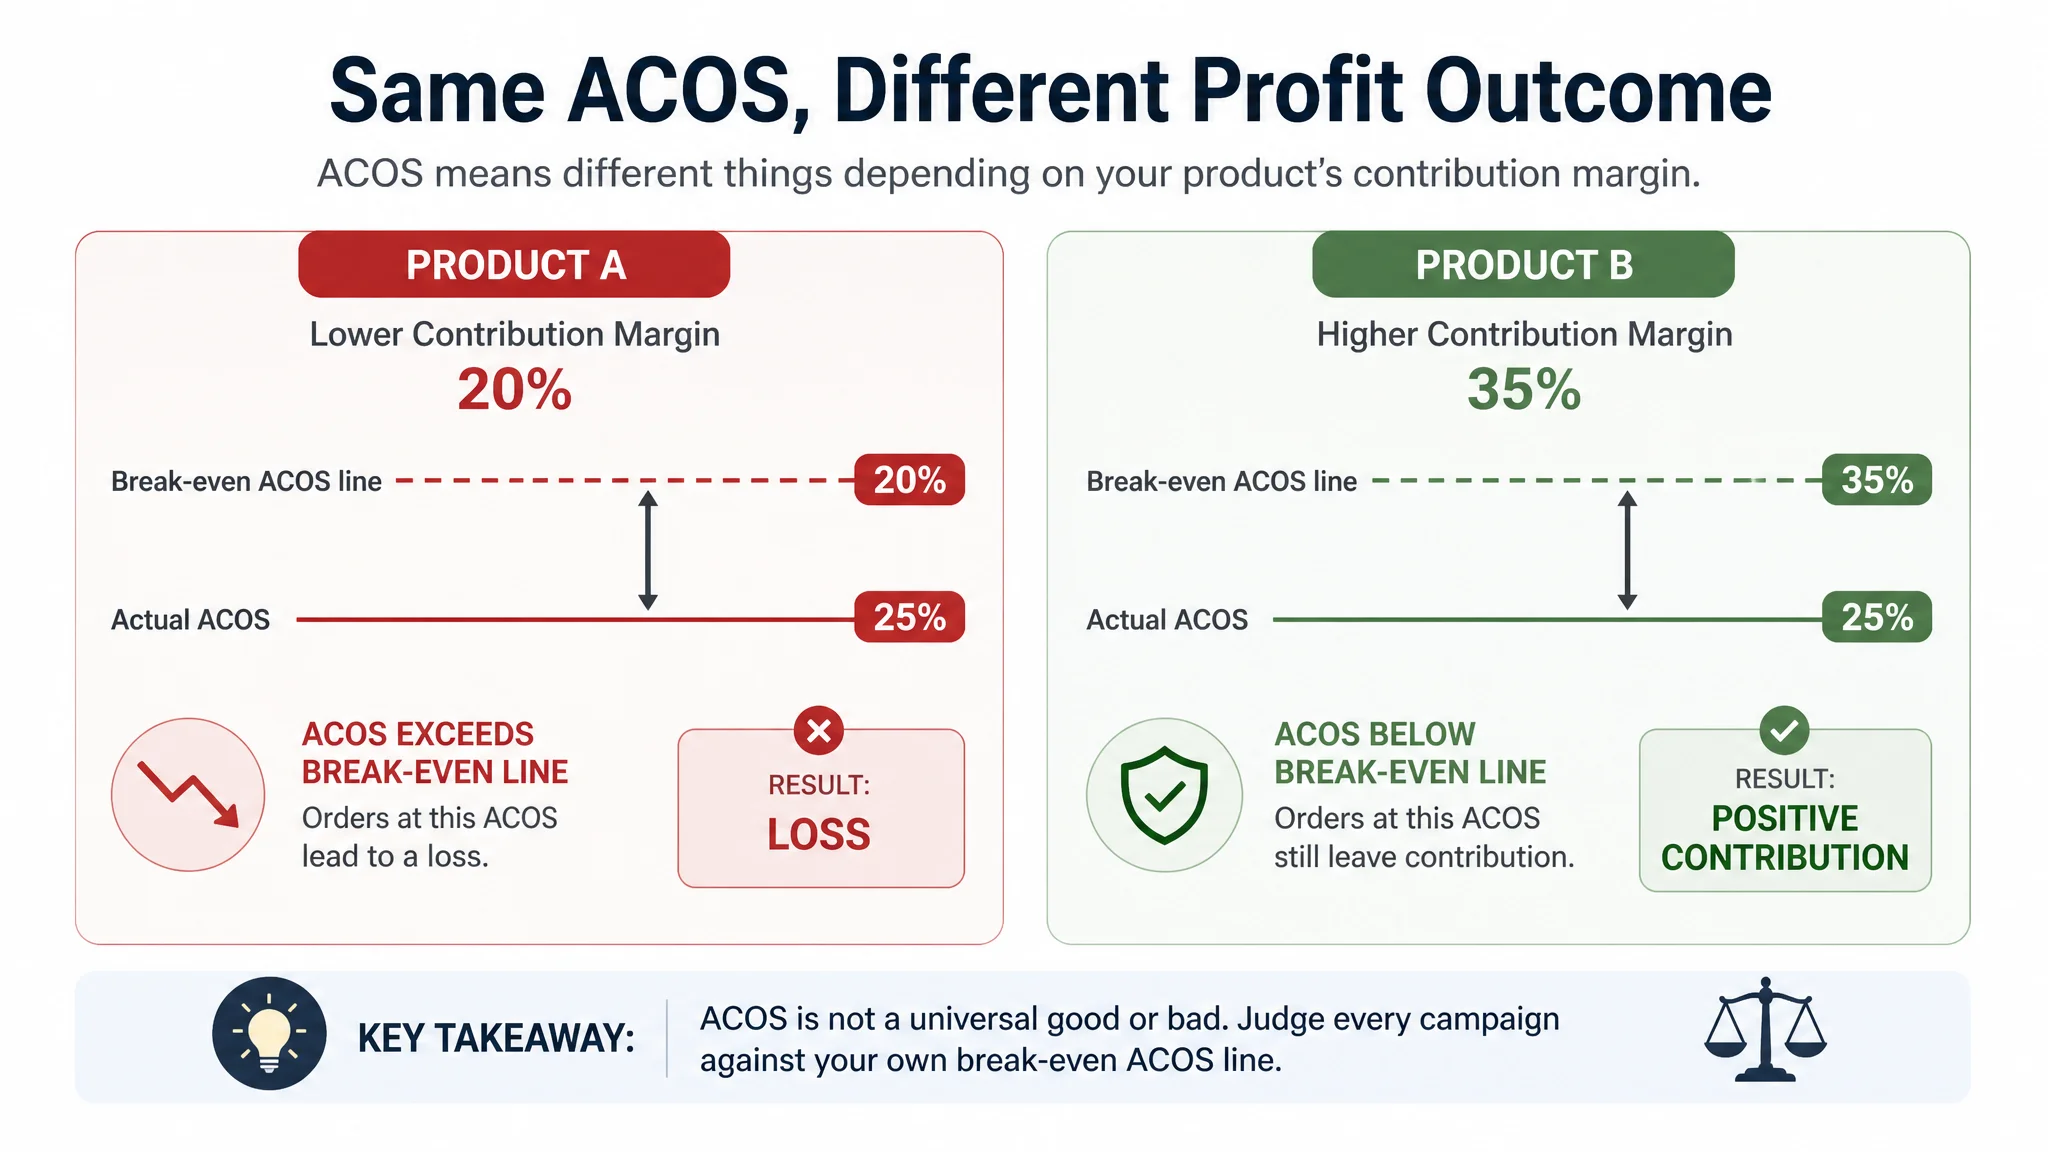
Consider two products with the same 25% ACOS. Product A has a 20% contribution margin before advertising. Its break-even ACOS is 20%. At 25% ACOS, advertising consumes more contribution than the product generates before ads, so each attributed order loses money before considering any additional overhead.
Product B has a 35% contribution margin before advertising. Its break-even ACOS is 35%. At the same 25% ACOS, the campaign remains above break-even and leaves approximately 10 percentage points of contribution after advertising, before fixed costs and other business considerations.
The dashboard reports the same nominal ACOS, but the economic result is opposite. A seller who pauses Product B because its ACOS is above a generic 20% or 30% benchmark may remove a profitable campaign. A seller who accepts Product A because its ACOS appears close to a common benchmark may continue funding loss-making sales.
Treat break-even ACOS as a ceiling for direct advertising efficiency, not as a universal target for every campaign role. A campaign supporting keyword discovery, launch visibility, or broader organic performance may require separate evaluation using metrics such as CTR, CVR, BSR, TACoS, and the resulting sales contribution. Still, the direct profit question remains clear: for campaigns judged on immediate ad-attributed profitability, ACOS should be compared with the product-specific margin-derived line, not with a number borrowed from elsewhere.
The same product-specific logic applies to conversion capacity. A campaign can sit near its break-even line and still be fragile if the page converts inconsistently. In the jewelry account, the customer had stronger reviews and a higher Listing score than its competitor, but those advantages did not guarantee that each paid visit would become an order. The diagnosis found that the page’s proof was misallocated: technical diagrams and refined aesthetics appeared before practical reassurance about material safety, fit, comfort, and protection. A campaign’s break-even line tells you how much acquisition cost the product can absorb; the Listing determines how efficiently the purchased traffic moves toward an order.
Why Sales Go Up While Profit Doesn't
A sales increase is not the same as a profit increase. Amazon reports advertising sales at the price counted in the ad report, while your business absorbs product costs, marketplace fees, fulfillment costs, and advertising spend. ACOS shows only the relationship between ad spend and attributed sales:
ACOS = ad spend ÷ attributed sales
That ratio is useful, but it does not show how many dollars remain after producing and selling each unit.
Consider a print product listed at $10. Assume its contribution before advertising is $3 per unit after the applicable product costs. Ten orders produce $100 in Amazon-attributed sales and $30 in contribution before ads.
- At $20 ad spend, ACOS is 20%, leaving $10 after advertising.
- At $40 ad spend, ACOS is 40%, leaving a loss of $10 after advertising.
The order volume has not changed. The higher ACOS has removed an additional $20 of profit from the same ten orders. Looking only at the $100 in sales or the 20-percentage-point ACOS increase can obscure the practical decision: the campaign moved from producing dollars to consuming them.
The same problem appears when sales rise. Suppose orders increase from 10 to 12, taking attributed sales from $100 to $120. If contribution before advertising rises from $30 to $36 but ad spend rises from $20 to $48, the account records $20 more sales while post-ad contribution falls from $10 to negative $12. Growth in revenue has not covered the additional acquisition cost.
For print products, the underlying economics must be calculated from the relevant channel structure. On Amazon marketplaces, a stated structure may be 60% of list price minus printing. Through expanded distribution, it may be 40% minus printing. Those are not advertising profit figures; they are starting points for calculating the dollars available before ads and other costs. A low list price can leave very little room for bidding.
Rising click costs create the same pressure even when conversion stays flat. If the same number of clicks continues to produce the same number of orders, higher cost per click raises spend without increasing sales. ACOS rises, and the margin left per order falls. A lower click price is valuable only when it reduces acquisition cost or improves ACOS without damaging order volume.
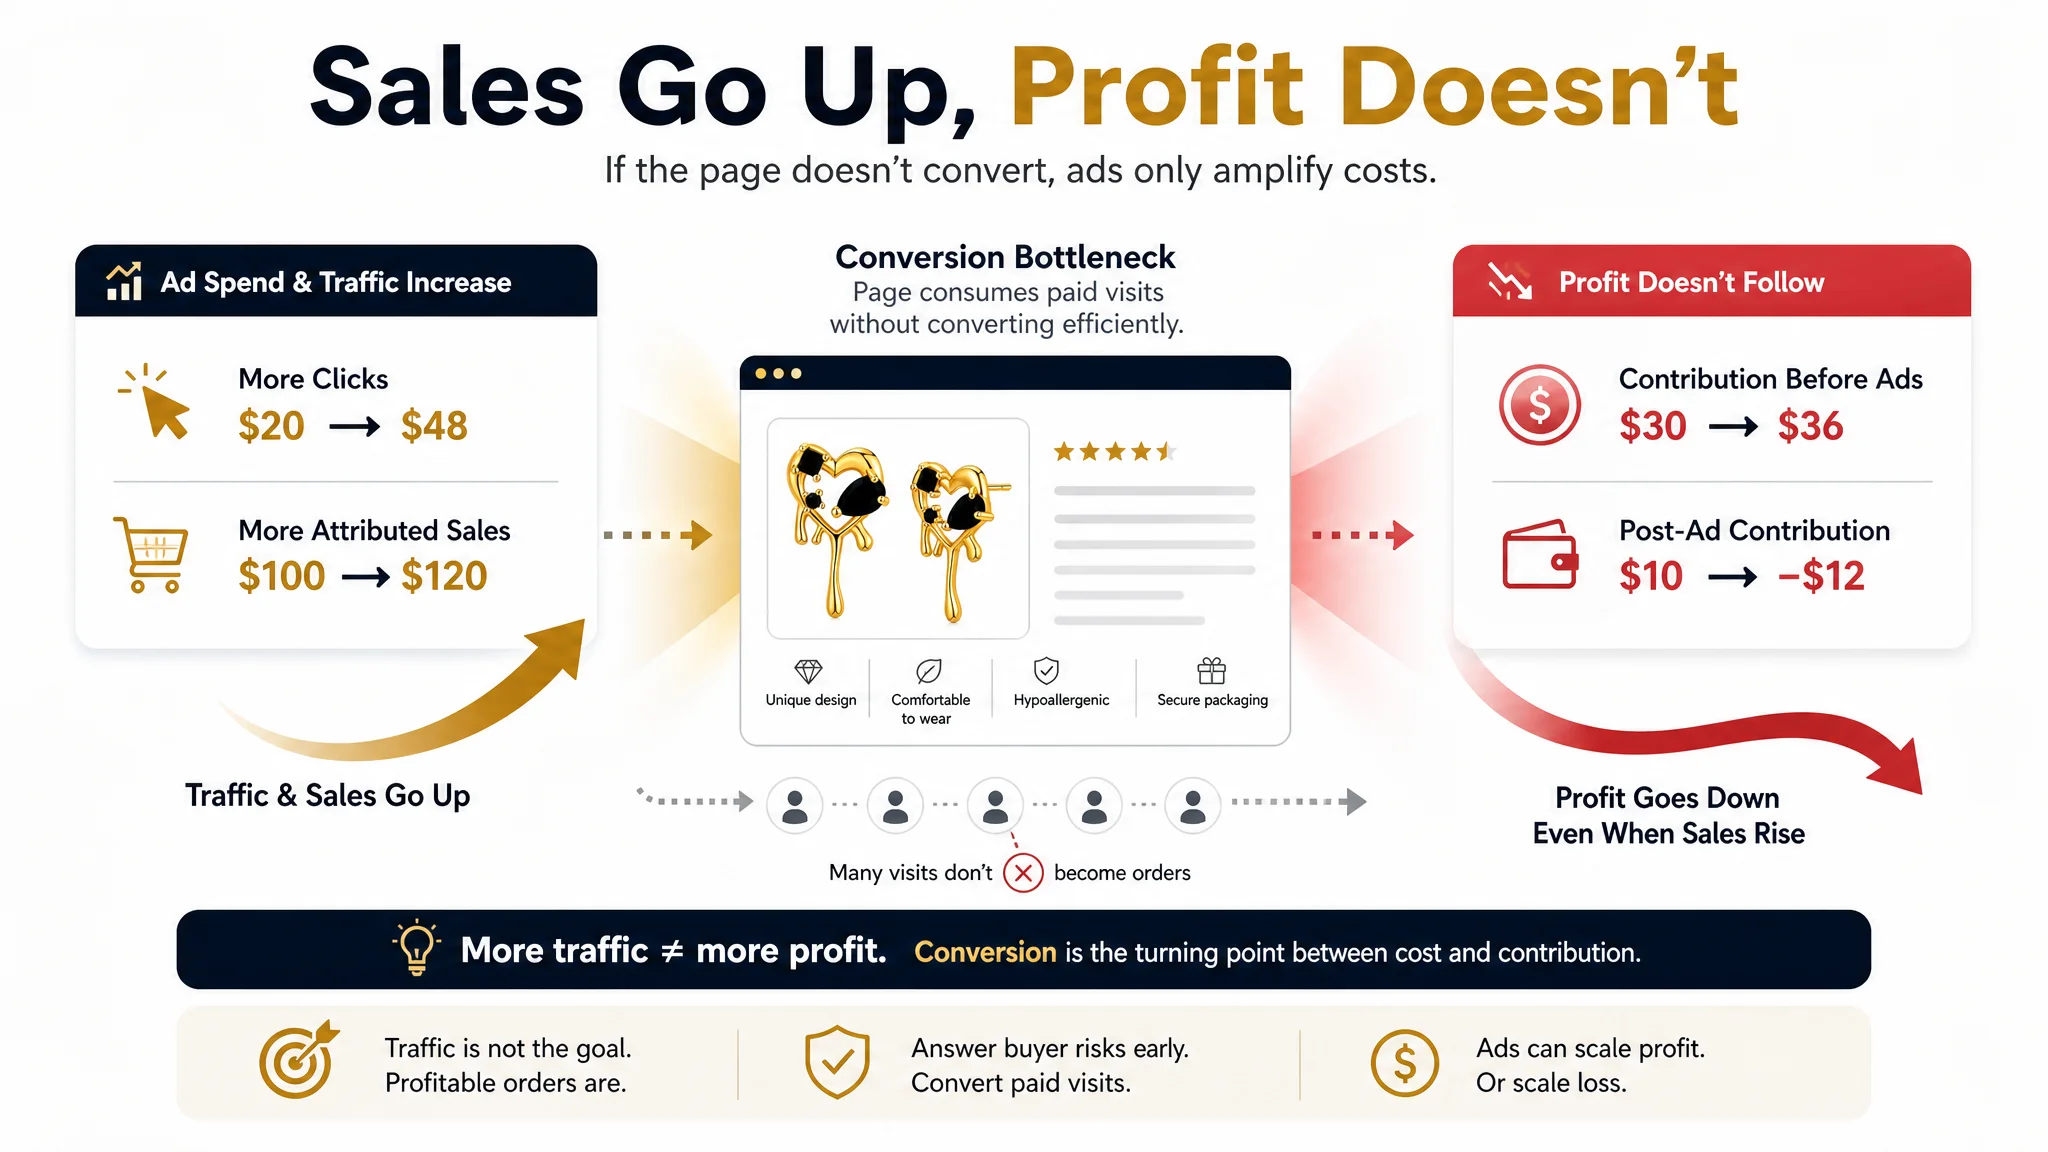
A page-level conversion constraint can create the same economic pattern without an obvious traffic failure. In the jewelry account, CTR was considered normal enough that the team initially focused on competition, bids, and creative refreshes. Yet orders did not rise with traffic at the same pace. The customer’s page looked premium, but its title, bullets, images, and A+ modules did not present safety, comfort, sizing, and after-sales reassurance in the order buyers needed. The result was not necessarily a lack of clicks; it was a page that consumed paid visits without converting them efficiently.
Judge each campaign in dollars: attributed sales, ad spend, contribution per unit, and contribution after advertising. Use CTR and CVR to diagnose where the loss begins, but use profit to decide bids, budgets, and pauses. When CTR is acceptable and CVR remains weak, inspect the Listing before assuming that more traffic or lower bids will solve the problem.
Starting Out: Bids, Budget and How Many Keywords
A new campaign should be designed to produce interpretable evidence, not maximum reach. Start with a small keyword set so you can connect each keyword’s impressions, clicks, CVR, orders, and ad cost to its effect on profit. A large launch spreads the learning budget across too many variables and makes a weak keyword harder to identify.
Use the following controlled procedure:
1. Choose the starting bid from observed account data. The source account shows click costs of roughly $0.29 to $0.72. Start near the lower end of that observed range, then move upward only when a keyword is receiving insufficient exposure or clicks. Do not treat $0.80 as a market average. Use it as a deliberately conservative planning ceiling for this campaign.
2. Set the daily budget around one planned sale’s advertising cost. If a sale generally takes 6–8 clicks, an $0.80 planning ceiling implies approximately $4.80–$6.40 in ad cost per unit sold. A daily budget in that range gives the campaign room to collect meaningful evidence without allowing an unproven keyword to consume an open-ended learning budget. Whether that cost is profitable still depends on selling price, fees, product cost, and the profit available per unit.
3. Launch with a limited keyword set. Use only the initial terms you can review individually and keep the set small enough that one day’s spend does not become opaque. The goal is not to fill every available targeting slot; it is to learn which terms can produce orders at an acceptable profit.
4. Review on a fixed cadence. Check spend and delivery daily so an unexpected bid or budget issue does not distort the test. Review CTR, clicks, CVR, orders, ACoS, and profit contribution at least twice each week. Treat a bid or listing change as a new test event and compare the following observation window with the prior baseline. A 7–14-day window can help reveal whether post-change CTR and conversion signals are stabilizing, provided the campaign has generated enough clicks to judge.
5. Apply a clear pause rule. If a keyword reaches eight clicks without a sale, pause it or reduce its bid rather than letting it consume the remaining learning budget. Eight clicks is the upper end of the planning assumption, not proof that every keyword must convert by then; the rule simply prevents an unproductive term from receiving unlimited spend. A working campaign shows orders emerging within the planned click range while its resulting ACoS remains compatible with unit profit.
This controlled approach should include the Listing as a test variable. If the campaign receives relevant traffic but CVR remains weak, do not automatically classify the keyword as unproductive. In the jewelry account, the page had credible assets and strong reviews, but its decision sequence did not close the risks that mattered most to buyers. A keyword can be commercially relevant while the page behind it remains unable to convert that relevance into an order. The correct test is therefore not only “did this keyword receive a sale?” but also “did the traffic reach a page that clearly addressed the customer’s reason for buying and hesitation about purchasing?”
A Real Account: 19 Months of Ads, Read Campaign by Campaign
Why the Account Average Lies
A 19-month account window is useful only when its totals remain connected to the rows that created them. Start with the account-level totals, but place them beside campaign-level records showing impressions, clicks, orders, conversion rate, spend, sales, and ACOS. The total establishes scale; the rows explain economics.
A monthly result can look acceptable while individual campaigns are moving in opposite directions. One campaign may be producing orders at a sustainable cost, while another is consuming clicks without converting. A weighted account average can conceal that difference because high-sales campaigns carry more weight in the calculation. The reporting level determines whether the operator can still see which economics deserve expansion, correction, or a pause.
Before judging a monthly result, inspect both campaign and search-term levels:
- Identify campaigns with clicks but no orders, then review the search terms generating those clicks.
- Separate campaigns with efficient conversion from campaigns whose spend is supported only by a broader account average.
- Compare conversion rate, spend, and ACOS rather than treating order volume alone as proof of quality.
- Check whether a weak campaign is buying relevant traffic that has not converted yet or irrelevant traffic that should be reduced.
Keep the console ACOS and any all-sales ratio on separate, clearly labelled rows. ACOS uses ad spend against ad-attributed sales. An all-sales ratio, such as TACoS, uses ad spend against total product sales. They answer different questions and must retain their own denominators. Neither ratio should be allowed to substitute for a profit calculation.
The account break-even point is also weighted by format and product mix. A low-price print edition, a higher-priced edition, and other formats can carry different contribution margins. A single product's break-even line is therefore only an approximation for the account. A headline average below that line does not, by itself, prove account profitability.
The same caution applies to Listing scores and account-level content ratings. In the jewelry account, the customer’s page scored higher than its competitor on several dimensions, including title coverage, main images, detail-page content, and reviews. If the team had relied on that average score, it could have concluded that the page was already strong and that advertising was the only remaining problem. Campaign-level and page-level diagnosis showed a different picture: the page had quality assets, but those assets were not arranged around the buyer’s risk sequence. A high average score can hide a specific conversion constraint just as an account ACOS can hide an unprofitable campaign.
A Low CTR Is Not a Reason to Cut
CTR is a diagnostic signal, not a universal stop rule. A low CTR may reflect the query, placement, impression context, price, or product presentation. Cutting the campaign before examining those conditions can remove useful traffic and reduce the evidence available for improving CVR and ACOS.
Read CTR alongside clicks, search terms, conversions, spend, and sales. If impressions are substantial but relevant search terms receive few clicks, investigate the traffic and listing alignment. If clicks are limited, a low conversion rate may not yet be a stable conclusion. If clicks accumulate without orders, the economic case for reducing bids or pausing becomes stronger.
Use a daily adjustment cycle based on the trailing seven days of clicks, conversions, spend, and ACOS. Make the decision at campaign and search-term level, then reassess the next seven-day window rather than allowing the account average to make the decision for you.
CTR should also be separated from the page’s ability to convert. A polished main image may earn attention, but a click does not prove that the customer understands the product or trusts the offer. In the jewelry account, the customer’s visuals were more refined than the competitor’s, yet the competitor addressed practical concerns such as skin safety, fit, and after-sales support earlier in its copy. The lesson is not that aesthetics are irrelevant. It is that a strong click signal can still lead to weak CVR when the page fails to continue the promise made at the ad or search stage.
Search Terms and Negative Keywords: Where ACOS vs Profit Is Actually Decided
Campaign-level ACOS can conceal where profit is being lost. A campaign may show an acceptable average while a small group of search queries consumes budget without creating orders. For low-priced products or thin-margin print editions, that leakage can erase the contribution from the terms that do convert.
Start with the search-term report, not the bid console. Sort queries by spend and inspect them in descending order. Then apply a repeatable set of flags:
- Search terms with meaningful click counts but no purchase.
- Search terms that attract spend without producing an economically useful conversion pattern.
- Search terms unrelated to the product, even when they generate impressions or occasional clicks.
- Search terms that reveal a mismatch between the customer’s intent and the offer shown on the detail page.
The purpose is not to impose a universal click threshold or accumulate negative keywords as a badge of account maturity. The purpose is to identify traffic that has already demonstrated a poor relationship between cost and commercial intent. Add the appropriate negative keyword when the evidence shows that the query should not continue receiving paid traffic. Use the search-term report to distinguish a genuinely unproductive query from a term that simply has too little data for a reliable judgment.
The last flag is particularly important because not every weak conversion pattern is caused by irrelevant traffic. In the jewelry account, the page was receiving visitors who could reasonably be interested in the product, but the page did not close the concerns that made the purchase feel risky. The competitor’s bullets led with skin safety, sizing, and a clear after-sales promise, while the customer’s page led with design and usage scenes. If the query intent is relevant and CTR is normal but CVR remains weak, adding negative keywords may remove potentially valuable demand without fixing the page-level constraint.
Run this cleanup often enough that leakage remains part of normal account operation rather than becoming a large recovery project. The exact cadence depends on spend, order volume, and how quickly the catalogue generates new query data. The operating sequence should remain consistent: remove clearly wasteful or irrelevant traffic before changing bids. Otherwise, a bid reduction may merely reduce exposure while leaving the underlying targeting problem active.
The same report can expose opportunities that campaign averages cannot. Combine query performance with a competitor-layout-gap scan: compare where relevant competitors appear, which keyword positions they occupy, which listings communicate the strongest commercial fit, and which competitor ads capture traffic your campaigns leave uncovered. Keep the comparison commercially valid by filtering for product form, price range, audience, and market context.
The jewelry comparison showed why this scan must include page communication, not only keyword coverage. The customer’s Listing had stronger reviews and more polished A+ content, but the competitor made material safety, fit, gifting, and after-sales protection more explicit in the early buying path. A competitor gap may therefore involve not just an uncovered keyword, but a missing reason for the shopper to trust the offer.
Rank each uncovered gap by its proximity to converting traffic. A gap tied to a proven or closely related search intent deserves attention before a broad, speculative keyword opportunity. The page behind the ad must still convert the traffic the ad buys, so use CTR and CVR to separate an acquisition problem from a conversion problem. This sequence protects profit before additional bids or budgets amplify the leakage.
When ACOS Is Above Break-Even: The Remediation Order
An ACOS above break-even does not automatically justify a bid cut. A blanket reduction changes the price of every auction, including placements and search terms that may be producing the strongest CVR. If those converting opportunities lose visibility while weak traffic remains, orders can fall faster than ad spend, leaving ACOS unchanged or even worse.
Use a diagnostic sequence instead.
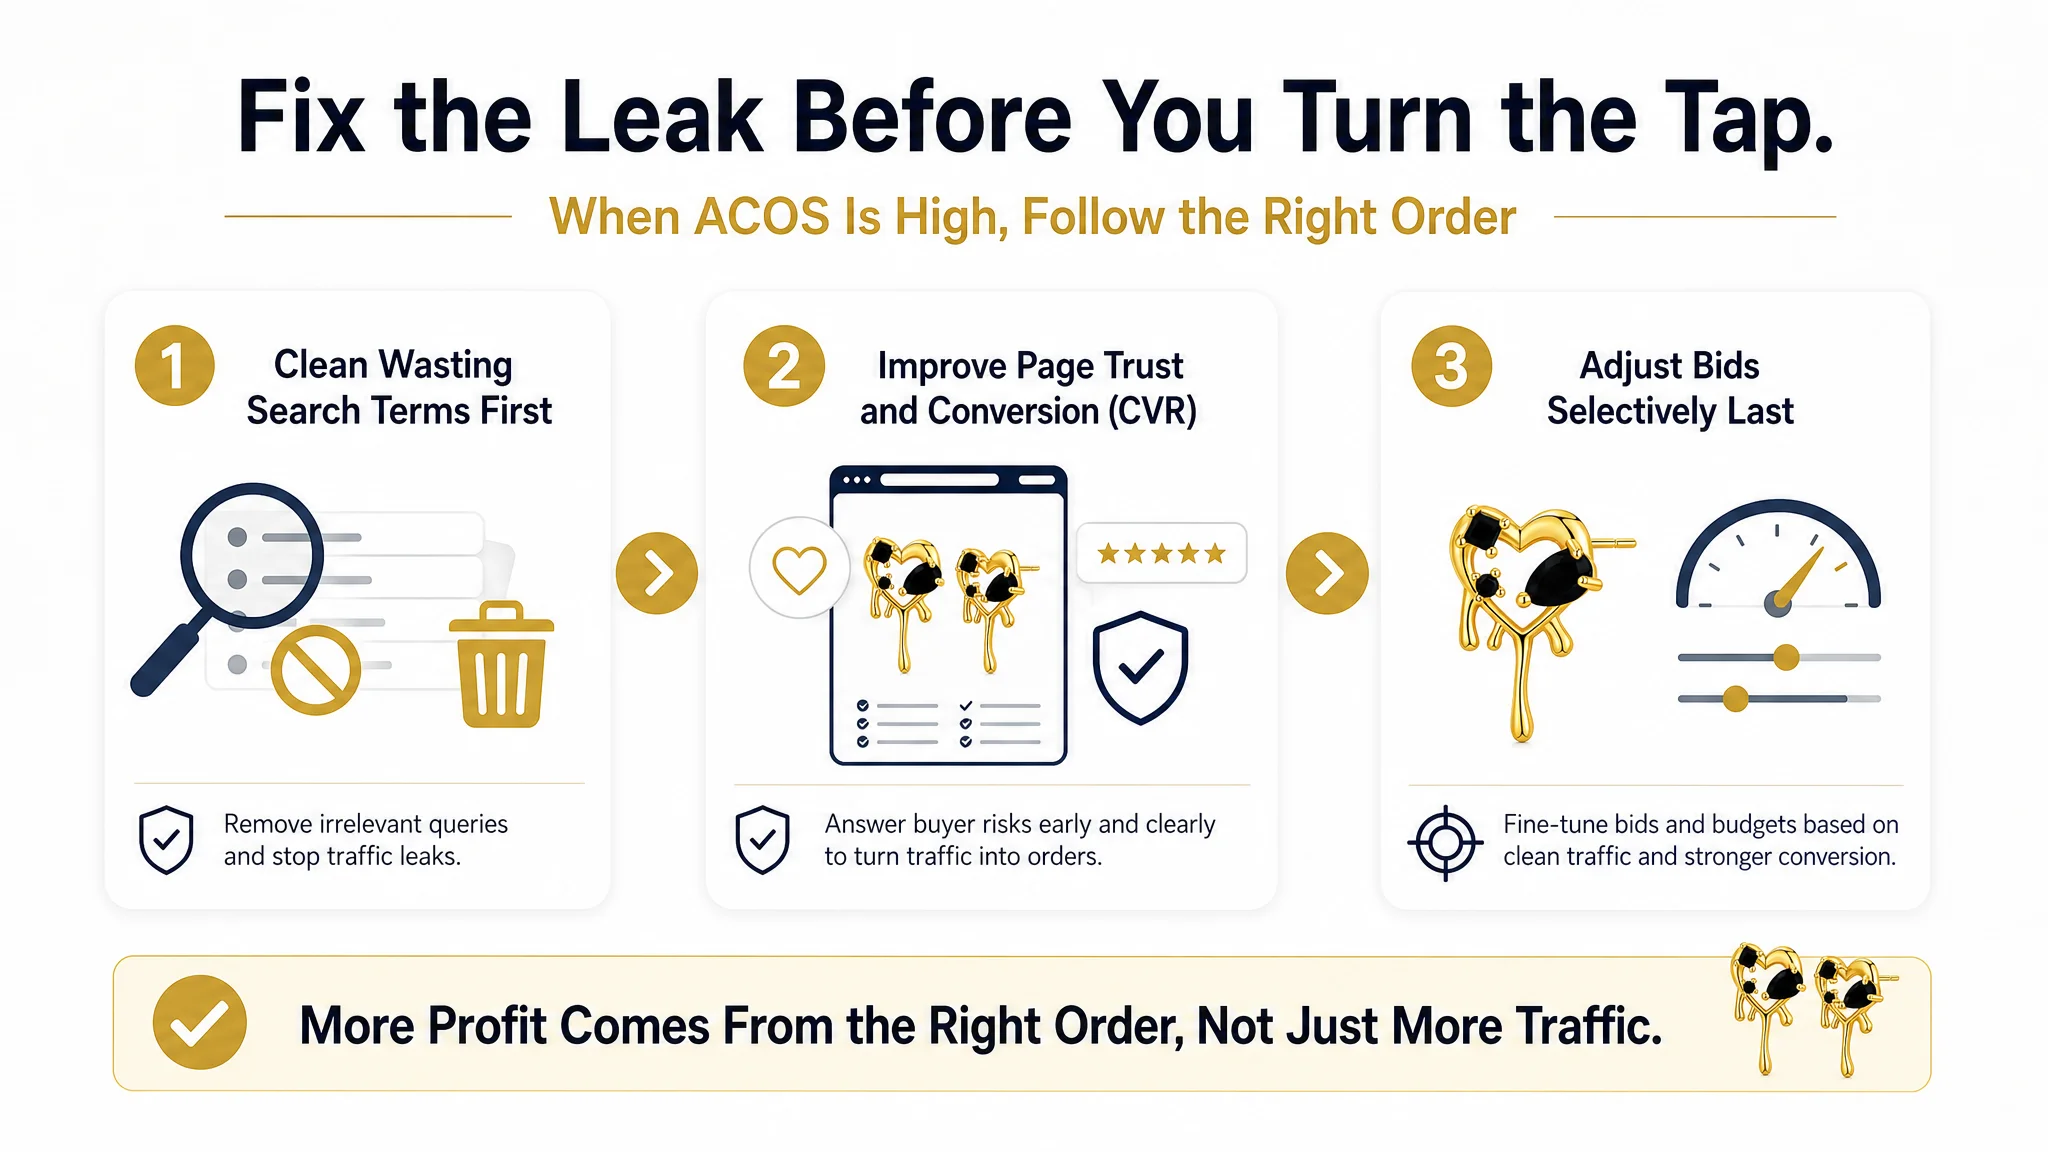
1. Remove wasting search terms first. Identify queries, targets, or placements that consume clicks without producing orders, attract clearly irrelevant traffic, or show materially weaker CVR than the retained traffic. Pausing or reducing exposure to those specific sources removes avoidable spend without sacrificing every potentially productive impression.
2. Improve conversion on the traffic you keep. Review the listing against the diagnosed funnel constraint: a weak visual hook can suppress CTR, while insufficient trust, information density, or selling-point clarity can suppress CVR. Strengthening the main image, detail-page communication, or relevant A+ content may help the existing clicks generate more orders; it does not guarantee a lower ACOS, but it addresses the conversion loss before buying less traffic.
3. Adjust price or cost levers only where margin allows. If the offer has defensible room, a carefully considered price or unit-cost change can improve contribution after advertising. This step must remain conditional: a low-price product or thin-margin print edition may have little room, and a change that harms CVR or demand can offset the intended margin gain.
4. Adjust bids selectively last. Once wasted demand has been removed and retained traffic has had a conversion opportunity, reduce bids only for the targets, placements, or campaign segments that still fail the profit test. Preserve bids where orders and contribution justify the spend, even if the campaign-level ACOS looks uncomfortable.
A useful page diagnosis should be specific rather than simply describing the Listing as “weak.” In the jewelry account, the issue was not a lack of polished content. The page had strong reviews, detailed visuals, a size diagram, and a more developed A+ presentation than the competitor. The structural gap was the order of proof. Material safety and after-sales reassurance appeared too late, technical information arrived before desire had been built, and the images showed quality without fully communicating comfort, durability, and fit. The appropriate correction was therefore to rebuild the decision path, not merely to produce more decorative assets.
After each material change, compare impressions, clicks, orders, CTR, CVR, ACOS, and TACoS with the pre-change baseline. Allow an observation window long enough to read the response; the available workflow specifically examines CTR movement over the following 7–14 days after a visual iteration. Recheck sooner for obvious delivery or budget problems, but avoid judging a structural listing change from a few isolated clicks. If CVR improves while ACOS remains above break-even, the next action may still be a selective bid or cost adjustment rather than a campaign-wide cut. If orders and CVR weaken, restore the diagnosis before reducing exposure further.
Ads Amazon Doesn't Tie to a Product Page
Some Amazon advertising spend does not map cleanly to one product page or ASIN. A campaign may introduce a shopper to a brand, influence a later product choice, or contribute to a purchase that is recorded under a different report line. The console can still present a campaign-level ACOS, but that ratio may not describe the campaign’s full commercial contribution.
The distortion occurs in both directions. If spend is recorded against a campaign while only part of the resulting demand is attributed to that campaign, apparent ACOS can look worse than the campaign’s role in the buying journey. If a sale is attributed to the campaign even though the shopper was already likely to purchase, ACOS can look stronger than the incremental profit actually created. Neither interpretation should be treated as a platform defect. It is a measurement boundary that requires business-level judgment.
A same-day ACOS decision is also unsafe when attribution has not fully matured. Conversion reporting can arrive after the click, and the selected attribution model determines which campaign, product, or time period receives credit. Pausing a campaign immediately after a high-ACOS day can remove useful traffic before delayed conversions appear. Increasing bids from a low-ACOS snapshot can create the opposite mistake.
Use a longer observation window and compare several signals together:
- Spend, clicks, CTR, CVR, attributed sales, ACOS, and TACoS
- Total advertising cost against total business sales, not one console row
- Profit after product cost, Amazon fees, fulfilment, discounts, and advertising
- Changes in organic sales and BSR alongside paid performance
Advertising reports can support this review through exposure, clicks, conversions, ACOS, and TACoS, but they should feed a continuing decision cycle rather than a one-day verdict. After a Listing or bid change, observe the pattern long enough to distinguish delayed attribution from a genuine decline in profitable demand.
The product page can also function as a measurement boundary. In the jewelry account, the team initially treated the problem as an advertising issue because the Listing looked strong on paper. But the page’s conversion logic was incomplete: the customer had proof assets, yet they did not appear in the order buyers needed. This meant that traffic quality and ad attribution could not be judged independently of page structure. A paid visit that lands on an unclear or incomplete decision path may be economically weak even when the campaign is reaching relevant shoppers.
The correct question is not whether every dollar can be assigned to one product page. It is whether total advertising cost is producing acceptable profit across the business over the evaluation window, and whether the pages receiving that spend are capable of converting the demand.
How DeepBI Turns ACOS vs Profit Into a Daily Loop
A profitable Sponsored Products operation needs a funnel, not a single bid adjustment applied across every target. DeepBI supports a layered operating loop in which the operator defines the economic objective and the system turns stable advertising evidence into controlled action.
The funnel has four layers:
- Exploration: Discover new keywords and competitor ASINs, accepting that early traffic may have limited conversion evidence.
- Screening: Review roughly the last two months of advertising data to remove low-conversion or low-quality traffic before it consumes more budget.
- Precision: Repeatedly test high-converting keywords and competitor ASINs, using CVR, spend, conversions and ACoS to separate repeatable demand from isolated results.
- Scaling: Increase exposure only for proven traffic. In a disciplined account, roughly 10–15% of traffic reaches this layer.
The operator still sets the commercial direction. Profit protection may require tighter bids and budgets even when a campaign has attractive volume. A growth objective may justify higher ACoS when the contribution margin and available budget support it. The system should not decide that trade-off on the operator’s behalf.
The loop also needs to distinguish an acquisition constraint from a conversion constraint. In the jewelry account, DeepBI’s diagnosis did not simply recommend more traffic or more creative testing. It compared the customer’s page with a closely matched competitor and found that the customer’s higher scores were concentrated in polish, technical detail, and visual refinement. The competitor, despite appearing less sophisticated, handled the buyer’s risk sequence more directly: safety first, then fit, style, gifting, and protection. That diagnosis changed the next action from “add more advertising fuel” to “rebuild the page so existing traffic has a clearer path to purchase.”
For daily control, bids and budgets are adjusted from the trailing seven days of clicks, conversions, spend and ACoS. That window is short enough to guide execution while reducing reactions to a single click, order, or expensive day. DeepBI handles the analysis, execution, optimisation and iteration, keeping manual micro-intervention focused on the goal, constraints and approval of meaningful changes rather than constant bid edits.
Placement analysis adds another control layer. For example, a $4,000 monthly spend can be read as $1,200 at 22% ACoS on Top of Search, $1,000 at 26% on Product Pages, and $1,800 at 34% on Rest of Search, producing a blended ACoS of approximately 27.4% under the stated allocation. Top of Search is the upper section of the first results page, above organic results. Rest of Search has no placement multiplier.
Placement changes should begin with the base bid and Top of Search multiplier, using small 10–15% increments. After each change, wait 7–14 days before re-pulling the placement report. The purpose is not to promise equal or greater sales at a lower blended ACoS, but to evaluate whether the revised traffic mix supports the operator’s profit objective. If the revised traffic continues to land on a page with unresolved trust or information gaps, changing placement may only change the volume of wasted or weakly converting visits.
From Ad Spend to Organic Rank: TACOS and the Ad-to-Organic Bridge
ACOS and TACoS answer different operating questions. ACOS helps judge whether a specific campaign, ad group, or keyword is converting ad spend into attributed sales efficiently. It is useful when setting bids, reallocating budgets, or pausing activity that cannot support its required contribution margin. TACoS looks across the business: total advertising spend relative to total sales. It shows how much the business depends on paid demand, including the effect of advertising on sales that are not directly attributed to an ad.
A campaign can therefore have an acceptable ACOS while total-business exposure remains too high. The reverse can also occur: a campaign may look expensive in isolation while supporting product discovery and sales that reduce the overall TACoS burden. Neither metric should replace profit analysis. Use campaign profit to make the immediate decision, then use TACoS to assess whether the broader sales mix is becoming more or less dependent on advertising.
The ad-to-organic bridge begins with evidence in the advertising report, not with a ranking assumption. Review search terms and keywords for a combination of:
- Strong CTR, indicating that the query and the offer are earning attention.
- Strong CVR, indicating that the listing can convert relevant traffic.
- Meaningful order value or sales value, based on the report fields available for the account.
These signals identify terms worth testing more deliberately. They do not prove that a keyword will produce organic placement, and they should not be treated as a promise of first-page visibility.
For a term that combines reliable clicks, conversions, and commercially relevant order value, build dedicated activity around it. This can include keyword weighting in the listing title and visual assets, followed by tracking changes in CTR, CVR, attributed sales, and campaign ACoS. The purpose is to improve the listing’s relevance and conversion response while continuing to observe the advertising data. Listing changes should be evaluated through business reporting rather than assumed to work because the keyword was added.
Keyword relevance alone is not enough if the page fails to support the promise made by the search result. The jewelry account showed this clearly. The customer’s title covered more material terms and usage scenarios than the competitor’s, but the competitor placed the core product form and key decision cues earlier. The customer’s page also had stronger A+ depth, yet its technical and decorative story appeared before the practical proof buyers needed. A keyword can attract attention and still fail to create organic momentum when the resulting page does not convert the relevant traffic.
When ad data supports keyword selection and the listing converts the resulting traffic, two outcomes may develop at the same time: short-term ad scale and a possible improvement in organic visibility within Amazon. If organic sales later strengthen, total sales may grow without paid spend rising at the same rate, potentially improving the business-level TACoS. That is a conditional path, not a ranking guarantee or a target TACoS level. Keep Ads as the decision engine; treat Organic as a measured extension of proven ad signals.
FAQ
What is a good ACOS for Amazon ads?
There is no universal good ACOS. A campaign is acceptable only when its advertising cost remains compatible with the product’s contribution margin. Start with the selling price Amazon counts for attributed sales, then subtract the product’s true variable costs and other per-unit costs that apply before advertising. The amount left is the maximum ad cost the unit can absorb without losing money.
That creates a product-specific break-even ACOS line: break-even ad spend per unit divided by the attributed selling price. A campaign below that line may be profitable; a campaign above it requires correction or a deliberate strategic reason. The same ACOS can therefore be healthy for one product and destructive for another. Judge it alongside CVR, order economics, and the campaign’s effect on broader sales, not as a standalone benchmark.
Also ask whether the product page is converting the traffic efficiently enough to support that ACOS. A Listing can have strong reviews, a high content score, and polished visuals while still delaying the information that reduces purchase risk. In that situation, the first correction may be to improve the page’s decision path rather than to force the campaign toward an arbitrary ACOS target.
What is the difference between ACOS and TACOS?
ACOS measures advertising spend against sales attributed to the ads. It is primarily a campaign-efficiency metric: how much spend was required to generate the sales Amazon assigns to that campaign.
TACoS measures advertising spend against total business sales, including sales not directly attributed to advertising. It shows how much of the overall revenue base is being used to fund ads. Advertising reports can provide exposure, clicks, conversions, ACOS, and TACoS, allowing these metrics to be read together rather than in isolation.
A lower TACoS can indicate that total sales are growing faster than ad spend, but it does not remove the need to check contribution margin. Organic sales can improve the ratio while the advertised product still loses money per unit. Use ACOS to diagnose campaign economics and TACoS to understand advertising’s weight in the wider business.
Which Amazon ads can a small seller actually run?
Keep the practical scope focused on Sponsored Products. For a small catalogue or a thin-margin product, this keeps the decision around bids, budgets, targeting, attributed sales, and product-level contribution margin.
The operating question is not how many ad formats can be activated. It is whether a Sponsored Products campaign can acquire a sale at a cost the product can support. Review impressions, CTR, clicks, CVR, spend, attributed sales, ACOS, and the product’s margin per unit. Stable advertising signals may also reveal which product or visual features convert more effectively, giving the seller evidence for listing and merchandising decisions.
Should I lower bids when ACOS is too high?
Do not make a blanket bid cut the first response. Follow the remediation order: verify the product economics, then diagnose the campaign, targeting, listing, CTR, and CVR before deciding whether the bid is the real problem. A high ACOS may reflect weak conversion, poor traffic quality, inefficient targeting, or a product margin that cannot support the current acquisition cost.
If the campaign remains above its product-specific break-even line after those checks, reduce exposure through the appropriate correction or pause decision. Broad bid cuts are a last resort because they can reduce useful traffic without fixing the underlying cause.
A high ACOS combined with normal CTR and weak CVR deserves a page review. One jewelry seller initially treated persistent advertising pressure as a bid and creative problem even though the Listing scored well. The deeper review found that the page did not lead with the safety, comfort, fit, and after-sales information buyers needed. The appropriate response was to repair the conversion path before scaling or cutting traffic indiscriminately.
Why do attributed ad sales look bigger than my actual profit?
Attributed sales are revenue, not profit. Amazon assigns a selling price to the ad-driven order, but that figure does not contain your complete cost structure. It does not automatically show the product cost, fulfillment costs, fees, discounts, returns, or the contribution margin left after those obligations.
Convert attributed sales into margin per unit before evaluating ACOS. Multiply the number of attributed units by the contribution margin available before advertising, then compare that amount with ad spend. This conversion reveals whether the campaign is funding profitable demand or simply producing revenue that appears strong in the advertising dashboard.
The page can create another form of distortion: a paid order may be attributed correctly, while the page still fails to convert as efficiently as it could. In that case, the sales report shows what happened after the click, but not the trust or decision gaps that caused other paid visitors to leave without ordering. Profit analysis should therefore be paired with funnel and Listing diagnosis.
What to Do This Week
To decide whether an Amazon campaign is profitable, replace an isolated ACOS reading with product-level margin math and a controlled review cycle.
- Label every metric with its own denominator before interpreting it. Record “ACOS reported by Amazon Ads” as ad spend divided by ad-attributed sales, and keep TACoS separate as ad spend divided by total sales. If you also use ROAS, label it as ad-attributed sales divided by ad spend. Keep CTR, CVR, orders, spend, and profit per unit in separate columns so no ratio is mistaken for another.
- Compute a break-even ACOS line for each product before changing bids or budgets. Use the product’s contribution margin before advertising cost: the amount remaining from the sale after the product costs that belong in your calculation. Treat that percentage as the ceiling for direct ad efficiency, not as a universal target. A campaign can sit below one product’s break-even line and above another product’s line even when the displayed ACOS is identical.
- Open the campaign-level rows instead of judging only the account or monthly average. Review impressions, clicks, CTR, CVR, orders, spend, attributed sales, ACOS, and profit per unit by campaign and, where available, by placement. This is the practical test for “is my Amazon campaign profitable?”: identify which row is producing orders at an acceptable cost and which row is consuming spend without enough conversion.
- Review the Listing when traffic is relevant but conversion remains weak. Check whether the title, main image, bullets, detail page, and A+ content answer the buyer’s practical risks in the order they arise. A polished page or high Listing score does not prove that the page is a complete conversion engine. Strong reviews and attractive visuals can still underperform when safety, fit, durability, or after-sales reassurance appears too late.
- Clear wasting search terms before making a broad bid change. Sort the search-term report by spend, flag terms with a meaningful number of clicks but no purchase, and remove terms that are unrelated to the product through appropriate negative keywords. Then recheck the remaining terms for CTR, CVR, cost per order, and ACOS. Cleaning the query layer first helps separate traffic waste from a bid problem.
- Change bids and budgets in small increments, record the date and the exact change, and re-measure after 7–14 days. Compare the post-change clicks, conversions, spend, ACOS, and profit against the prior window rather than reacting to one noisy day. Keep the change only if the resulting traffic and conversion pattern supports the product’s break-even line; otherwise, return to the campaign, search-term, and Listing rows before making the next adjustment.
The central operating rule is simple: do not push more traffic into an unresolved economic or conversion constraint. ACOS tells you what the traffic cost. Profit tells you what remained. CTR and CVR help locate the leak, while the product page determines whether the traffic has a clear enough path to become a profitable order.