

Amazon Marketplace Size & Growth
Amazon remains a substantial, expanding marketplace, but its growth profile is increasingly defined by scale and maturity rather than easy entry. Third-party sellers now account for an all-time-high share of units sold, making independent sellers central to Amazon’s retail engine rather than peripheral participants. Seller Services has also become a major revenue business, reflecting the commercial infrastructure Amazon provides to merchants at marketplace scale.
Advertising reinforces the same shift. Amazon’s advertising revenue continues to grow, placing its advertising business among the largest global digital advertising platforms. For sellers, that expansion raises the cost of competing for visibility: higher ad spend must translate into stronger CTR, CVR, disciplined ACoS, and sustained BSR performance—not merely more impressions.
Declining new-seller registrations provide another maturity signal. Fewer new entrants do not reduce competition automatically; they indicate that the marketplace is moving from rapid seller acquisition toward a more established operating base. Amazon’s global workforce shows the physical scale behind this system as well, with the majority employed across operations and logistics rather than in corporate functions alone.
The operating implication is straightforward: marketplace scale no longer rewards entry volume by itself. Sellers compete through listing quality, inventory execution, account security, and the speed of each optimization cycle. Manual workflows—downloading assets, renaming files, logging into Seller Central, and uploading changes one by one—consume time that should be used to diagnose CTR and CVR gaps. DeepBI connects diagnosis, planning, production, and SP-API delivery, reducing a process that can take 30 minutes to seconds and shortening listing cycle time.
A listing review for a neem seed meal fertilizer illustrates why that operating speed matters. The page already had a real product, usable claims, customer feedback, and several content assets, but its presentation was not converting as effectively as a stronger comparable listing. The initial instinct was to add more product information and reinforce broad benefits. DeepBI’s comparison showed that the issue was more structural: the title delayed the core product term, the images repeated product identity, and the detail page did not answer practical buyer questions clearly enough. Faster execution is valuable only when it is attached to the right diagnosis.
Seller Demographics & Competition
Amazon competition is not a single global seller pool. It includes boutique sellers, established brands, large multi-SKU operators, and technology-oriented teams serving cross-border markets. The pressure is felt inside each leaf category, where products compete against a narrower set of relevant benchmarks—not every listing on Amazon. Category crowding can vary sharply by product form, price band, audience, review depth, and presentation quality.
FBA is widely treated as a core operating model because sellers need a repeatable way to handle fulfillment while competing on selection and delivery expectations. Yet FBA does not remove the need for operational control. Sellers still face cash-management strain, weak product-market fit, poor category selection, and rising acquisition costs. A product can generate impressions while producing weak CTR, low CVR, high ACoS, or declining BSR.
Successful sellers are therefore concentrated among operators that continuously monitor these signals and compare their listings with genuinely relevant leaders. DeepBI can identify the underlying leaf category, filter unsuitable benchmarks, and score gaps across the main image, title, bullets, A+ content, ratings, and reviews. A low CTR paired with a weak main-image score indicates a click-generation problem; weak CVR alongside poor detail-page and review scores points to a trust or product-fit problem.
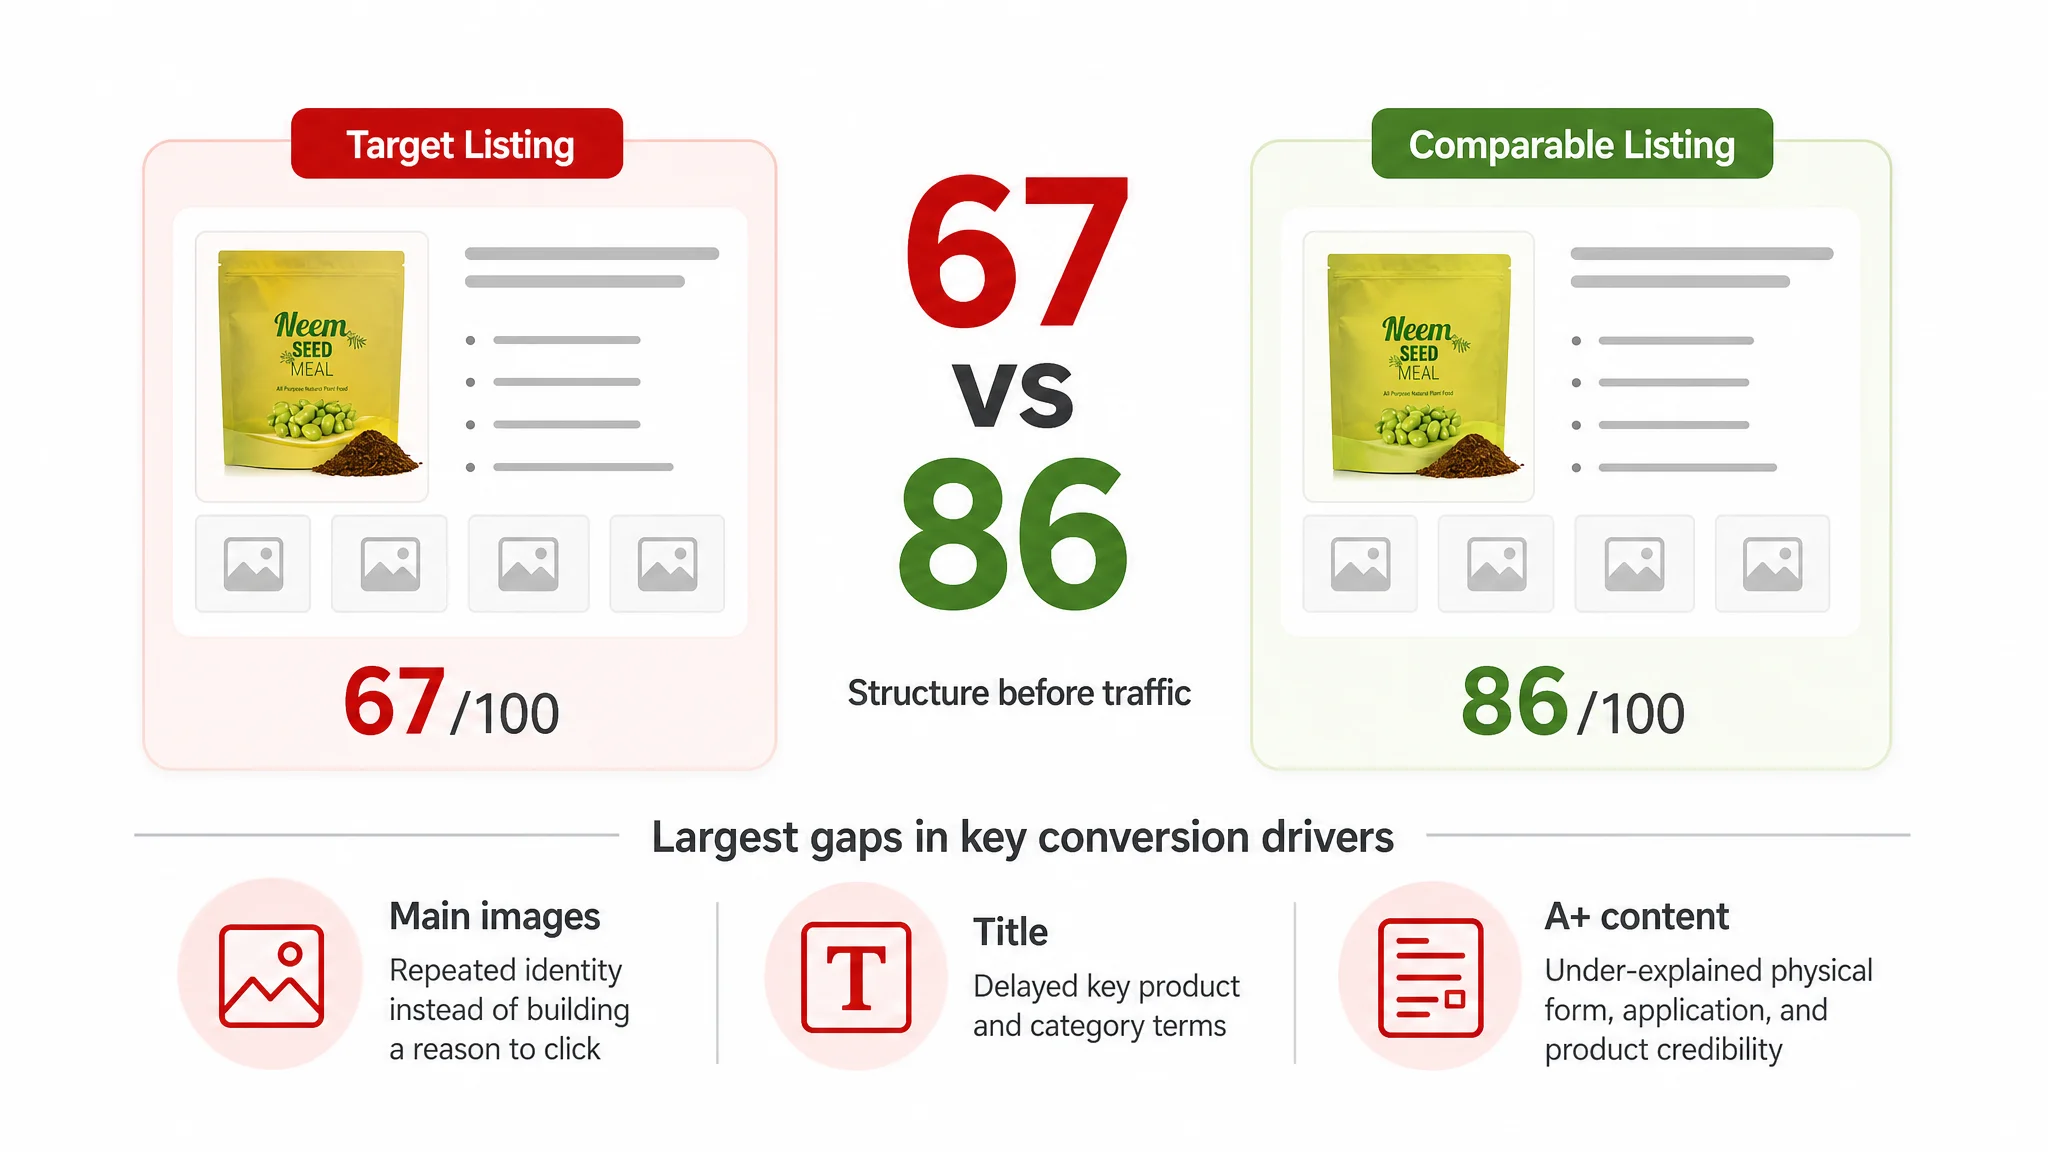
The neem seed meal fertilizer comparison shows why a relevant benchmark matters. DeepBI compared the target listing with a comparable high-performing listing in the same Amazon category rather than treating every gardening product as an equal reference. The target listing scored 67 out of 100, while the comparable listing scored 86. The largest gaps were in the main-image system, title, and A+ content, not in the existence of the product itself. That distinction prevented the team from reducing the problem to a general traffic shortage.
Account-enforcement pressure adds another risk layer. Noncompliant assets may be blocked, while excessive manual backend activity can increase security exposure. Standardized workflows through the official SP-API help reduce that operational risk. Data-driven sellers monitor compliance, cash efficiency, category fit, CTR, CVR, ACoS, BSR, and the cost of repeated ineffective optimization—rather than relying on one unsupported seller-exit statistic.
FBA Fees & Costs
FBA is not a single marketplace fee applied uniformly to every product. The cost of participating must be modeled at the ASIN or SKU level, using the applicable Amazon fee schedule for each product and category. A practical contribution-margin view should separate:
- Referral fees and other selling-related charges
- Fulfillment fees
- Monthly storage fees
- Long-term storage or aged-inventory charges
- Product cost, inbound transportation, and other landed costs
Fulfillment fees should be measured as a share of revenue, not treated as a constant percentage. A low-priced, large unit can carry a very different fulfillment burden from a compact, high-priced unit, even within the same category. That share directly affects the price required to support target margin and the ACoS a product can tolerate.
Storage is also a margin item. Inventory that moves slowly consumes space for longer, while aged units can create additional long-term storage exposure. Ignoring these costs can make a product appear profitable at the order level while weakening cash flow and contribution margin over the full inventory cycle.
Sellers should distinguish the current fee level from the direction of fee changes. The official schedule may show different movements by category, size tier, or service. Do not apply one blanket increase across standard and oversize products. Instead, update the model by product and category, then test pricing, reorder quantities, CVR, ACoS, and margin under each fee scenario. This turns fee changes into planning inputs rather than surprises after profitability has already deteriorated.
Cost discipline also affects how sellers interpret conversion problems. If a product has weak CVR, sending more paid traffic to the page can increase acquisition cost without fixing the underlying economics. In the fertilizer listing comparison, the page already contained product claims and usage language, but its unclear information order made it harder for shoppers to understand the product, its form, and its application. The diagnosis therefore focused first on conversion capacity rather than assuming that additional traffic would solve the commercial problem.
Advertising & PPC
As advertising revenue grows, more sellers compete for the same Sponsored Products placements. Winning impressions therefore depends less on simply raising spend and more on selecting traffic that can support acceptable CTR, CVR, and ACoS.
Search-led shoppers express intent through keywords and often compare products against a specific need. Browse-led shoppers discover products while navigating categories or related recommendations, so their intent is less explicit and their conversion path may require stronger visual and value communication. Treating both audiences as identical can dilute budgets across clicks that do not carry the same commercial potential.
CTR is a practical cost lever. A weak click-through rate can make each useful visit more expensive because impressions fail to generate enough qualified traffic. Sellers should use click-through benchmarks to identify which placements, queries, and listing assets deserve further investment, then concentrate spend where clicks are more likely to convert.
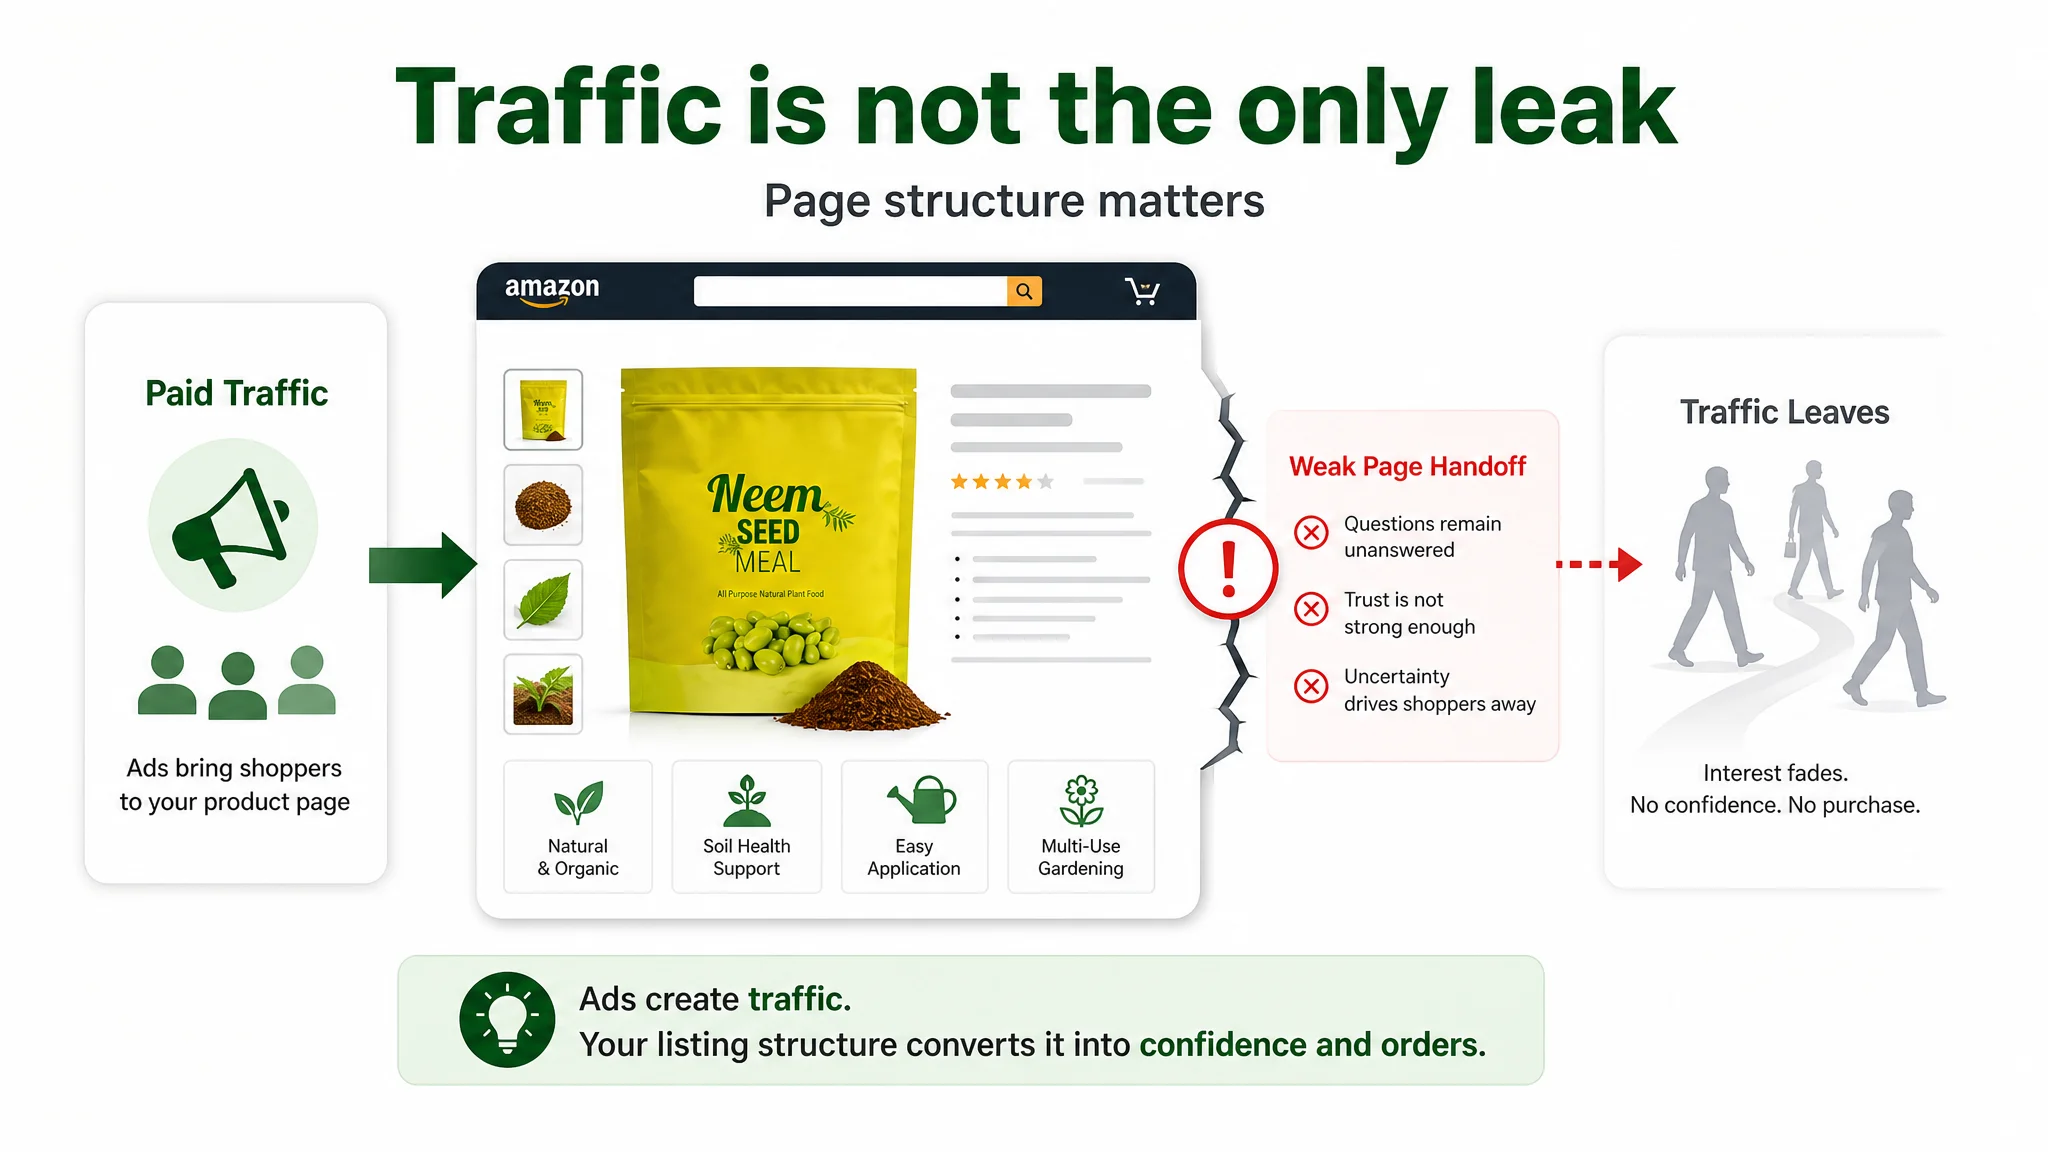
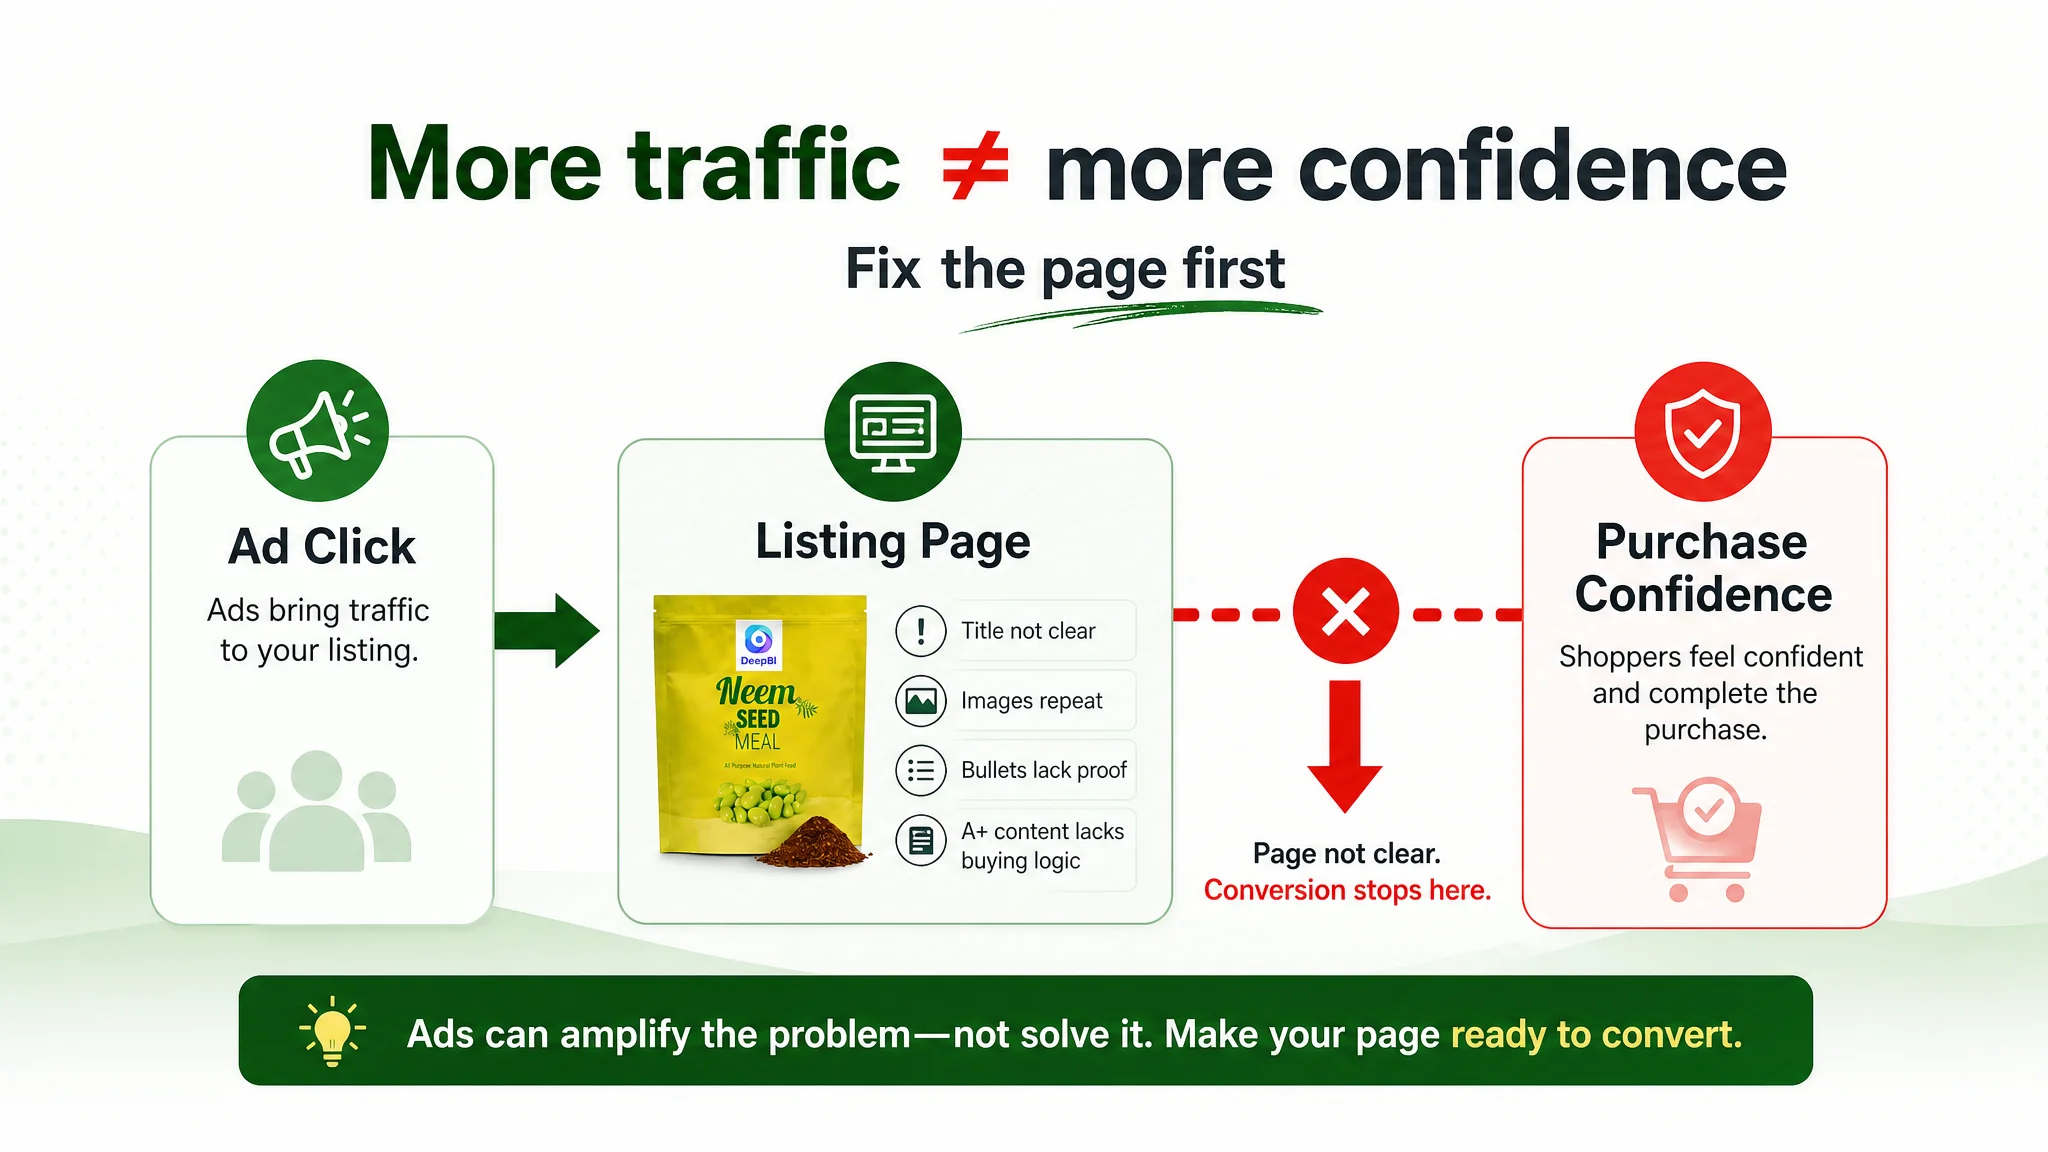
However, a weak result after the click should not automatically be classified as a keyword or bid problem. In the neem seed meal fertilizer case, the initial optimization direction could easily have been to add more product explanation, adjust advertising, or reinforce broad benefits. DeepBI instead found that the title delayed the strongest product term, the main images repeated package identity, the bullets did not consistently connect features to buyer concerns, and the A+ page did not sufficiently explain the product’s form or application. The practical issue was not simply whether traffic could be purchased. It was whether the page could turn that traffic into confidence.
ACoS and ROAS measure efficiency from different angles. ACoS shows ad spend as a percentage of attributed sales; ROAS shows the sales value generated for each unit of ad spend. Reading both prevents a seller from mistaking revenue growth for profitable growth.
DeepBI applies a four-layer Sponsored Products funnel: exploration discovers demand, screening removes weak traffic, precision concentrates spend on validated queries, and scaling expands proven opportunities. It then adjusts bids and budgets daily from the prior seven days of clicks, conversions, spend, and ACoS. This turns advertising benchmarks into operating parameters rather than static reporting: filter traffic, validate demand, and scale only where recent performance supports the decision.
The case also shows why advertising and listing analysis should be connected rather than managed as separate functions. If the page is unclear about what the product is, why it is credible, or how it should be used, bid changes may increase visits without resolving the conversion leak. Traffic optimization becomes more productive after the page has a clearer decision structure.
Conversion & Performance
Unit session percentage is the core conversion measure, but it should never be judged in isolation. Category, price, traffic mix, listing maturity, margin, CPC, and average order value all shape whether a CVR supports profitable growth and acceptable ACoS.
Pair conversion with traffic allocation. Compare click share with conversion share:
- High click share, low conversion share: the listing attracts attention but fails to close. The likely losses sit in the main image, offer communication, copy structure, information hierarchy, or trust signals.
- Low click share, high conversion share: the listing converts qualified visitors well but lacks visibility. Increasing relevant traffic may deserve priority before extensive listing reconstruction.
Review volume, rating distribution, and the structure of negative feedback are also conversion inputs. They can reveal trust barriers that a traffic report alone cannot explain.
The fertilizer listing provided a clear example of a conversion problem that was distributed across several page elements. The target listing scored 67 out of 100 against 86 for a comparable listing. Its title scored 14 out of 20, main images 19 out of 30, bullet points 6 out of 10, detail page and A+ content 19 out of 25, and reviews 9 out of 15. The largest weakness was the main-image system, followed by the title and A+ content. This distribution mattered because it showed that the page was losing persuasive power both at the click stage and later in the trust and usage decision.
DeepBI’s Listing engine acts as an automated market health check. It benchmarks the ASIN against highly competitive, semantically similar reference ASINs selected with product-form, price-band, audience, and market-validation constraints. Its audit identifies gaps across copy, visual expression, A+ coverage, attribute completeness, and review signals, then ranks weaknesses by likely impact rather than returning only a total score.
The resulting Optimization Plan converts diagnosis into executable changes for main-image hierarchy, title and bullet ordering, A+ module coverage, and visible attribute completeness. Approved visual and A+ assets can then be synchronized through SP-API, reducing listing cycle time from manual upload work to seconds; text recommendations remain structured for controlled implementation. Track subsequent CTR, CVR, ACoS, and BSR changes to validate the fix before adding more spend.
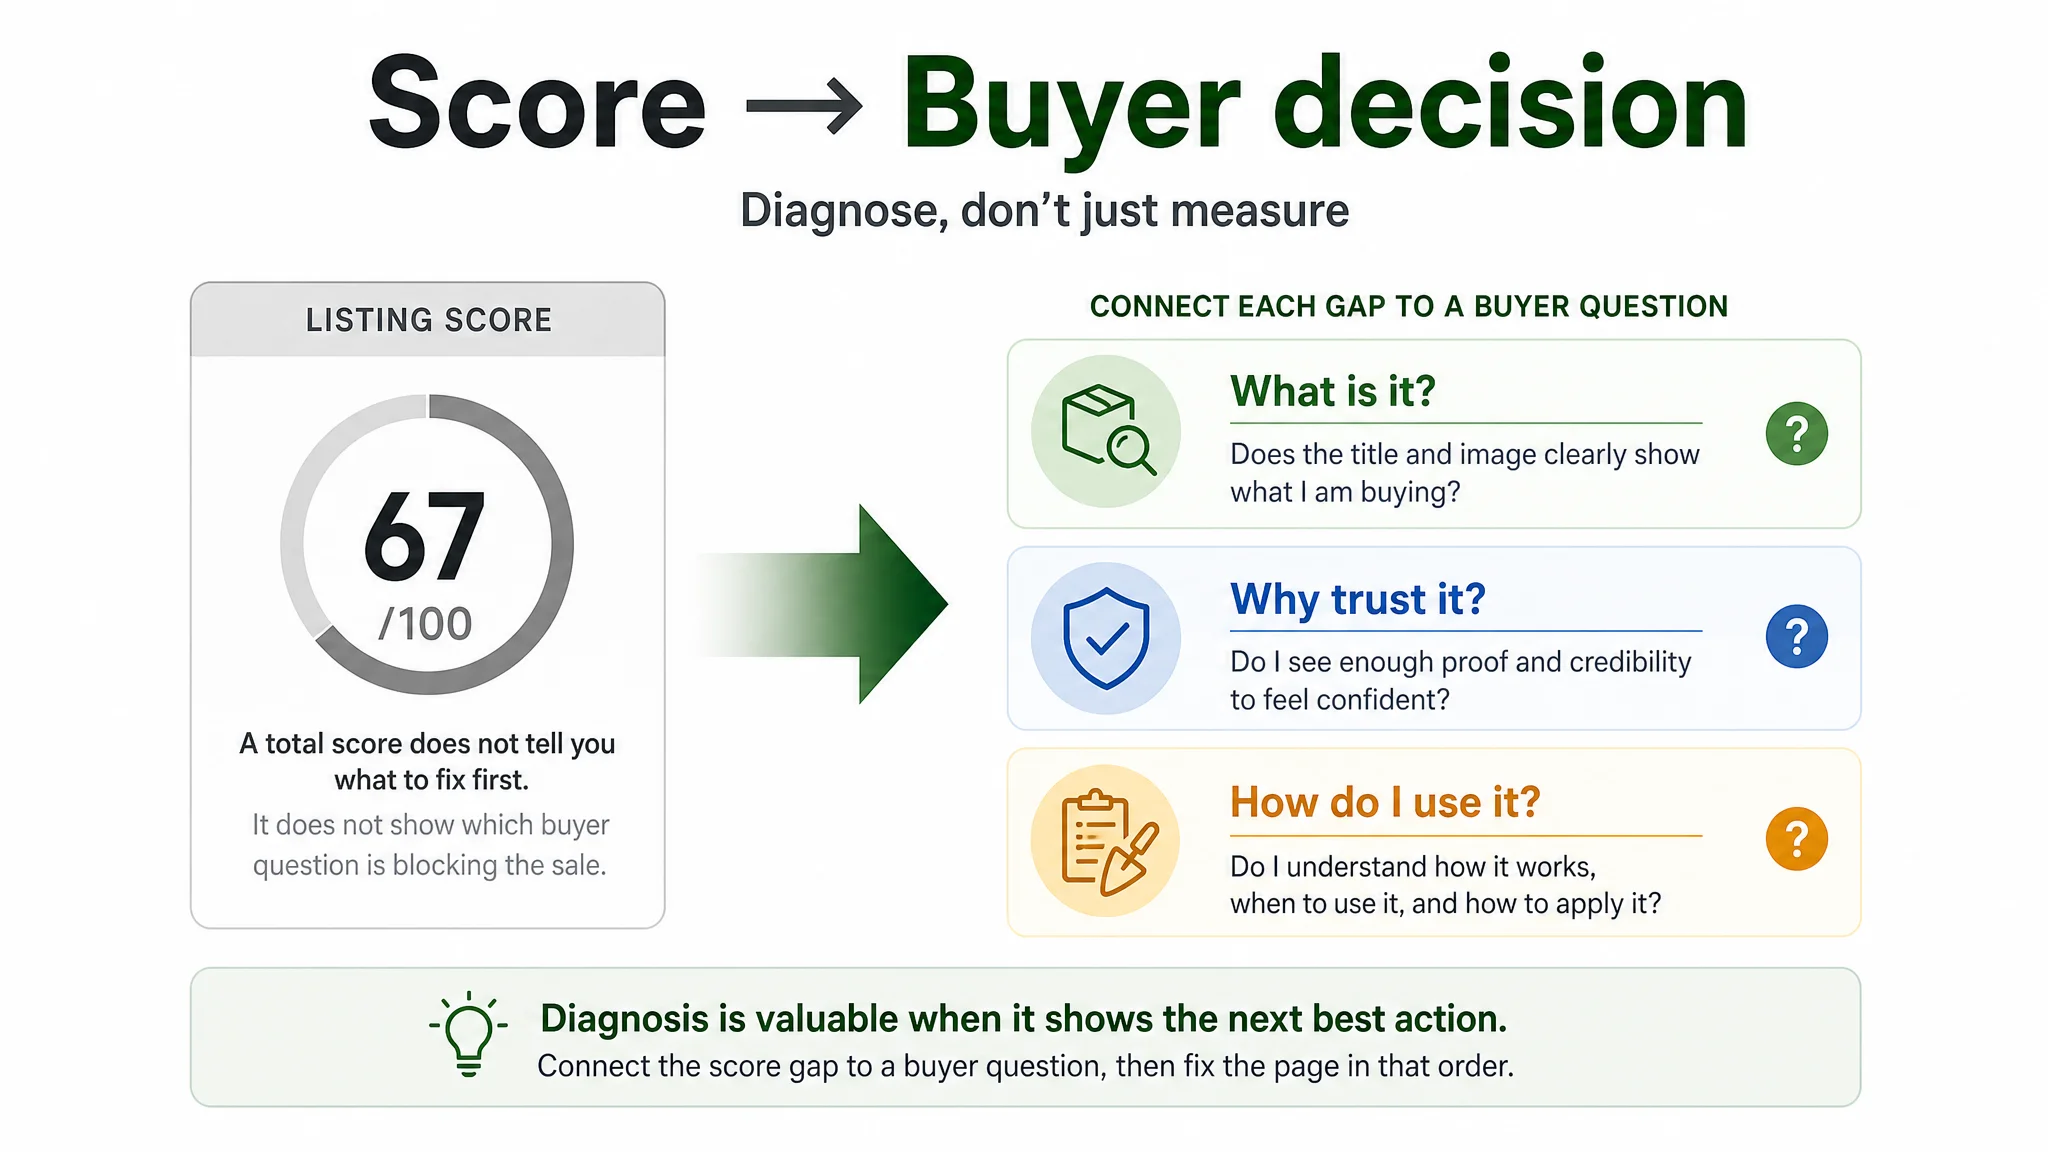
The key is to interpret the score as a decision guide, not as the diagnosis itself. A total score of 67 does not explain whether the first action should be a title rewrite, a new main image, a usage guide, or stronger trust content. The useful analysis comes from connecting each gap to a buyer question and then measuring whether the resulting change improves the relevant performance signal.
Returns & Refunds
Returns are not merely an operations issue. They are a direct margin line item: the seller absorbs the refund while potentially losing outbound fulfillment, return shipping, inspection, repackaging, disposal, and resale value. A product can maintain acceptable CTR, CVR, and ACoS while still weakening profitability if its return burden is hidden inside aggregate order data.
Return rates also vary sharply by category. Apparel and footwear typically sit at the high end because fit, sizing, and expectation gaps create more returns than many hard-goods categories. The marketplace-wide benchmark should therefore be reported as a range, not treated as a universal target. However, the available source material does not provide a defensible numeric range or a validated estimate of how much return-related cost consumes from net margin. Those figures should be inserted only from a defined marketplace and category data set.
Sellers should monitor:
- Return rate by SKU, ASIN, category, size, and traffic source
- Refund value and return-related cost per order
- Return reasons, especially fit, damage, and product-not-as-described
- Refund-adjusted contribution margin
- Resale, liquidation, and inventory write-off rates
- The relationship between returns and CVR, ACoS, BSR, and listing changes
For products where usage or physical form may be misunderstood, listing clarity can also influence expectation gaps. In the fertilizer example, shoppers could still be uncertain whether the product was a processed neem meal powder, a pellet, or something closer to raw seed material. The recommended A+ structure therefore made the product form and application method more explicit. This does not prove a particular return reduction, but it shows how listing content can address a source of uncertainty before it becomes a post-purchase problem.
Fraud and abuse should remain a separate control category rather than being blended into ordinary return behavior. DeepBI can support a data evidence chain by connecting seller performance indicators with advertising and diagnostic data, helping teams identify where return pressure is eroding contribution margin and which listing or product decisions require review.
Inventory & Fulfillment
Amazon growth can improve BSR while worsening liquidity. The constraint is not demand alone; it is whether inventory can move through storage, sales, settlement, and replenishment without exhausting cash.
Inventory Performance Index (IPI) functions as an access gate to storage capacity. A commonly used healthy band is 500–1,000. When the score falls below 500, Amazon may impose storage limits, making it harder to bring in the inventory required to support higher demand. Treating 500 as a planning floor is safer than managing only after capacity has been restricted.
Slow-moving units create a second financial constraint. They consume storage space, incur carrying costs, and lock cash that could fund replenishment or advertising. If a seller increases stock to protect CVR and avoid lost sales, but sell-through remains weak, the resulting cash conversion cycle can lengthen:
Cash conversion cycle = inventory holding period + receivables period − payables period.
Amazon payment timing must be modeled by account and program rather than assumed to follow a fixed 14-day cycle. Other disbursement options may exist for eligible sellers, but the operating question remains the same: when does revenue become usable cash?
Monitor IPI, sell-through, aged inventory, storage utilization, inbound lead time, and expected disbursement on a defined weekly cadence. Use these signals together before increasing purchase orders or ad spend. DeepBI’s image-asset workflow does not inherently analyze inventory, storage, orders, or payment timing; any Amazon-only operating model must receive explicit access to the relevant seller data.
The same separation applies to listing diagnosis. A page that is not converting effectively may appear to need more inventory or more advertising, but that conclusion should follow evidence rather than replace it. In the fertilizer listing, the primary constraint identified by the comparison was the page’s decision architecture, not a documented inventory shortage. Inventory planning and content optimization should therefore remain connected to the right operating signal.
Profitability & Margins
Revenue is not profit. Fulfillment fees, referral fees, advertising spend, discounts, returns, and product cost must be reconciled before an ASIN earns a place in the scale plan. As a working benchmark, fulfillment and referral costs together can consume roughly 30%–45% of revenue, leaving a narrow net-margin band—often about 10%–20% after major operating costs. Treat these as diagnostic ranges, not universal rules; category, size tier, price, and fulfillment model can shift the result materially.
Cash flow requires a separate view. Suppose a seller records $100,000 in monthly sales and $12,000 in accounting profit. If $25,000 of inventory purchases, $8,000 in advertising prepayments, and $5,000 in fee or logistics settlements leave the account during the same period, cash movement is negative by $26,000 despite the profitable income statement. Growth can therefore create a funding gap before it creates usable cash.
ACoS measures ad spend against attributed ad sales. Spending $10,000 to generate $50,000 in ad sales produces 20% ACoS. TACoS measures that same spend against total revenue: at $100,000 total revenue, TACoS is 10%. A disciplined 20% ACoS can still be unprofitable if total advertising remains too large relative to total sales and margin.
Use rough TACoS signals operationally: mature products may target below 10%, while growing products may tolerate roughly 10%–20% while building demand. DeepBI can support daily bid and budget adjustments using the prior seven days of clicks, conversions, spend, and ACoS. Pair those actions with margin and cash reviews so lower ACoS does not mask weaker economics.
The fertilizer listing comparison reinforces another profitability principle: conversion work should be prioritized by likely commercial impact, not by the easiest asset to edit. The target page did not simply need more generic benefits. It needed a clearer title, a more useful image sequence, better application guidance, and stronger expectation management. Repairing these controllable weaknesses before scaling traffic helps prevent advertising spend from being used to amplify an inefficient page.
Top Categories & Trends
Amazon demand and competition rarely distribute evenly across a broad category. Third-party unit share may concentrate in a small set of subcategories, product forms, or price bands, while the category average blends together products that shoppers do not genuinely compare. A broad benchmark can therefore hide the mechanism driving sales.
Start with the product’s underlying leaf category, or Node, then build the comparison set around similar function, form, audience, usage scenario, and price range. DeepBI’s category-aware benchmarking follows this approach rather than treating every ASIN in the parent category as a valid peer. The consequence is practical: a low CTR against visually stronger leaders calls for better content and visual communication, while a weak CVR alongside poor information density or trust signals calls for richer listing content and stronger proof.
The fertilizer comparison demonstrates the value of this approach. A comparable gardening listing did not merely provide a reference for keywords. It revealed how a stronger page organized product identity, weight, use cases, trust signals, nutrient information, and application guidance. The target listing’s 19-point gap was therefore interpreted as a difference in decision structure, not as proof that every competitor claim should be copied.
Category structure also determines whether price or presentation deserves priority. Scene-led, premium, or information-dense categories often reward sharper images, clearer use-case communication, and stronger A+ organization. Categories with wide price dispersion require price-band and value-positioning analysis before an operator changes creative direction.
Availability adds another demand signal. Persistent out-of-stock patterns within a defined category sample and time window can reveal where demand is pressing against supply, but that observation must not be generalized to every catalog. Use availability alongside BSR, impressions, CTR, CVR, and price data. Attention should follow the dominant mechanism: content where leaders win through communication, price where value gaps drive choice, and inventory where demand is being lost through limited availability.
Prime Day & Seasonal Events
Prime Day and other major retail events compress a large share of potential demand into a short selling window. Treat the scale as an operating variable, not a headline: measure prior-event units, revenue, traffic, CTR, CVR, ACoS, and BSR movement by ASIN, then compare the event window with matched non-event days. External estimates of United States online spending during an event should not be presented as Amazon’s global event sales.
Third-party sellers are active participants in these peaks, so visibility and availability become competitive constraints. A strong offer cannot convert demand if inventory runs short, replenishment timing is uncertain, or advertising budgets stop before the highest-intent traffic arrives. Before the event, set an inventory position from expected unit velocity and lead time, protect budget for priority ASINs, and define acceptable ACoS and minimum stock thresholds. Advertising plans should align bids and budgets with the products most likely to defend CTR, CVR, and BSR.
Seasonality is therefore a forecasting discipline rather than a calendar reminder. Build a repeatable pre-event forecast, record assumptions, and revise them using actual demand.
The post-event readout should separate incremental sales from paid traffic effects, identify changes in CTR, CVR, ACoS, and BSR, and document stockouts or budget constraints. DeepBI can support the listing-performance feedback loop by connecting impressions, clicks, conversions, CTR, CVR, TACoS, and ACoS with listing changes. It can also anchor a visual iteration in the advertising report, allowing subsequent performance to be reviewed against the change. Use those findings to adjust the next event’s inventory assumptions, creative priorities, and advertising allocation.
The case illustrates why that feedback loop should evaluate page readiness before a high-traffic period. The fertilizer listing’s main images repeated product identity instead of guiding shoppers from recognition to trust, mechanism, and usage. Increasing traffic during a compressed event window without addressing that sequence could make the cost of weak conversion more visible without resolving it. Event preparation should therefore include a review of the page’s ability to answer buyer questions quickly.
Brand Building & Content
Brand assets should be treated as compounding conversion infrastructure, not decoration. Strong visual identity, compliant product communication, and deeper detail-page content can support CVR over time while giving advertising traffic a stronger destination. Brand Registry is the prerequisite for brand-protection tools and enhanced-content capabilities, so it should be established before building a broader brand-content system.
A+ Content is both a conversion surface and a differentiation surface. The question is not whether a page contains A+ modules, but whether it covers the information required to overcome buyer hesitation: product introduction, core benefits, pain-point resolution, trust proof, and usage guidance. DeepBI evaluates A+ fullness and high-value module coverage, including comparison tables and authority or certification proof. Its six-module optimization structure provides a disciplined way to identify missing functions rather than adding content at random.
The fertilizer page showed the difference between having A+ modules and using them as a decision system. Its modules included selling-point imagery, application scenes, functional icons, and benefit lists, but the progression between them was weak. The page did not sufficiently clarify whether the product was a processed neem meal powder, a pellet, or a raw seed material, and it did not make the primary application method clear enough. The issue was not an absence of content. It was that the content did not answer new questions in sequence.
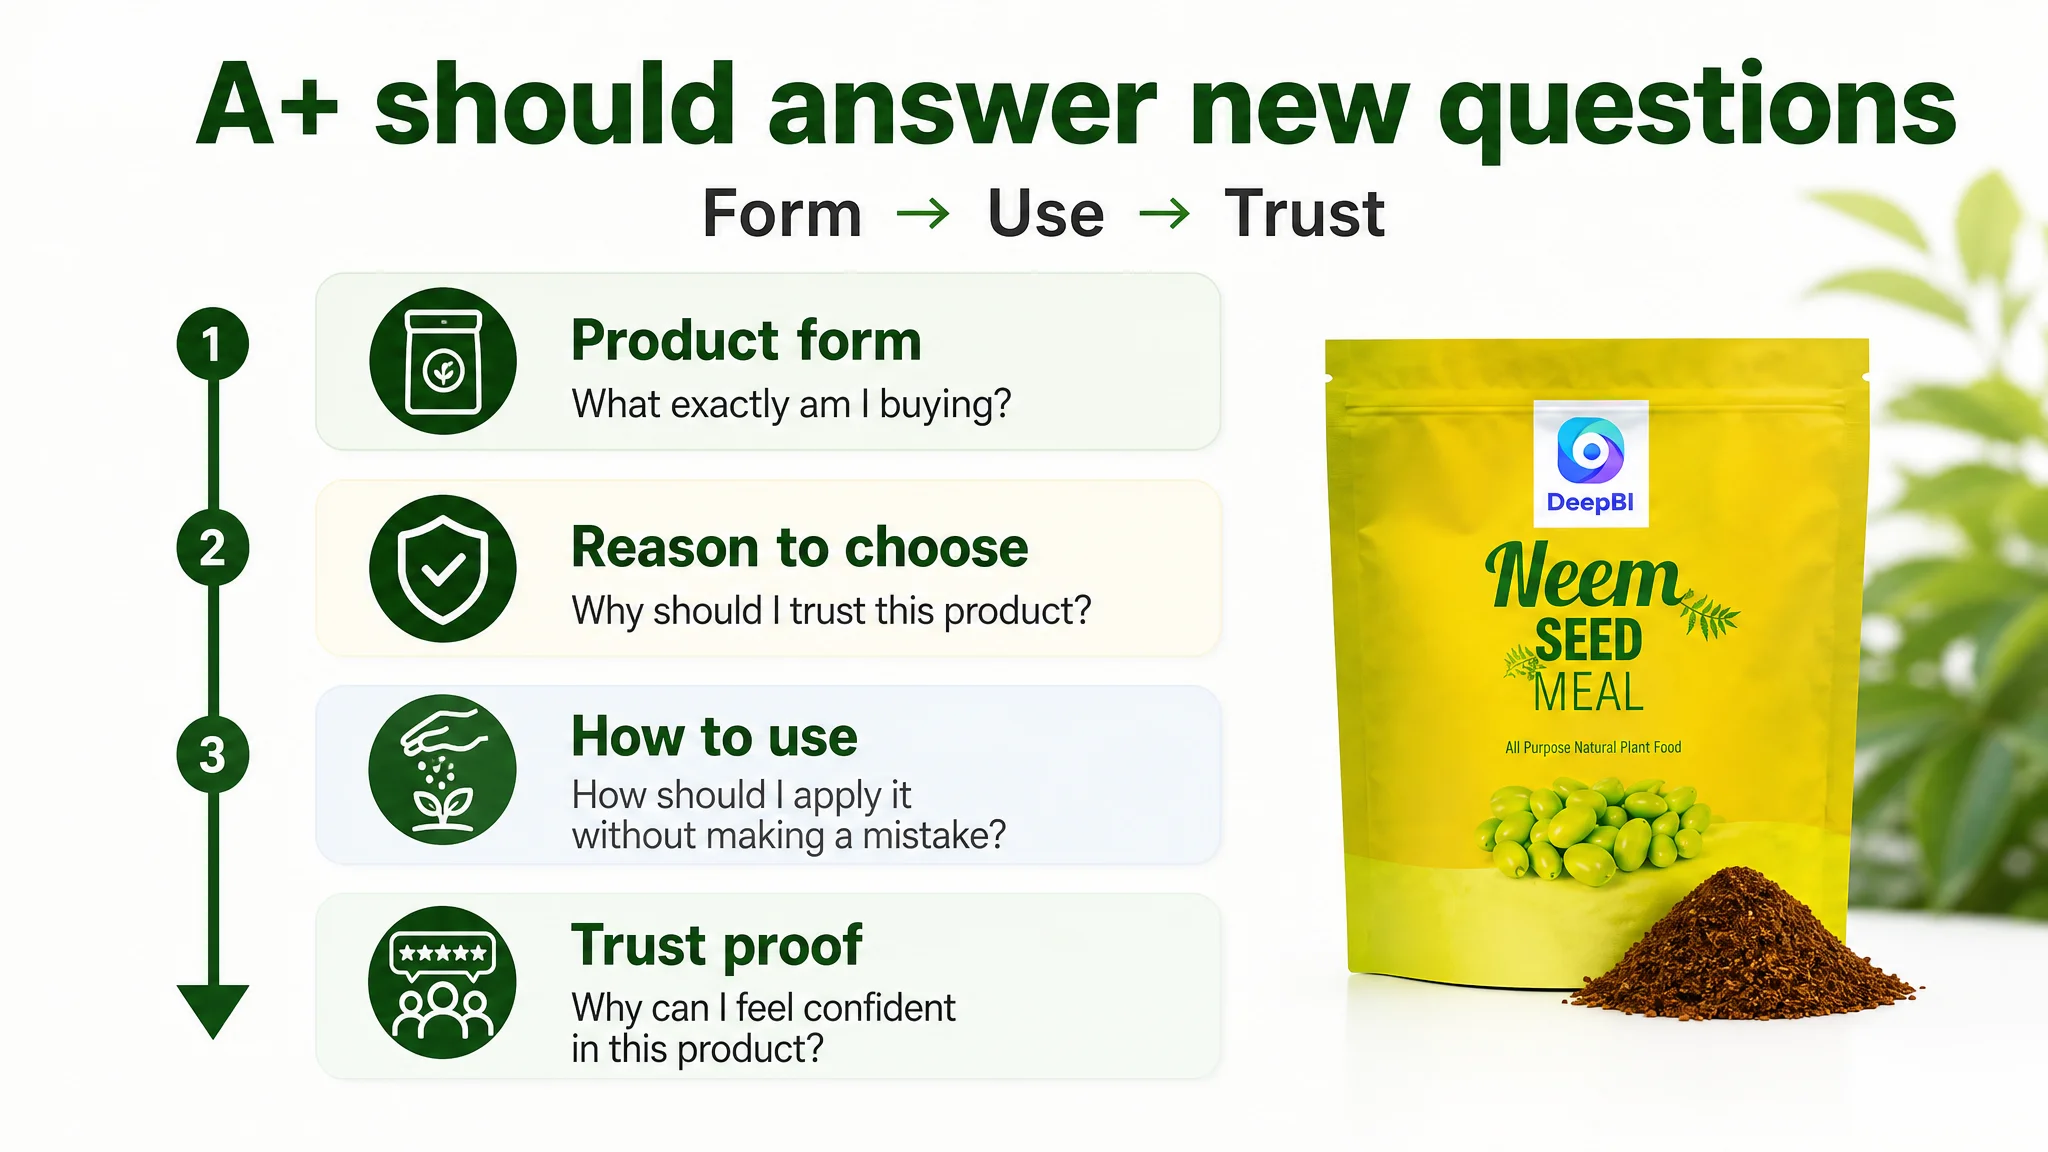
A stronger A+ structure would move through:
- What the product is and what form the buyer will receive
- Why the product is worth choosing
- How to use it in the primary application
- Which gardening scenarios it supports
- What the longer-term mechanism is
- Which verified trust signals support the purchase
Content depth should be benchmarked against closely matched competitors by product form, function, price band, audience, and market validation. A layout gap is commercially relevant when a competitor explains benefits, use cases, or trust evidence that the target page leaves unclear. Close those gaps with verified claims only; unsupported specifications or certifications can create compliance risk.
The target fertilizer listing had a lower average rating than the comparable listing, but its review base was not uniformly weaker. It had more visible review volume and a lower first-page negative-review rate, while the comparable listing had a greater proportion of reviews containing images, video, or detailed descriptions. This made the diagnosis more precise: reviews contributed to trust, but they were not the first controllable bottleneck. The page’s own explanation and usage structure required attention before treating reviews as the sole solution.
Reviews remain a conversion signal, not a content-management shortcut. Track star distribution, review-count gaps, and the trust contribution of high-quality image reviews without overstating what review tooling can do.
Sequence changes against advertising data. Weak CTR points first to the main image and other traffic-entry assets. Weak CVR alongside A+ or review gaps calls for stronger detail-page depth before, or alongside, further traffic scaling—protecting ACoS while improving the listing’s ability to convert demand.
International & Cross-Border Selling
International expansion is not automatically a growth move. It is a margin decision: incremental demand in another Amazon marketplace must cover the additional costs of reaching, serving, and operating that market.
Marketplace economics can differ materially. Referral and fulfillment fees, taxes, duties, currency exposure, localization, and advertising costs can change contribution margin even when the product sells at a similar price. Inventory and compliance requirements also add operational complexity. Managing multiple Amazon marketplaces creates more listing versions, creative assets, keyword sets, reporting cycles, and publishing work. A lower listing cycle time helps, but it does not replace marketplace-level profitability analysis.
Demand must be evaluated separately rather than treated as a global average. A marketplace may produce impressions without sufficient clicks or orders, while local search behavior and product priorities can change the relationship between CTR, CVR, ACoS, and BSR. DeepBI can support this diagnosis within Amazon by connecting marketplace-specific listing conditions with impressions, clicks, orders, CTR, and CVR. Its localized marketplace context and advertising-data keyword weighting can help identify which terms, images, and product attributes deserve attention. Through Amazon’s official Selling Partner API, it can also support cross-site distribution of listing visual assets, with the workflow focused on image-asset management unless additional authorization is granted.
The fertilizer listing also shows why localization should address decision clarity rather than only translation. Product form, application method, supported gardening scenarios, and trust language must remain understandable in the target marketplace. A page that simply carries over broad benefits may still leave shoppers uncertain about what they will receive or how to use it. Localization should therefore preserve the sequence of product meaning, proof, mechanism, and action.
Before expanding, measure marketplace-level contribution margin, demand, ACoS, CTR, CVR, BSR movement, fulfillment and localization costs, and the operating time required to maintain the listing. Expansion is justified only when the demand signal and resulting margin exceed those added requirements.
Track These Metrics for Your Own Store
Turn benchmark data into a short operating routine rather than a monthly reporting exercise. Review metrics by decision priority:
- Demand capture: unit session percentage and conversion rate. A movement in either metric can point to a traffic-quality, listing, or offer problem affecting CTR and CVR.
- Advertising economics: ACOS, TACOS, and advertising share of revenue. Track whether additional spend is producing proportionate sales and whether effective spend is expanding.
- Operational risk: return rate, Inventory Performance Index, and cash conversion cycle. These reveal whether growth is creating avoidable inventory pressure, customer dissatisfaction, or working-capital strain.
Set explicit thresholds for each metric before reviewing the dashboard. For example, DeepBI materials identify CTR below 0.35% as a potential main-image weakness and CVR below 7% as a potential detail-page or trust-signal weakness. Your own store thresholds should define when to investigate, pause, adjust, or escalate. Analytics should function as an early-warning system: compare movement against those limits, identify the likely cause, and assign an action before a weak trend becomes a material loss.
A listing audit should be read in the same way. The fertilizer page’s 67-point score was useful because it identified a pattern across title, images, bullets, A+ content, and reviews. The largest gap was not treated as an isolated design issue. It was connected to the buyer journey: delayed product meaning affected search clarity, repeated images weakened differentiation, incomplete usage guidance increased uncertainty, and A+ content did not fully support trust. This is the difference between observing a score and turning it into an operating decision.
DeepBI uses Amazon-only data through Amazon’s official SP-API foundation. With Amazon store authorization, it diagnoses performance, proposes strategy, executes approved or configured changes, and continues the feedback loop. Its daily bid and budget adjustments use the prior seven days of clicks, conversions, spend, and ACOS. Evaluate the result through ACOS, ROI, and the share of spend classified as effective.
The seller sets the objective and operating boundaries. DeepBI analyzes the data, executes changes, and iterates from the observed response. That division replaces impression-led management with a repeatable Amazon decision loop.
Frequently Asked Questions
How large is the Amazon marketplace, and how fast is it growing?
Amazon is a global marketplace operating at hundreds-of-billions-of-dollars scale, with the corrected growth rate established earlier in this article. The implication is practical: marketplace maturity makes operational discipline, not simple entry volume, the primary competitive lever.
That discipline includes diagnosing whether a weak result is caused by traffic, listing quality, trust, inventory, or margin. A product page can have information, reviews, and advertising activity while still losing conversion because those elements do not form a clear buying sequence.
What is a good ACOS relative to product margin?
A good ACOS is one that leaves enough gross margin to cover fulfillment, referral fees, returns, overhead, and profit; there is no universal target detached from product economics. The implication is to set ACOS against contribution margin, then monitor TACOS to confirm that advertising is not consuming the business.
A weak CVR should not automatically lead to more aggressive bid changes. If the listing does not clearly explain the product, establish trust, or show how it should be used, additional traffic may increase spend without improving the underlying economics.
How does FBA adoption compare with other fulfillment methods?
FBA remains the dominant fulfillment method among sellers, while merchant-fulfilled models serve a smaller but strategically relevant share of offers. The implication is to compare fulfillment choice by fee burden, delivery performance, inventory control, and its effect on conversion.
Fulfillment analysis should be paired with listing analysis. Even when FBA provides a reliable delivery model, the product page still has to communicate what the buyer is receiving and why it is worth purchasing.
How significant are returns to net margin?
Returns are a material margin line, with apparel and footwear at the high end of the marketplace-wide return range established earlier; related costs reduce net margin even when the original sale was profitable. The implication is to track return rate and return cost by category rather than treating returns as a general customer-service expense.
Clear product-form, usage, and expectation-setting content can help reduce avoidable uncertainty, although no listing audit alone proves a specific return-rate change. The right practice is to connect listing changes with return reasons, refund-adjusted contribution margin, and subsequent customer feedback.