

Why the Amazon Logistics Network Is Now a Strategy Problem for Sellers
Fulfillment is no longer a single-channel purchasing decision. It is a network allocation problem: each SKU can be routed through different nodes, including Fulfillment by Amazon (FBA), Amazon Warehousing and Distribution (AWD), third-party logistics providers (3PLs), and operations eligible for Seller Fulfilled Prime (SFP).
Each node has a different cost profile and risk exposure. FBA may simplify Prime delivery and reduce internal handling, but dependence on one network can increase disruption exposure. AWD can support upstream inventory positioning, while a 3PL may provide greater control over storage and order routing. SFP-eligible operations can add flexibility, but require reliable seller-side execution and service discipline.
The wrong objective is to minimise the visible unit fulfillment cost for every order. A lower unit cost can be offset by stockouts, emergency transfers, slower replenishment, excess safety stock, or working capital tied up in the wrong location. Conversely, building maximum redundancy can raise carrying costs without improving the economics of every SKU.
The practical question is therefore SKU fit, not vendor loyalty. Evaluate demand stability, margin, size, velocity, service requirements, inventory risk, and replenishment constraints. Compare total cost across the network, including storage, handling, transportation, stockout exposure, and capital tied up in inventory.
Fulfillment decisions also affect the economics of the traffic a seller is buying. A product can have enough advertising visibility and still underperform if inventory availability, delivery expectations, or the product page weaken conversion. In one US Amazon fashion operation, the team initially treated rising ACOS and unstable orders as an advertising problem. Ads were generating visits, but a listing comparison showed that the page scored 62/100 against a comparable competitor at 78/100. The gap was concentrated in title logic, main-image sequencing, bullet-point persuasion, and A+ structure rather than traffic volume.
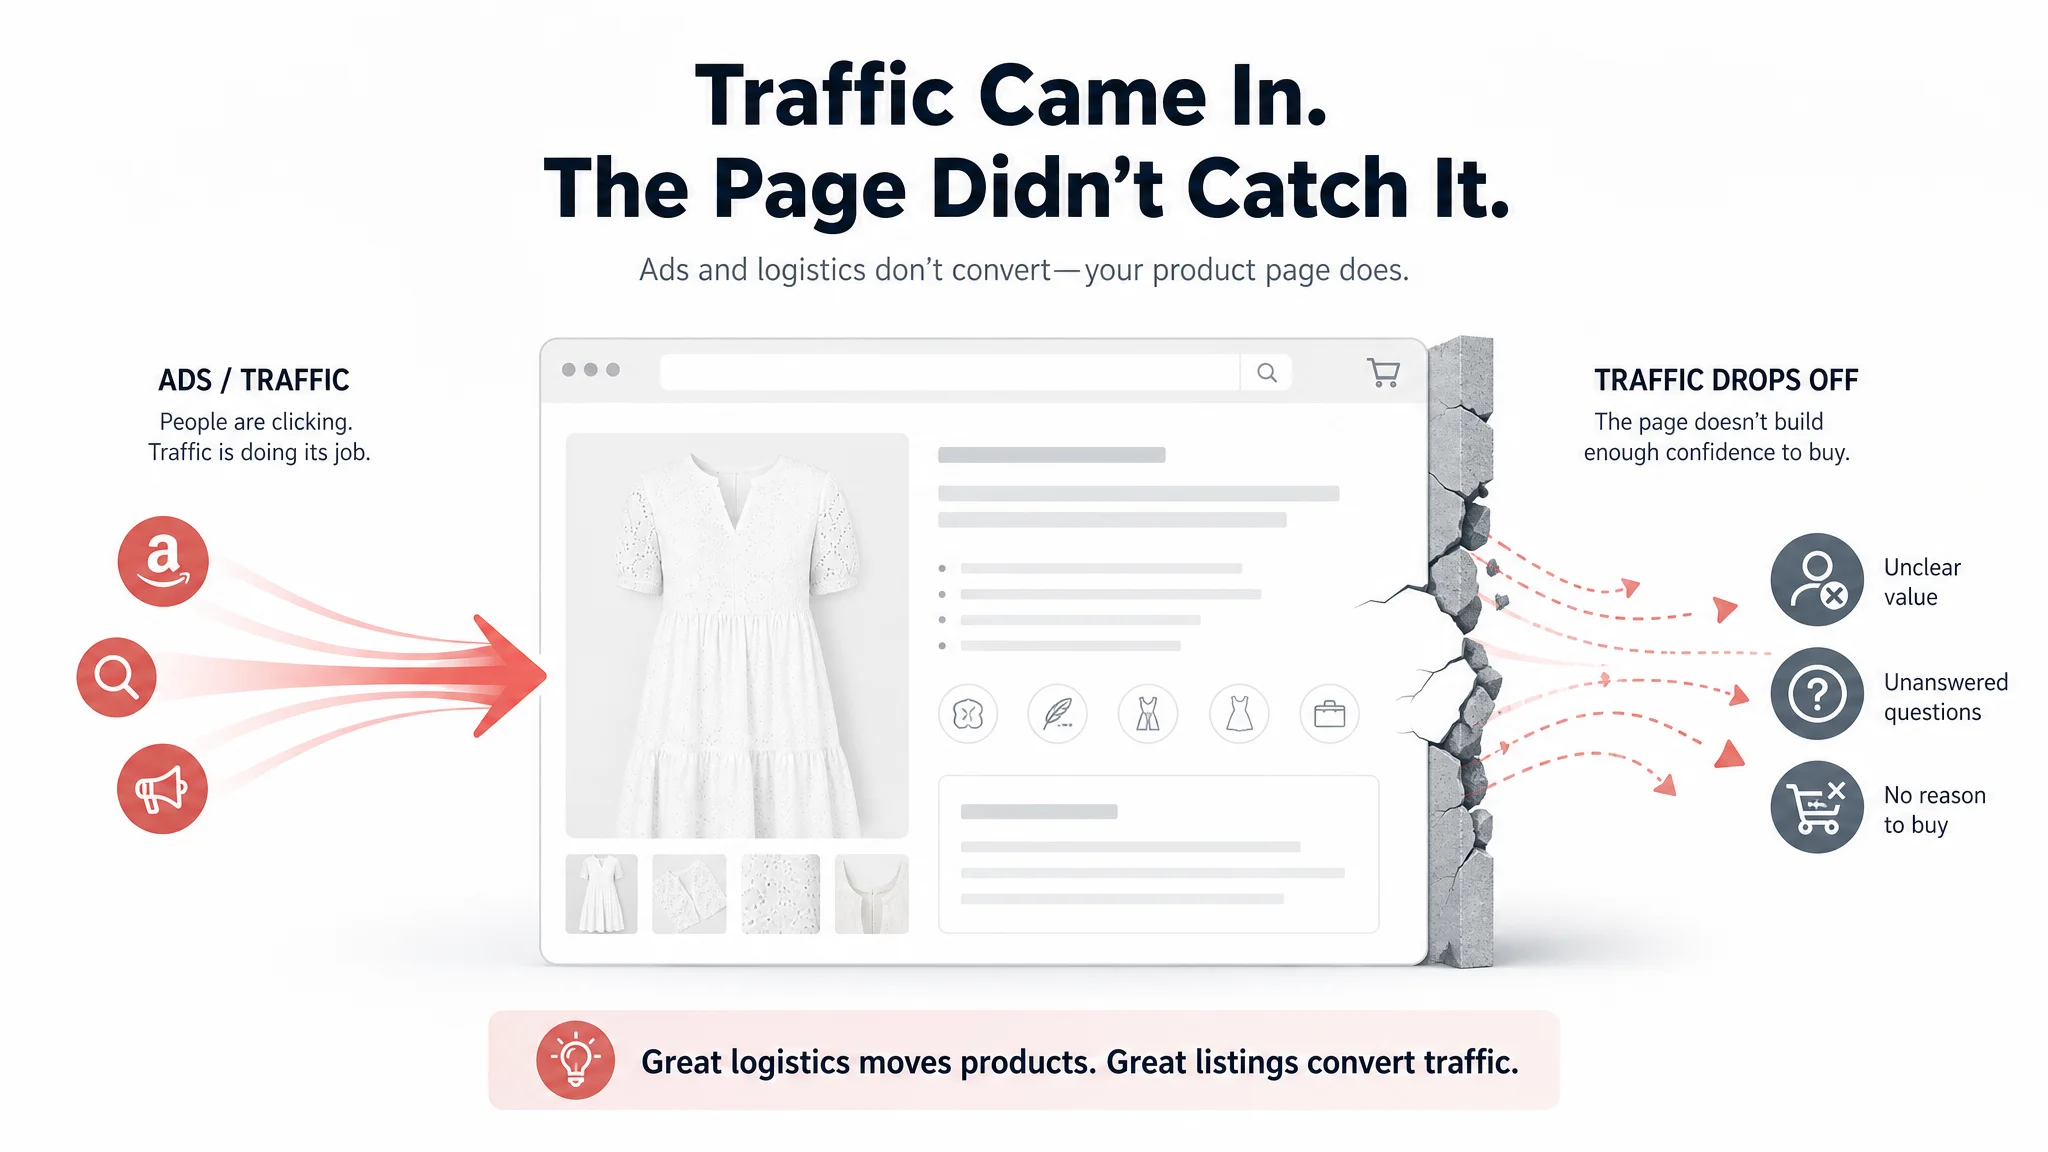
That example does not turn listing performance into a fulfillment metric. It does show why logistics should be evaluated as part of a wider operating system. Traffic, inventory availability, delivery reliability, listing conversion, and advertising efficiency can reinforce or undermine one another. A cheaper fulfillment node is not necessarily economical if it creates the conditions for stockouts, slower service, or weaker conversion.
What Is Fulfillment by Amazon (FBA)?
Fulfillment by Amazon (FBA) places a seller’s inventory inside Amazon’s fulfillment network. For eligible FBA orders, Amazon stores the units, picks and packs each order, ships it to the customer, and handles related customer service. This gives sellers a standardized operational layer and supports delivery-speed expectations associated with Amazon’s customer experience, including access to Prime-relevant benefits when eligibility requirements are met.
FBA is convenient, but it is not cost-free or fully controllable. The seller remains exposed to fees connected with storage duration and inventory health, so slow-moving units can create pressure even when sales volume appears acceptable. The seller also gives up some control over packaging decisions and over how inventory is positioned or routed across fulfillment nodes. Those trade-offs can affect unit economics, replenishment choices, and the ability to tailor fulfillment around product-level requirements.
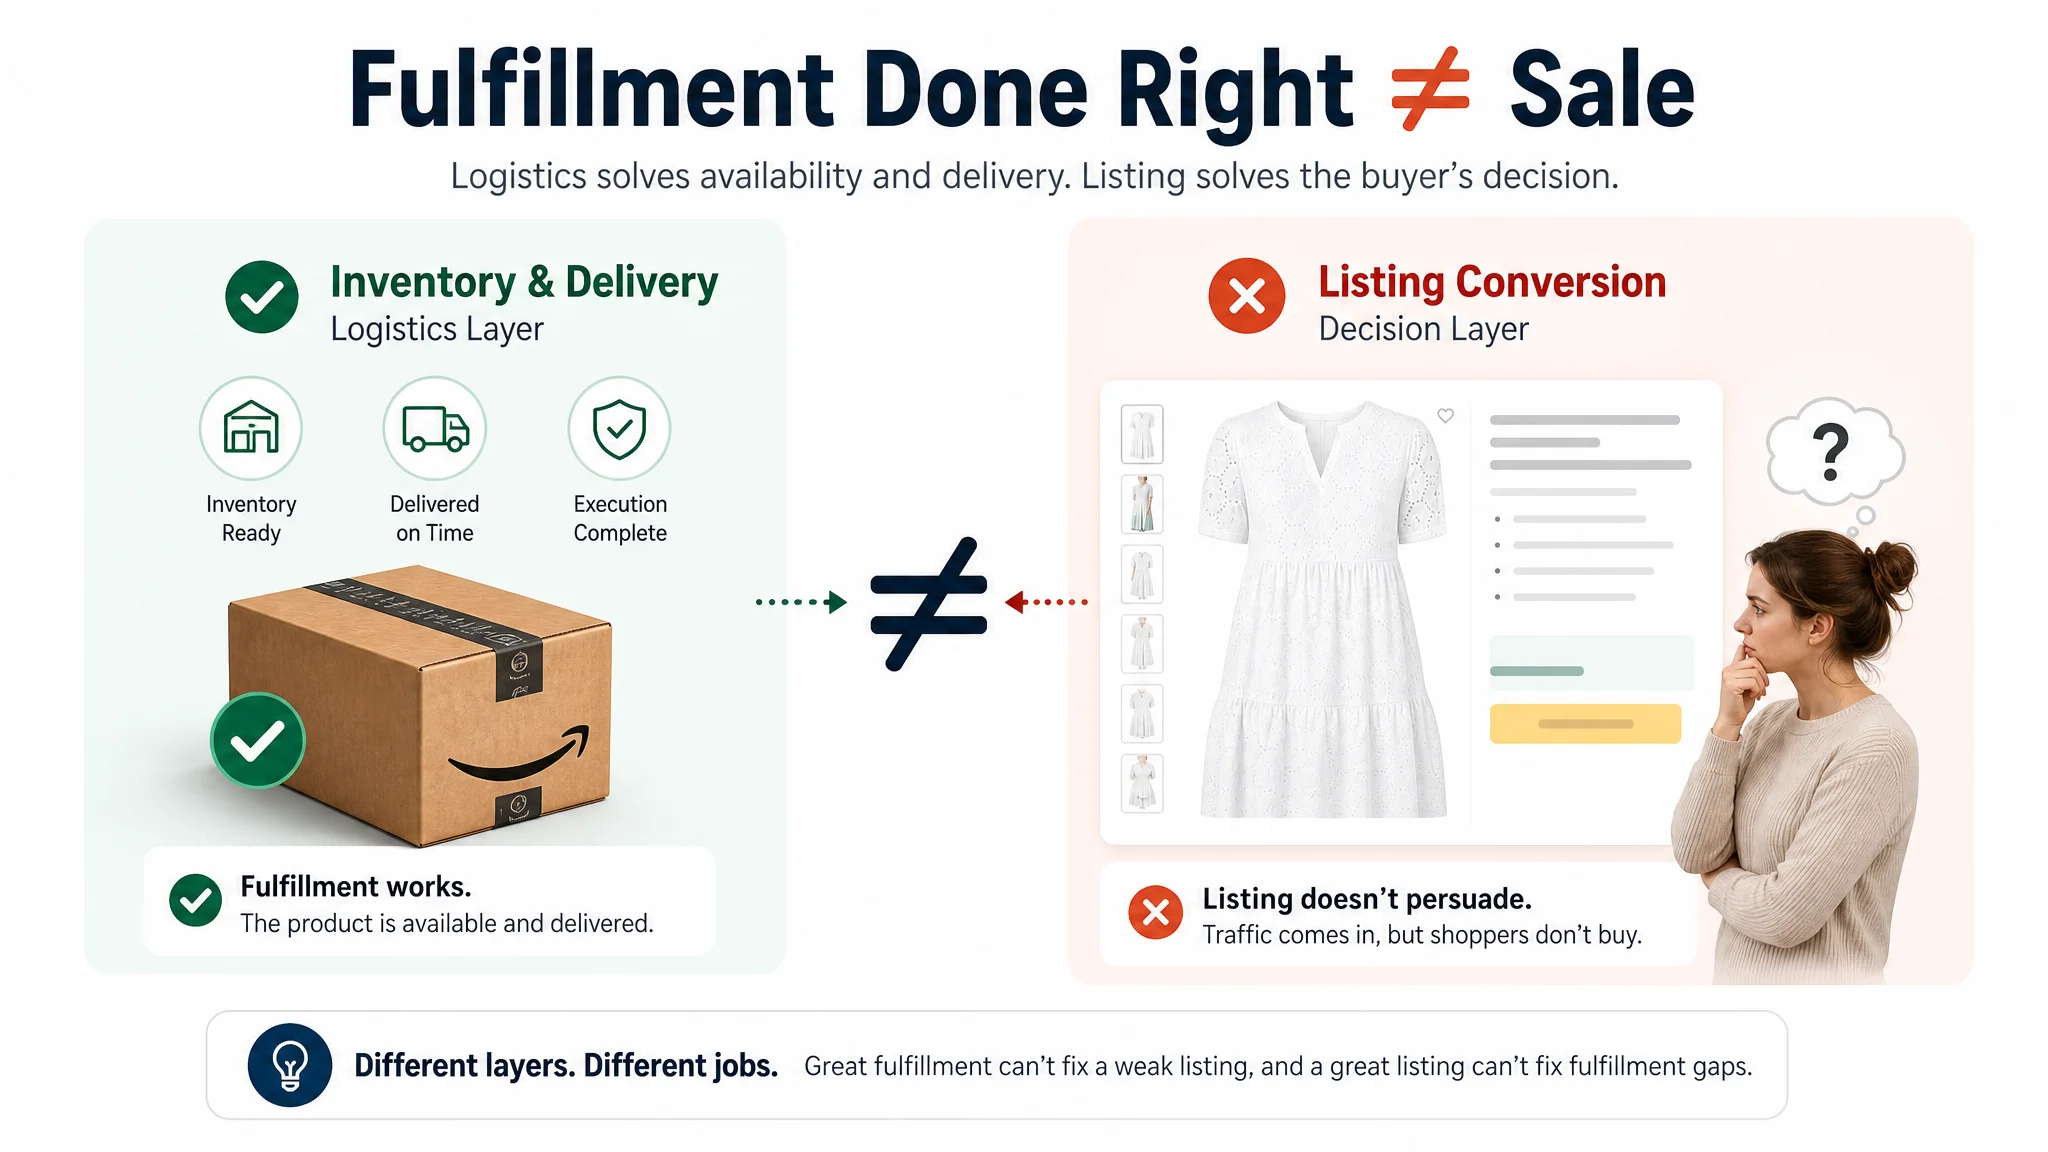
A seller should also avoid assuming that FBA will solve every downstream performance issue. In the fashion listing example, advertising was already bringing shoppers to the product page, but the page did not provide a sufficiently coherent path through product benefits, fit, fabric, and usage scenarios. FBA could support delivery and customer-service expectations, but it could not repair a title that buried relevant search terms, repeated main images, or A+ content that created mood without reducing fit uncertainty. Fulfillment can improve the customer experience after purchase; it cannot replace the listing’s responsibility to convert the visit.
Seller Fulfilled Prime (SFP) Option
Seller Fulfilled Prime offers a different operating model: the seller retains greater responsibility for storing and fulfilling orders while pursuing Prime-related eligibility. That can improve control over packaging, inventory placement, and fulfillment decisions, but it also requires the seller or its logistics partners to execute consistently against Amazon’s delivery and service expectations. The practical choice is therefore conditional. FBA may suit products where operational simplicity and network access outweigh control concerns; SFP may deserve evaluation when unit-level margins, inventory positioning, or packaging requirements justify greater execution responsibility.
The choice should be assessed against the complete customer journey. If seller-fulfilled operations provide greater control but introduce inconsistent delivery or availability, the resulting traffic and conversion effects may outweigh the apparent fulfillment savings. Conversely, if the seller can meet service requirements reliably, SFP may provide a useful node for selected SKUs with specific packaging, inventory, or channel needs.
What Is a 3PL and How Does It Work?
A third-party logistics provider (3PL) operates an outsourced fulfillment node for the seller. It receives inbound inventory, stores it, picks units when orders arrive, packs them, and ships them to customers or downstream fulfillment facilities. Depending on the operating model, the same 3PL may support Amazon orders, direct-to-consumer sales, wholesale accounts, and other marketplace channels.
A 3PL can also prepare inventory for FBA by applying required labels, completing prep work, and forwarding compliant units to Amazon fulfillment centers. This creates flexibility for sellers managing several channels or positioning inventory across more than one fulfillment route.
The commercial model is modular rather than a single published fulfillment charge. An agreement may include separate fees for:
- Receiving and inbound processing
- Storage
- Picking, packing, and order fulfillment
- Prep, labeling, or special handling
- Account management or other account-level services
That flexibility can expand channel reach, but it also makes cost analysis more demanding. FBA often presents its core fulfillment economics in a more standardized structure, while a 3PL requires the seller to assemble charges across activities, storage duration, order profiles, and service requirements.
A valid comparison should therefore normalize the same unit, order, inventory, and service assumptions on both sides. Compare landed fulfillment cost, inventory dwell time, prep requirements, and operational workload—not just the headline pick-and-pack charge. The right choice depends on channel mix, inventory velocity, and the seller’s tolerance for managing a more detailed cost model.
A 3PL can also change how much operational control the seller has over inventory routing and channel allocation, but control only creates value when the seller measures its effects. For example, moving inventory between nodes may alter availability, replenishment timing, and the amount of traffic that can be served consistently. Those effects should be reviewed alongside CVR, ACoS, TACOS, and order volume rather than judged only by the 3PL invoice.
Amazon FBA Cost Structure in 2026
Core Fee Categories
FBA unit economics start with more than the advertised fulfillment fee. The main categories are:
- Fulfillment fees: A standard-size unit may cost roughly $4.00 before the 2026 increase, or approximately $4.08 including it. Actual cost varies by product weight, dimensions, and size tier.
- Monthly storage: Standard-size inventory is charged at $0.78 per cubic foot from January through September and $2.40 per cubic foot in Q4.
- Aged-inventory exposure: The surcharge begins at 271 days, with a higher tier applying at 365 or more days. Inventory should not be treated as risk-free before the 365-day point.
- Inbound-related handling: Inbound placement, transportation, receiving, and related handling can add cost before the unit becomes available for sale.
All figures are illustrations or currently applicable figures subject to change. The practical calculation is contribution margin after fulfillment, storage, inbound costs, advertising, and expected inventory risk—not product price less the fulfillment fee alone.
Hidden or Commonly Underestimated FBA Costs
Inventory planning must account for both cash tied up in stock and fee thresholds. Amazon ended its US prep and labeling services effective January 1, 2026, so sellers must arrange compliant preparation and labeling through their own operation or a third-party provider. That introduces labor, packaging, inspection, and coordination costs that may not appear in the FBA fee itself.
The low-inventory-level fee also requires careful monitoring. Both the 30-day and 90-day historical days of supply must fall below 28 days for the condition to apply. A short-term stockout risk may therefore create a fee issue even when a longer historical view appears acceptable. Track unit-level days of supply alongside CTR, CVR, ACoS, BSR, and listing cycle time rather than reviewing storage in isolation.
These metrics should not be interpreted as interchangeable. A high ACOS may reflect inefficient advertising, but it may also appear when inventory availability, listing conversion, or customer expectations are unstable. A fashion seller once responded to high ACOS by repeatedly adjusting bids, expanding keywords, and refining match types. The team assumed that more relevant traffic would solve the problem. A listing comparison instead found that the product page scored 62/100 against a comparable competitor at 78/100, with weaknesses in the title, main images, bullet points, and A+ content. The ads were bringing visitors in, but the page was not converting them effectively.
The operational lesson is important for inventory planning: do not use advertising metrics to explain a fulfillment problem in isolation, and do not use fulfillment metrics to explain a listing problem in isolation. A low-inventory period can reduce the value of advertising, while a weak listing can make otherwise available inventory appear commercially unproductive. Diagnosis should separate the availability issue from the conversion issue before inventory or budget is reallocated.
Example: How the Q4 Storage Surge Changes Unit Economics
Consider 1,000 standard-size units, each occupying 0.22 cubic feet:
- January: 0.22 × 1,000 × $0.78 = $171.60
- November: 0.22 × 1,000 × $2.40 = $528
The same inventory consumes an additional $356.40 in monthly storage during Q4, before fulfillment, aged-inventory, inbound, or advertising costs. Sellers should therefore reduce replenishment quantities, accelerate sell-through, or redirect inventory before seasonal storage rates magnify the carrying cost.
Inventory-health signals that feed organic-rank stability
DeepBI’s Organic Traffic layer can serve as a conditional monitoring and reallocation layer, not a ranking guarantee. It can combine inventory-health signals with keyword screening from advertising data, reinforce relevant Top of Search activity, and compare ad volume with organic-rank views. TACOS and natural-order share provide reference metrics for deciding whether traffic support is becoming more or less dependent on paid demand. Actions should remain conditional on inventory coverage, conversion performance, and observed market response.
A traffic increase should not automatically be treated as evidence that a SKU deserves more inventory. In the fashion listing example, the seller had enough advertising access to generate visits, but the page’s conversion capacity was weaker than a directly comparable competitor’s. The diagnostic finding was not simply that the listing needed more traffic. Its title buried relevant category and scenario terms, its image sequence repeated similar views, its bullets described facts rather than buyer benefits, and its A+ content created mood without sufficiently reducing fit uncertainty.
That distinction matters when using organic and advertising signals to guide allocation. If inventory is moved into a SKU because traffic is rising while CVR remains constrained by listing quality, the seller may increase storage exposure without improving contribution margin. Organic-rank and traffic signals should therefore be reviewed with CVR, availability, and listing changes in the same measurement window.
3PL Cost Structure in 2026
Storage Pricing Models
A 3PL quote is modular, so comparing it with FBA requires more normalization than comparing standardized FBA fee lines. Storage may be priced by:
- Square foot: about $1.73 per square foot per month in the stated benchmark.
- Pallet: a fixed monthly charge for each pallet stored, such as $18 per pallet.
- Cubic foot: a volume-based charge, with a separate benchmark of $0.35–$0.60 per cubic foot.
These benchmarks are different measures, not an exact conversion. A square-foot rate cannot be translated into a cubic-foot rate without assumptions about warehouse clear height, pallet configuration, usable space, and occupancy. Before comparing storage, calculate the same unit economics for both options: monthly storage per order, storage per sellable unit, and a comparable cubic-foot-equivalent only when the underlying dimensions and warehouse assumptions are documented.
The main advantage of this modular structure is flexibility. A seller may avoid paying for a uniform fulfillment model when inventory profile, seasonality, or channel mix requires a different network. That flexibility has value only after utilization and throughput are measured.
The same discipline applies to performance interpretation. A 3PL may improve inventory placement or support several channels, but a change in fulfillment structure should not be credited for every subsequent movement in CVR, ACOS, or order volume. If the seller also changes the listing, advertising, price, or promotional strategy, the comparison needs a defined baseline and measurement window. Otherwise, the cost model may be precise while the performance conclusion remains unverified.
Handling, Fulfillment and Account Fees
Storage is only one part of the 3PL bill. The operating schedule may also include receiving, pick-and-pack, shipping, account management, and minimum-volume charges. For a reproducible illustration, assume:
- 15 pallets stored at $18 per pallet: $270
- 2,000 units received at $0.45 per unit: $900
- 2,000 single-item orders picked and packed at $2.75 per order: $5,500
The illustrated subtotal is $6,670 before shipping, account fees, additional-item charges, and minimum-volume requirements. If an order contains an additional item, add $0.40 for that item under the stated schedule.
The correct comparison with FBA is therefore not a headline storage rate. Normalize order profile, units per order, cubic-foot assumptions, receiving volume, shipping zones, and all fixed or minimum charges before evaluating ACoS, contribution margin, or the operational flexibility of a 3PL network.
Side-by-Side Comparison and Trade-offs
The right fulfillment node depends on SKU velocity, seasonality, control requirements, and network complexity—not on a universal preference for FBA or 3PL.
- Storage pricing behavior: FBA: Amazon storage pricing is standardized, with FBA storage rising to $2.40 per cubic foot in Q4., 3PL: Pricing follows the provider’s storage, handling, and contract structure., Operating trade-off: FBA is simpler to model; 3PL may offer more commercial flexibility, but requires closer contract review.
- Seasonality: FBA: Peak-season storage can increase the carrying cost of slow or bulky inventory., 3PL: Capacity and pricing can be negotiated around seasonal requirements., Operating trade-off: FBA favors fast-moving seasonal SKUs; 3PL may suit inventory requiring more deliberate timing.
- Fulfillment control: FBA: Amazon manages the fulfillment execution., 3PL: The seller has greater control over operating procedures and inventory routing., Operating trade-off: FBA reduces operational workload; 3PL preserves more control but adds management demands.
- Prep and labeling: FBA: The January 1, 2026 prep and labeling change requires sellers to reassess FBA readiness and responsibility., 3PL: Prep and labeling can remain within the seller’s or provider’s operating workflow., Operating trade-off: 3PL may provide process control, while FBA requires compliance with Amazon’s inbound standards.
- Multi-node and multi-channel reach: FBA: Strong Amazon-native reach, but less flexible for broader channel design., 3PL: Better suited to multi-node and multi-channel distribution when the network is managed well., Operating trade-off: FBA simplifies Amazon coverage; 3PL supports complexity at the cost of coordination.
- Inventory-health fee exposure: FBA: Exposure follows Amazon’s inventory-health and storage fee rules., 3PL: Exposure shifts to contracted storage, handling, and aging terms., Operating trade-off: FBA offers standardization; 3PL offers negotiability but requires active monitoring.
For many operators, a hybrid network is the practical compromise: place priority Amazon inventory in FBA while using 3PL capacity for control, seasonality, or channel breadth.
The operating trade-off becomes clearer when performance signals are separated. A node can improve availability and delivery execution while the listing continues to underperform. In the summer dress example, the seller’s advertising traffic was not the primary constraint; the page itself lacked a coherent buying journey. The recommended changes focused on title structure, image sequencing, benefit-led bullets, and A+ content before further advertising expansion. This illustrates why a fulfillment switch should not be expected to correct a conversion bottleneck that sits on the product page.
Breakeven Walkthrough: FBA vs 3PL on the Same SKU
Take one standard-size SKU measuring 0.20 cubic feet and selling for $30. Assume 1,000 units sell evenly over 60 days, with one replenishment cycle each month. The sales profile implies approximately 500 units of average on-hand inventory—not 1,000 units held throughout the period.
For FBA, fulfillment is approximately $4.00 per unit, or $4,000 for 1,000 units. Using the stated 2026-adjusted figure of $4.08, the fulfillment total becomes $4,080. Storage is calculated separately:
- Average inventory: 500 units
- Average storage volume: 500 × 0.20 = 100 cubic feet
- Monthly storage: 100 × $0.78 = $78
- Two-month storage total: $156
Therefore, the modeled FBA total is $4,156 at the $4.00 fulfillment rate, or $4,236 at $4.08. That equals $4.16 or $4.24 per unit after rounding. The $30 selling price produces $30,000 in modeled sales revenue; it does not change the fulfillment comparison.
For the 3PL, keep the quote modular: total cost equals 1,000 multiplied by the quoted per-unit handling charge, plus the quoted storage charge for approximately 100 cubic feet per month over two months. Add only separately stated modules that apply to this SKU.
The 3PL is cheaper when that combined cost is below $4,156, or below $4,236 under the 2026 FBA assumption. Higher volume can spread fixed charges, while slower turns or larger opening inventory can make 3PL storage less favorable. Recalculate the model whenever sales velocity, restocking cadence, storage rate, or the 3PL module mix changes.
The breakeven model should also identify which performance assumptions are being held constant. If a fulfillment change affects availability, delivery expectations, or the timing of saleable inventory, the seller should separately monitor CVR, order volume, ACOS, TACOS, and BSR. A lower fulfillment cost does not automatically create a better result if the listing or traffic mix remains unable to convert the available demand.
Where the Network Choices Break: Lead Time, Inventory Thresholds and Peak-Season Risk
A fulfillment node can look economical at the unit level and still fail operationally when its effective lead time is understated. Effective lead time includes ocean transit, customs clearance, drayage, FBA receiving, and inbound placement splits—not only the supplier’s production promise. Supplier inconsistency, missed receiving windows, and uneven placement can extend the period between replenishment release and saleable inventory.
The cost impact is broader than expedited freight. A delayed replenishment can create stockout exposure, weaken CVR when shoppers encounter unavailable inventory, reduce sales velocity, and eventually pressure BSR and organic traffic. At the other extreme, excess safety stock can create storage drag and aged-inventory charges. Amazon’s low-inventory-level fee applies when both the 30-day and 90-day historical days of supply are below 28 days. Aged-inventory surcharges begin at 271 days, with a higher tier from 365 days onward. Amazon also states that sellers above the Minimum Inventory Level see an average 15% sales lift over four weeks. These thresholds should be modeled alongside freight, storage, placement, and working-capital costs rather than treated as isolated fees.
A stockout and a weak listing can produce similar commercial symptoms—lower orders, weaker CVR, and poorer advertising efficiency—but they require different interventions. One seller initially responded to unstable orders and rising ACOS by adjusting bids, expanding keywords, and changing match types. A listing analysis later found that the page was weaker than a comparable competitor in title logic, main images, bullet points, and A+ structure. The diagnostic conclusion was that ads were amplifying a page that was not ready to convert traffic. That does not eliminate the need to investigate inventory availability; it demonstrates why operators should not assume every CVR decline is caused by the fulfillment node.
Keeping the keyword-to-rank loop measurable after inventory stabilises
A stockout can interrupt the sales and conversion signals supporting keyword visibility, even after inventory returns. Once availability stabilises, use DeepBI’s Organic Traffic layer to measure keyword-to-rank relationships over the recovery period. Compare inventory status with keyword position, CVR, and BSR movement so the team can distinguish a replenishment-related signal loss from a listing or demand problem. The purpose is measurement and diagnosis, not a guarantee of rank retention.
The recovery review should also account for listing quality. In the fashion example, the page needed a clearer decision path: an unobstructed full-body image, earlier fabric and back-view proof, bullets focused on comfort and fit, and A+ modules that reduced uncertainty. If inventory returns at the same time as these listing changes, the seller should not attribute every improvement to replenishment alone. Mark the operational and content changes separately so the recovery analysis remains interpretable.
Protecting ad efficiency during inbound and stockout windows
During inbound delays or constrained availability, use DeepBI’s Ads Quant layer conditionally to monitor rolling 7-day clicks, conversions, spend, and ACOS. This gives operators a consistent view of whether campaigns are accumulating spend without sufficient conversion support. Where inventory is unavailable or imminently constrained, use those signals to avoid directing spend against unavailable inventory. After stock is saleable again, continue monitoring ACOS and CVR before restoring prior budgets, since traffic recovery and conversion recovery may not occur on the same schedule.
The same caution applies when inventory is available but the listing remains weak. In the summer dress case, continuing to push ads before addressing the page would have increased exposure to the conversion bottleneck. After the title, image path, bullet logic, and A+ structure were addressed, ad performance became more interpretable because the page had a clearer ability to convert the clicks it received. The general principle is to restore both sides of the operating equation: make the product available, then confirm that the product page can convert the demand being sent to it.
Hybrid Fulfillment Strategies: AWD, Multi-Node Staging and Node-Layout Gaps
A single fulfillment model rarely fits every SKU. A more practical hybrid network stages bulk inventory upstream through AWD or a 3PL, while fast movers remain in FBA for dependable availability and shorter delivery commitments. Segment the catalog by velocity and demand pattern: fast versus slow movers, and seasonal versus year-round demand. Do not switch the entire catalog simply because one node performs well.
Amazon has said AWD Multi-Channel Distribution can reduce total inventory needs by up to 20%. Treat that claim as a planning input, not a guaranteed result. Any AWD per-cubic-foot rate currently published by Amazon is also an approximate figure that Amazon may revise, so model sensitivity around storage and transfer costs before committing inventory.
After January 1, 2026, prep and labeling capability must be an explicit network requirement. A lower storage rate does not compensate for a node that cannot meet the SKU’s packaging, labeling, or inbound requirements. Amazon MCF should be evaluated separately as Amazon’s service for orders originating outside Amazon channels; it does not change the need to design Amazon-channel inventory coverage.
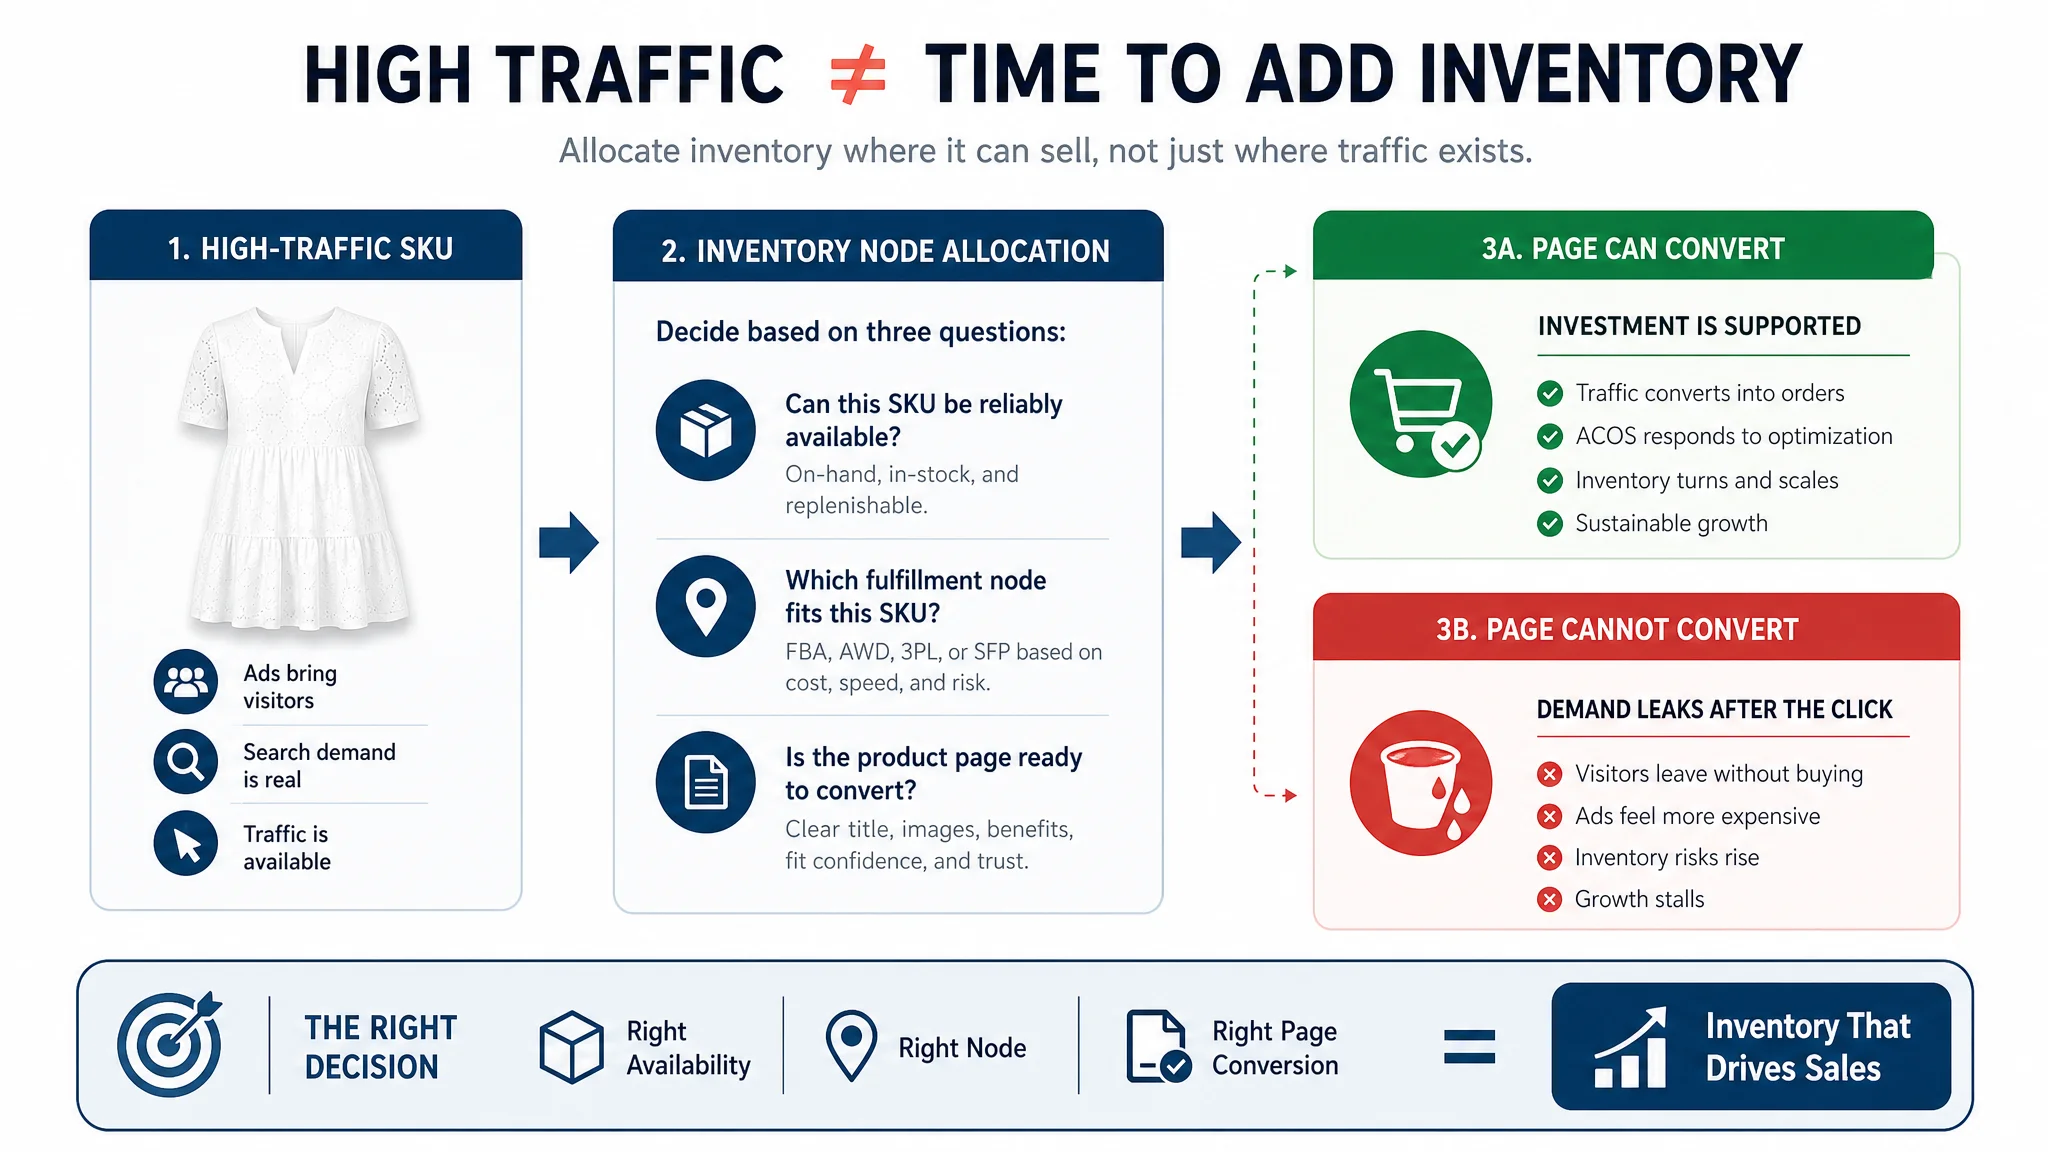
Run a node-layout gap scan before assigning stock. Compare category leaders’ apparent placement across FBA, AWD, and 3PL with your own coverage, seasonality protection, replenishment exposure, and SKU-tier fit. The output should be a node-by-SKU allocation: which inventory belongs upstream, which must stay close to demand, and which requires a backup node. This links fulfillment choices to stock availability, BSR protection, and unit economics rather than treating logistics as a catalog-wide switch.
The same SKU-level logic should be applied to conversion support. A high-traffic SKU may appear to justify more inventory, but traffic alone does not prove that the product page is commercially ready. The summer dress listing generated enough advertising visits to expose a weak conversion path, while the diagnosis showed that the page needed better search alignment, visual sequencing, benefit communication, and fit reassurance. A hybrid network should therefore distinguish between demand that is being converted efficiently and demand that is merely being purchased and lost.
Decision Framework: Matching Fulfillment Nodes to SKU Tiers (30-60-90 Re-measurement)
Start with SKU segmentation rather than a network-wide rule. Classify each item by sales velocity, lead-time variability, unit size, and channel mix. A practical working heuristic is that FBA generally fits small, fast-moving, standard-size SKUs with predictable replenishment. As volume, dimensional weight, lead-time uncertainty, or channel complexity increases, 3PL staging or a hybrid network becomes more attractive. The decision should account for Amazon demand alongside direct, wholesale, or other-channel requirements.
Add a conversion-readiness check before interpreting demand signals as evidence for greater inventory allocation. Review whether the listing can communicate the product’s category, benefits, fit, usage scenarios, and trust signals. In one directly comparable fashion comparison, the target page scored 62/100 versus 78/100 for the benchmark. Its reviews were not the primary blocker; the larger gaps were in title, main images, bullet points, and A+ content. That diagnosis supports a broader operating rule: if CVR is weak, first determine whether the constraint is availability, traffic quality, or page conversion capacity before increasing stock or advertising.
Treat the first 90 days as a measurement cycle, not a performance guarantee:
- At 30 days: review inbound appointment performance, receiving reliability, inventory availability, and any effect on listing cycle time or stock-related disruption.
- At 60 days: examine fulfillment fees, storage-cost behavior, handling charges, and the impact on unit economics and advertising efficiency, including ACoS and TACOS.
- At 90 days: evaluate total landed fulfillment cost, organic-rank stability, BSR direction, TACOS stability, and whether the node is supporting expected natural-order share before reallocating inventory.
The finance review should include NPV, IRR, payback period, and working-capital impact. A lower shipping charge is not automatically a better decision if it requires more inventory, increases cash conversion pressure, or weakens service reliability.
Re-checking organic rank, TACOS and natural-order share after a fulfilment switch
Mark the fulfillment change as an implementation event and compare post-switch results with a defined pre-switch baseline. Track organic rank, BSR, TACOS, natural-order share, CTR, CVR, and order volume through recurring data rather than a single snapshot. Review whether changes move consistently with the operational hypothesis, while separating fulfillment effects from advertising, pricing, inventory, and listing changes. Reallocation should follow measured total economics and stable signals, not an assumed organic-performance benefit.
The baseline should also record material listing changes. In the summer dress analysis, the seller changed the title, reorganized the image sequence, rewrote the bullets around benefits and scenarios, and restructured A+ content to address fabric, design, fit, and usage. If those changes occur near a fulfillment switch, the resulting movement in CVR, TACOS, or organic orders cannot be assigned to logistics without further separation. A defined change log helps distinguish the effect of better availability from the effect of a stronger product page.
Common Mistakes and How to Correct Them
Reliable fulfillment decisions require arithmetic that another operator can reproduce, evidence with a defined scope, and baselines that are clearly named.
- Inconsistent storage rounding: Apply one rounding convention throughout the model. In the 0.22-cubic-foot example, report January as $171.60 and November as $528, or label any alternative figures explicitly as rounded estimates.
- Incorrect aged-inventory assumptions: Model aged-inventory surcharges from the correct thresholds: charges begin at 271 days, with a higher tier applying at 365+ days. Do not treat all aging inventory as subject to the same rate.
- Starting inventory used for even sell-through: Use average inventory when units are expected to sell through evenly during the period. Starting inventory can materially overstate storage exposure and distort unit economics.
- Mixed storage units: Keep square-foot benchmarks separate from cubic-foot benchmarks. Do not compare or combine them unless the model first converts them using a stated, consistent basis.
- Unreproducible performance multiples: Tie every multiple to a named baseline, a defined measurement window, and observable metrics such as CTR, CVR, ACoS, BSR, or listing cycle time. A report_id and fixed input-output record can make the calculation traceable.
- Attributing every conversion problem to ads or fulfillment: A seller may see high ACOS and unstable orders and assume that bids, keywords, or inventory placement are the only problems. In the fashion listing example, repeated ad adjustments did not materially change CVR because the page itself was weaker than a comparable competitor. Check listing structure, availability, and traffic quality before assigning the problem to a single operating layer.
- Assuming available inventory guarantees conversion: Inventory can be saleable and correctly positioned while the listing still fails to explain fabric, fit, design, or usage scenarios. Review whether the page gives shoppers sufficient reason to buy before interpreting available inventory as realized demand.
- Survey generalisation: Attribute consolidation interest specifically to the November 2025 survey of 51 omnichannel shippers. Treat it as directional evidence only; broader research is needed before applying it to the wider seller population.
- Undefined AI-efficacy claims: Omit percentage claims that do not identify the population, metric, baseline, and measurement period. Scope any claim to a defined comparison, such as observed CTR or CVR against a named, time-boxed baseline.
FAQ
When may FBA be cheaper than a 3PL?
FBA may be cheaper when its total per-unit cost, including fulfillment, storage, inbound transportation, and applicable surcharges, is lower than the 3PL’s fully loaded cost. Compare the same SKU, service level, and order profile rather than comparing storage or pick fees alone.
Does Seller Fulfilled Prime replace FBA?
No. SFP is an alternative fulfillment node, not a universal replacement for FBA. Sellers can allocate selected SKUs or order flows to SFP when they can meet the required operating standards, while retaining FBA where its economics or coverage are stronger.
What changed on January 1, 2026, for prep and labeling?
The supplied analysis does not establish the exact January 1, 2026 prep and labeling change. Confirm the applicable Amazon requirements before changing carton workflows, labels, or vendor instructions; an unverified assumption can create receiving delays and added handling cost.
How do aged-inventory surcharges work?
Aged-inventory surcharges add cost when units remain in the network beyond Amazon’s applicable storage-age thresholds. Include that incremental charge in SKU-level margin analysis, because slow-moving inventory can turn an apparently low fulfillment cost into a loss.
How should a seller choose between AWD staging and direct FBA inbound?
Use direct FBA inbound when demand is sufficiently predictable and the inventory can move into fulfillment centers without excessive replenishment risk. Use AWD staging when centralized buffer inventory supports replenishment across the network; compare transfer costs, lead time, storage exposure, and stockout risk against the direct-inbound option.
How should advertising performance be interpreted after a fulfillment change?
Do not assume that a lower ACOS or higher order volume is caused by fulfillment alone. Compare availability, delivery execution, listing changes, advertising settings, CVR, TACOS, and order volume against a defined pre-change baseline. If the listing was also rebuilt, separate the effect of the content changes from the effect of the fulfillment decision.
Conclusion: Sequence the Network, Then Re-measure
The strongest fulfillment design is usually sequenced, not selected as a single permanent answer. Allocate inventory by node and SKU tier: use the fulfillment path that fits each item’s demand pattern, size, margin, service requirement, and replenishment risk. FBA, Seller Fulfilled Prime, 3PL, AWD, and seller-fulfilled capacity can each have a role when their unit economics and operating constraints are understood.
For non-uniform catalogs, hybrid fulfillment should be treated as normal operating practice rather than an exception. A high-volume, fast-moving SKU may justify one node, while a slower, bulkier, or more margin-sensitive item may require another. The allocation decision should then be tested against landed fulfillment cost, availability, inventory exposure, and marketplace outcomes such as traffic, CVR, ACoS, TACOS, and BSR.
The listing example reinforces the same operating principle from another angle. The seller initially believed that more advertising would solve high ACOS and unstable orders. The diagnostic comparison showed that the page was the more immediate constraint: its title, images, bullets, and A+ content were not converting traffic as effectively as the benchmark page. Once the problem was framed correctly, the optimization sequence changed from repeated ad adjustments to improving the page’s conversion capacity and then reassessing ad performance.
The review cadence matters more than the original network choice. Establish a clear implementation point, compare performance with the prior state, and reallocate when measured results change. If costs, availability, or traffic outcomes move materially, the network should move with them. As demand and SKU economics evolve, the right strategy will remain conditional: sequence inventory across suitable nodes, confirm that the product page can convert the demand being served, then re-measure before expanding, reducing, or changing the allocation.