


Why Amazon Listing Conversion Rate Is More Than a Sales Number
Amazon conversion rate is more than a scoreboard metric. It is a leverage metric that shows how effectively a listing turns qualified traffic into orders. The basic relationship is straightforward: conversion rate is calculated by comparing orders with sessions. When sessions reach the detail page but orders remain weak, the issue may lie in the listing rather than in traffic volume alone.
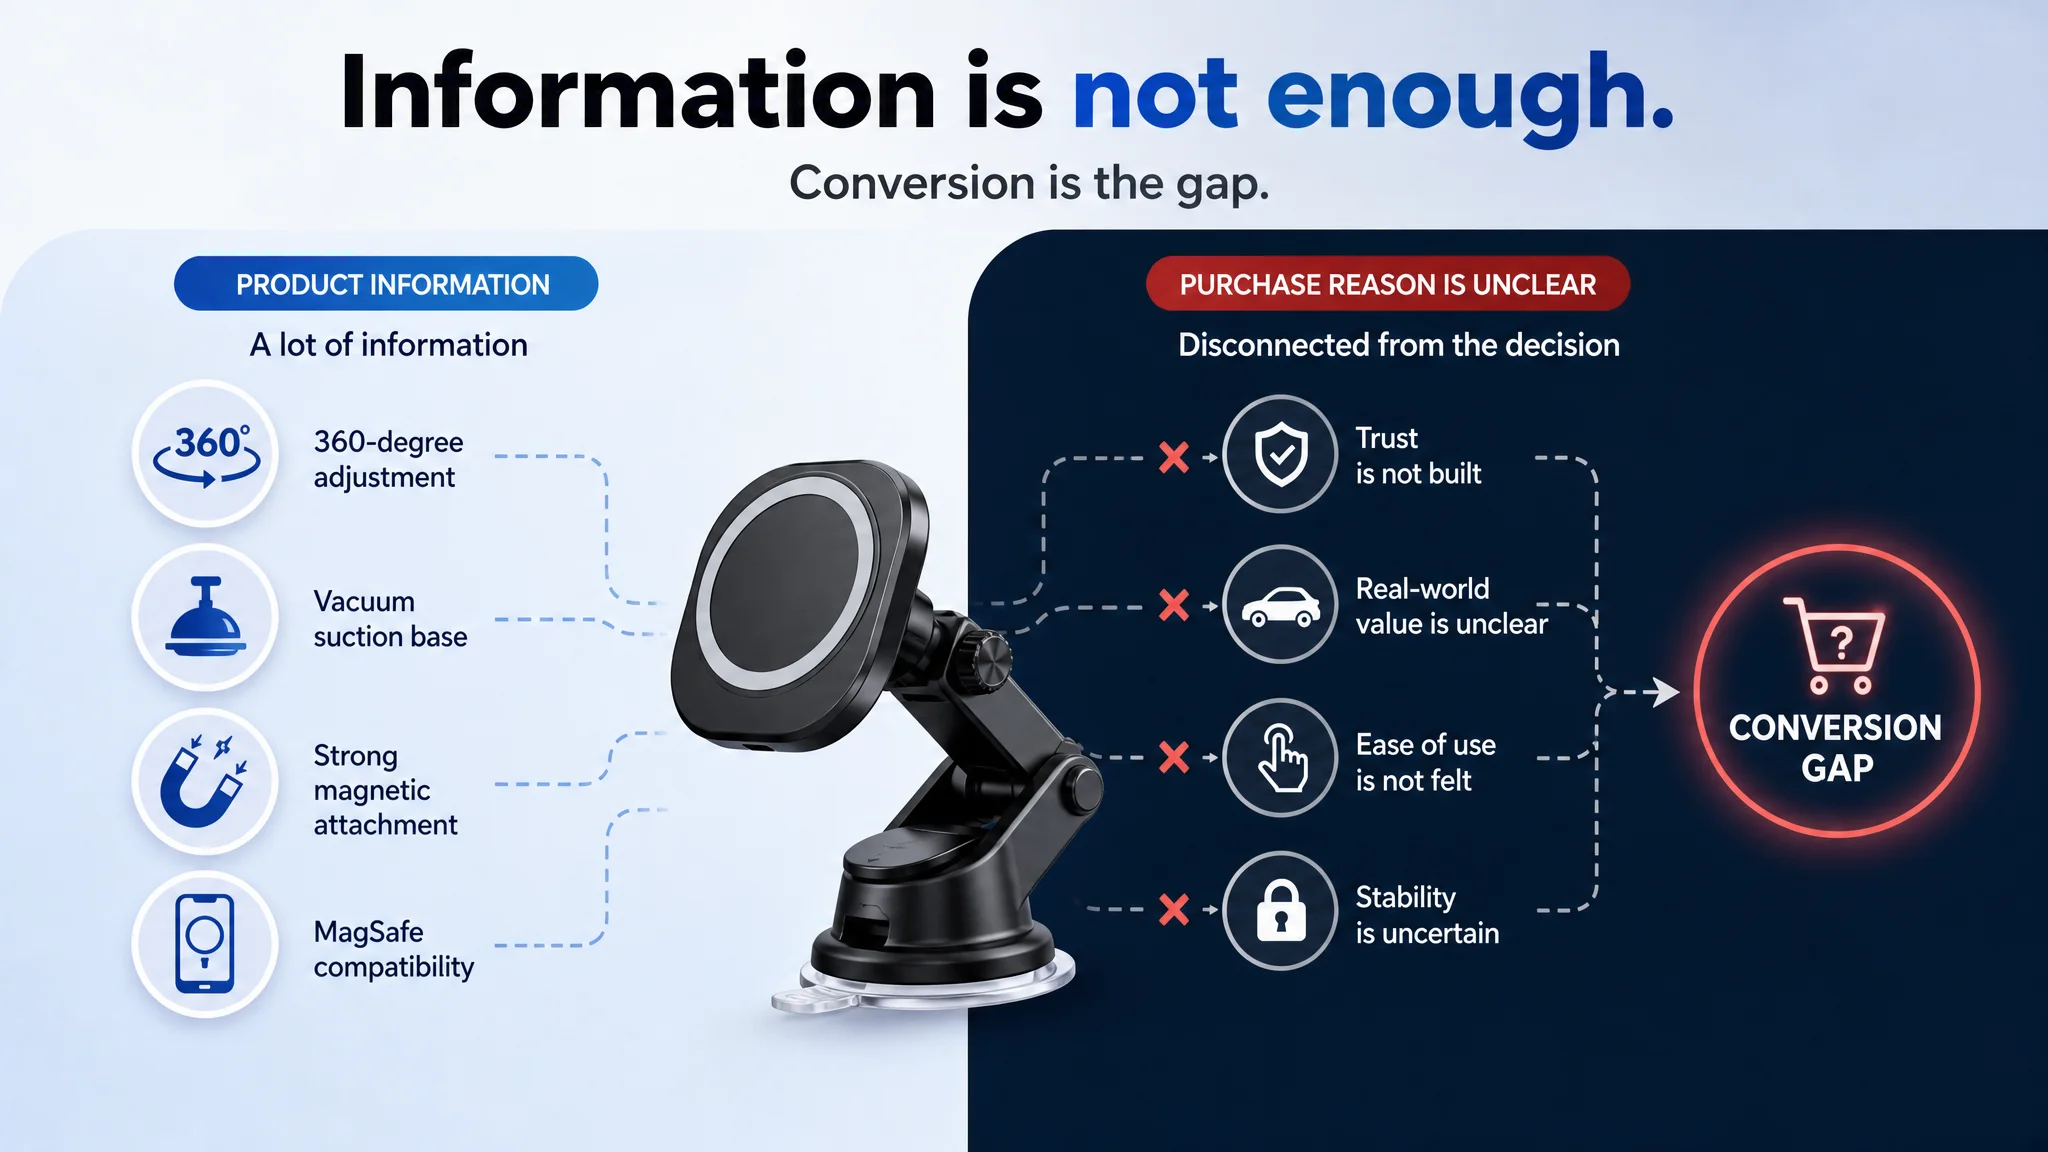
This distinction becomes clearer when a page already contains substantial product information but still loses the buying decision. In one automotive accessories listing, the product page described 360-degree adjustment, a vacuum suction base, strong magnetic attachment, MagSafe compatibility, adjustable positioning, installation, and materials. Yet the page remained less competitive than a comparable high-performing listing, scoring 77 versus 86 in a structured comparison. The problem was not a lack of features. It was that those features were not organized into a convincing reason to trust and buy the product.
CVR therefore serves as a practical signal of listing quality. The main image, title, bullets, A+ content, reviews, price, and offer conditions all shape the shopper’s decision after the click. A listing with clearer information and stronger perceived value can convert more of the same traffic. Operationally, that can improve CVR, reduce wasted spend, and support healthier ACoS.
The same automotive listing showed why information volume alone is not enough. Its title and bullets were organized around product functions, while the stronger comparison page translated similar product attributes into outcomes such as stability during driving, one-handed use, viewing-angle flexibility, and confidence in the mounting system. The page was technically informative, but the buyer still had to assemble the argument independently. A conversion-focused listing does that work for the shopper.
Conversion also connects with sales velocity. Listings that convert more effectively tend to generate orders more efficiently from incoming traffic. Stronger order velocity can support visibility through Amazon’s ranking signals, creating more opportunities to earn impressions and sessions. The relationship is operational rather than automatic: improved CVR does not guarantee a ranking outcome, but weak conversion can make it harder for paid and organic traffic to sustain momentum. The listing therefore supports both CTR and CVR as a commercial asset, not merely as a visual display.
Volume context still matters. A high conversion percentage from a very small session base can look impressive while contributing little sales volume, BSR movement, or revenue. Evaluate CVR alongside sessions, orders, CTR, ACoS, and sales velocity. A percentage without its denominator can lead to the wrong decision.
Price introduces another trade-off. Permanent deep discounting may lift conversion by reducing purchase resistance, but it also lowers per-unit margin and can weaken perceived quality if the offer appears artificially cheap. The objective is not to keep prices low indefinitely. Use value-based pricing and controlled tests to determine whether the listing communicates enough benefit to support the intended price. Compare the effect on CVR with contribution margin, ACoS, and order volume.
For visual or copy changes, treat the listing as a measurable before-and-after process. Record each update, then compare CTR, CVR, sessions, orders, and related advertising data after the change. DeepBI supports this feedback loop by marking a visual iteration event in ad reports, allowing sellers to observe how CTR changes after a new image is applied. This connection turns optimization from subjective judgment into an operating decision.
How to Measure Amazon Listing Conversion Rate Without Misreading It
Measure Amazon listing conversion using the marketplace denominator: order items divided by sessions.
The basic calculation is:
Listing conversion rate = Units ordered or order items ÷ Sessions × 100
Do not use clicks as the denominator for this metric. Clicks belong to the advertising funnel and support metrics such as CTR, CPC, and ad-attributed conversion. Sessions represent visits to the Amazon product detail page. A shopper may arrive through organic search, an ad, a category page, an external link, or another marketplace entry point. Listing conversion evaluates what happens after that visit, whereas advertising conversion may evaluate a narrower attributed path.
This distinction is especially important when a seller sees traffic but not enough orders. The automotive accessories listing described above was not simply invisible. It had a recognizable product category and a substantial amount of technical information. The initial instinct was to make the page more complete by adding specifications, material language, and more product functions. A closer listing diagnosis showed that the more relevant issue was conversion capacity: the page did not make stability, one-handed use, or locking performance tangible enough for the shopper. Measuring the right denominator helps identify the stage of the funnel being evaluated, but it does not replace examining the page that receives the session.
To find the relevant figure in Seller Central, follow the reporting path in order:
1. Open the Reports menu.
2. Select Business Reports.
3. Open Sales and Traffic.
4. Locate Order Item Session Percentage.
5. Record the date range, sessions, order items, and reported percentage.
Use the same metric definition each time. Log it weekly on the same weekday, using a consistent date range and reporting routine. A Monday review compared with the previous Monday is more useful than irregular checks conducted after unusually strong or weak traffic days. Keep the raw numerator and denominator in the tracking sheet. A percentage without its underlying session and order counts is difficult to audit.
Volume context is essential. Suppose a listing receives 10 sessions and produces 2 order items. Its order item session percentage is 20%. That figure looks strong, but it is based on only 10 visits. If the listing receives 1,000 sessions and produces 100 order items, the rate is 10%, yet the second listing has generated far more orders from a much larger demand pool. The smaller sample can shift sharply when one order is added or removed. Do not treat a high percentage from limited traffic as proof of a strong listing.
Interpret CVR within a comparable market frame. Category norms differ because shoppers enter with different expectations, buying intent, and consideration cycles. Price band also changes the decision threshold. A low-priced impulse item should not be benchmarked directly against a premium product, even when both share broad keywords. Product form, audience, and price should remain reasonably comparable before competitor CVR is used as a reference.
Keep CTR and listing CVR in separate columns. Low CTR points to an impression-to-click problem, while weak session conversion points to the product-page experience after the visit. Linking both measures to subsequent changes in CVR, ACoS, and order volume creates a usable feedback loop without confusing their denominators.
Setting a Realistic Conversion Benchmark for Your Category
A conversion-rate benchmark is useful only when the comparison is properly qualified. Published Amazon conversion figures vary by source, year, category, traffic mix, and price band. Treat them as reference bands rather than operating targets. A mid-single-digit to low-double-digit range is frequently cited as a strong outcome, but that range can shift sharply across categories and price levels. It should never be treated as the Amazon platform average.
Start with a private benchmark built from the three to five competitors most similar to your product. Do not automatically select the category leader or current Bestseller. A substantial gap in price, product form, function, usage scenario, or audience can make that comparison commercially irrelevant. Category leadership may reflect advantages your listing cannot reproduce, while a low-review product may lack sufficient market validation to serve as a reliable reference.
A structured comparison of the magnetic car phone mount illustrates why a qualified benchmark is more useful than a general category leader. The customer page scored 77 out of 100, while a comparable high-performing page scored 86. The gap was distributed across several dimensions: title, main image, bullet points, detail page, and reviews. The comparison did not show that every part of the customer page was failing. It showed that small weaknesses were reinforcing one another, especially in the way the page converted technical specifications into buyer confidence.
- Title: Customer page: 16/20, Comparable high-performing page: 17/20, Gap: -1
- Main image: Customer page: 25/30, Comparable high-performing page: 26/30, Gap: -1
- Bullet points: Customer page: 7/10, Comparable high-performing page: 9/10, Gap: -2
- Detail page: Customer page: 21/25, Comparable high-performing page: 23/25, Gap: -2
- Reviews: Customer page: 8/15, Comparable high-performing page: 11/15, Gap: -3
- Total: Customer page: 77/100, Comparable high-performing page: 86/100, Gap: -9
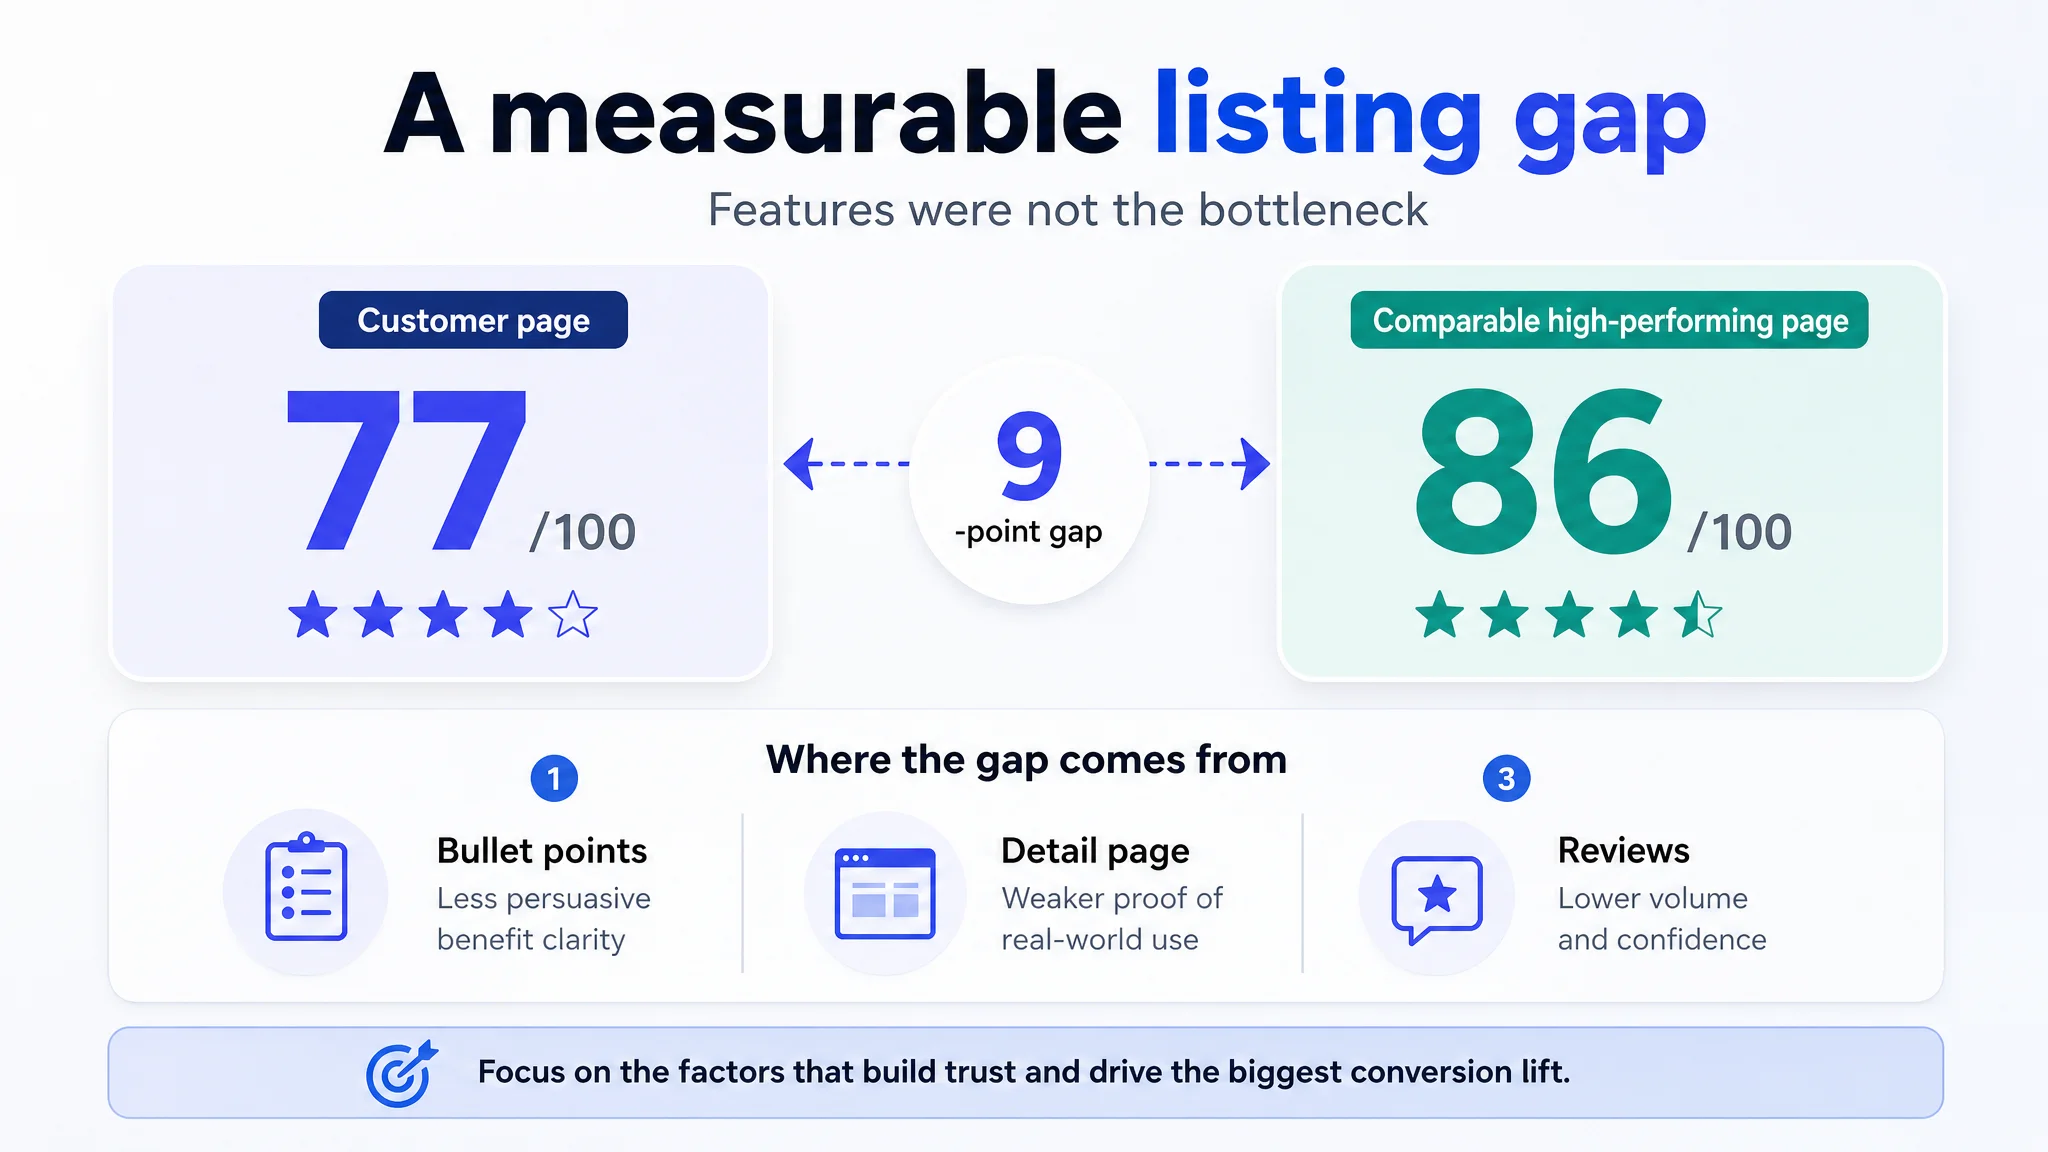
The value of this table is not the score itself. It is the decision context created by the score. The title and main image were only slightly behind, while the larger gaps appeared in the bullets, detail page, and review environment. That pattern suggested that the listing did not primarily need more traffic or more technical claims. It needed a clearer chain of proof from product feature to practical outcome.
Filter candidates by:
- Product-form similarity
- Comparable price band
- Similar usage scenario
- Similar functional logic
- Sufficient review and market validation
Observe these competitors over time rather than capturing a single isolated snapshot. Record changes in price, reviews, visual hierarchy, offer structure, and apparent positioning alongside your own performance data. The objective is not to produce a more attractive benchmark score, but to identify which listing decisions may be associated with a conversion gap.
Keep general marketplace conversion comparisons separate from Amazon advertising conversion metrics. A marketplace benchmark may combine different traffic sources and purchase intents. Advertising CVR reflects the traffic conditions represented in an advertising report, including impressions, clicks, and conversions. CTR, CVR, ACoS, and TACoS should therefore be read within the specific traffic context that produced them. A paid-traffic CVR should not be compared directly with a broader marketplace conversion figure without checking the scope.
Your primary yardstick should be your own trailing eight-week average from Business Reports. Use that baseline to determine whether listing changes improve CVR, rather than judging success against an external number. Review impressions, clicks, orders, CTR, and CVR together. A lower conversion rate accompanied by a major traffic shift may require a different diagnosis from a decline under stable traffic conditions.
After calculating the eight-week baseline, compare it with the qualified competitor set and any published reference band. Verify every external comparison against your Business Reports data. Then convert the gap into an action: clarify a weak value proposition, correct a mismatched image sequence, or strengthen information needed before purchase. The benchmark is only the starting point. The business decision comes from the evidence supporting the gap.
Competitor Layout Gap Analysis: Find the Gaps That Cost You Conversions
A layout gap is a difference between your listing and a stronger, comparable competitor in a presentation dimension that affects a buying decision. Check image clarity, title specificity, benefit ordering, above-the-fold density, and trust signals. The goal is to locate specific gaps, not imitate a competitor wholesale. Competitor research is valuable, but it must remain subordinate to your positioning and differentiation. Over-imitation can erase the reasons customers should choose your product. Use the sequence below to turn observations into conversion hypotheses and prioritized actions.
A common error is to interpret a conversion gap as a content-volume problem. The magnetic car phone mount listing already contained compatibility information, installation instructions, material details, accessory images, and multiple functional claims. Yet the stronger page created more confidence because it demonstrated the product’s performance more clearly. This is why layout analysis should ask not only whether a feature is present, but whether the shopper can understand and believe its value quickly.
To Begin Conducting Amazon Competitor Analysis
Create a simple working document with one row per competitor. Add columns for image quality, title structure, bullet structure, A+ presence, price, review count, and rating band. Use the simplest buyer-language search terms. Set a fixed analysis session so comparisons remain consistent. Remember that competitors vary by customer segment. The brands you assume are competitors may not compete for the same click. Treat every row as a hypothesis about CTR or CVR, not as a final conclusion.
Step 1: Describe Your Product in the Simplest Possible Terms
Write one plain sentence describing what the product is and whom it serves. Remove brand language, internal product codes, and technical shorthand. Derive a search phrase of a few words from that sentence. Buyer language matters because it identifies the listings competing for the same click. The phrase is a starting point, not proof of search demand or market validation. Keep the wording simple enough for a real shopper to type without modification.
For the automotive accessory, the category phrase needed to make the product immediately recognizable as a magnetic car phone mount for MagSafe, rather than leading with “360° Adjustable.” That distinction matters because a feature-first title can make the shopper process the product’s capability before understanding the product category itself. A clearer category phrase supports both search recognition and early confidence.
Step 2: Open Your Internet Browser in a Clean, Logged-Out Search Context
Open a browser context without saved Amazon session history, then log out of your Amazon account. This reduces the influence of your own browsing and purchase history. Earlier behavior can still affect what a page shows, so treat one result page as indicative rather than perfectly neutral. If the results look unusual, repeat the check from a second clean context. Private browsing alone does not guarantee fully organic results or remove every form of personalization.
Steps 3-5: Search, Skip Sponsored Results, and Open 3-5 High-Review Listings
Search the phrase from Step 1. Set aside sponsored or clearly promoted results; paid placement is not evidence of conversion strength. Select three to five listings with the highest review counts. Review count indicates accumulated sales history, not guaranteed listing quality or CVR. If the leading listings look nearly identical, add a lower-ranked listing with strong ratings. Use the first two pages as a starting heuristic, then go deeper when the niche is competitive, the results look uniform, or an expected competitor type is missing.
Step 6: Study the Product Listings
This is where layout gaps become visible. Compare the main-image subject size and clarity, secondary-image content, title structure, bullet ordering, A+ content, price, rating band, and review quantity. Check whether images show scale, use context, or comparisons; whether the top benefit appears early; and whether A+ content answers objections. Record one stronger and one weaker dimension for each competitor. Convert each observation into a hypothesis: “Their second image shows scale; ours does not, which may suppress purchase confidence.” Do not treat one element as a guaranteed CVR lift. For durability or waterproof claims, remember that the claim is defined by a formal international ingress-protection standard but is typically self-declared by manufacturers rather than enforced as a government rule. Buyers should verify it carefully.
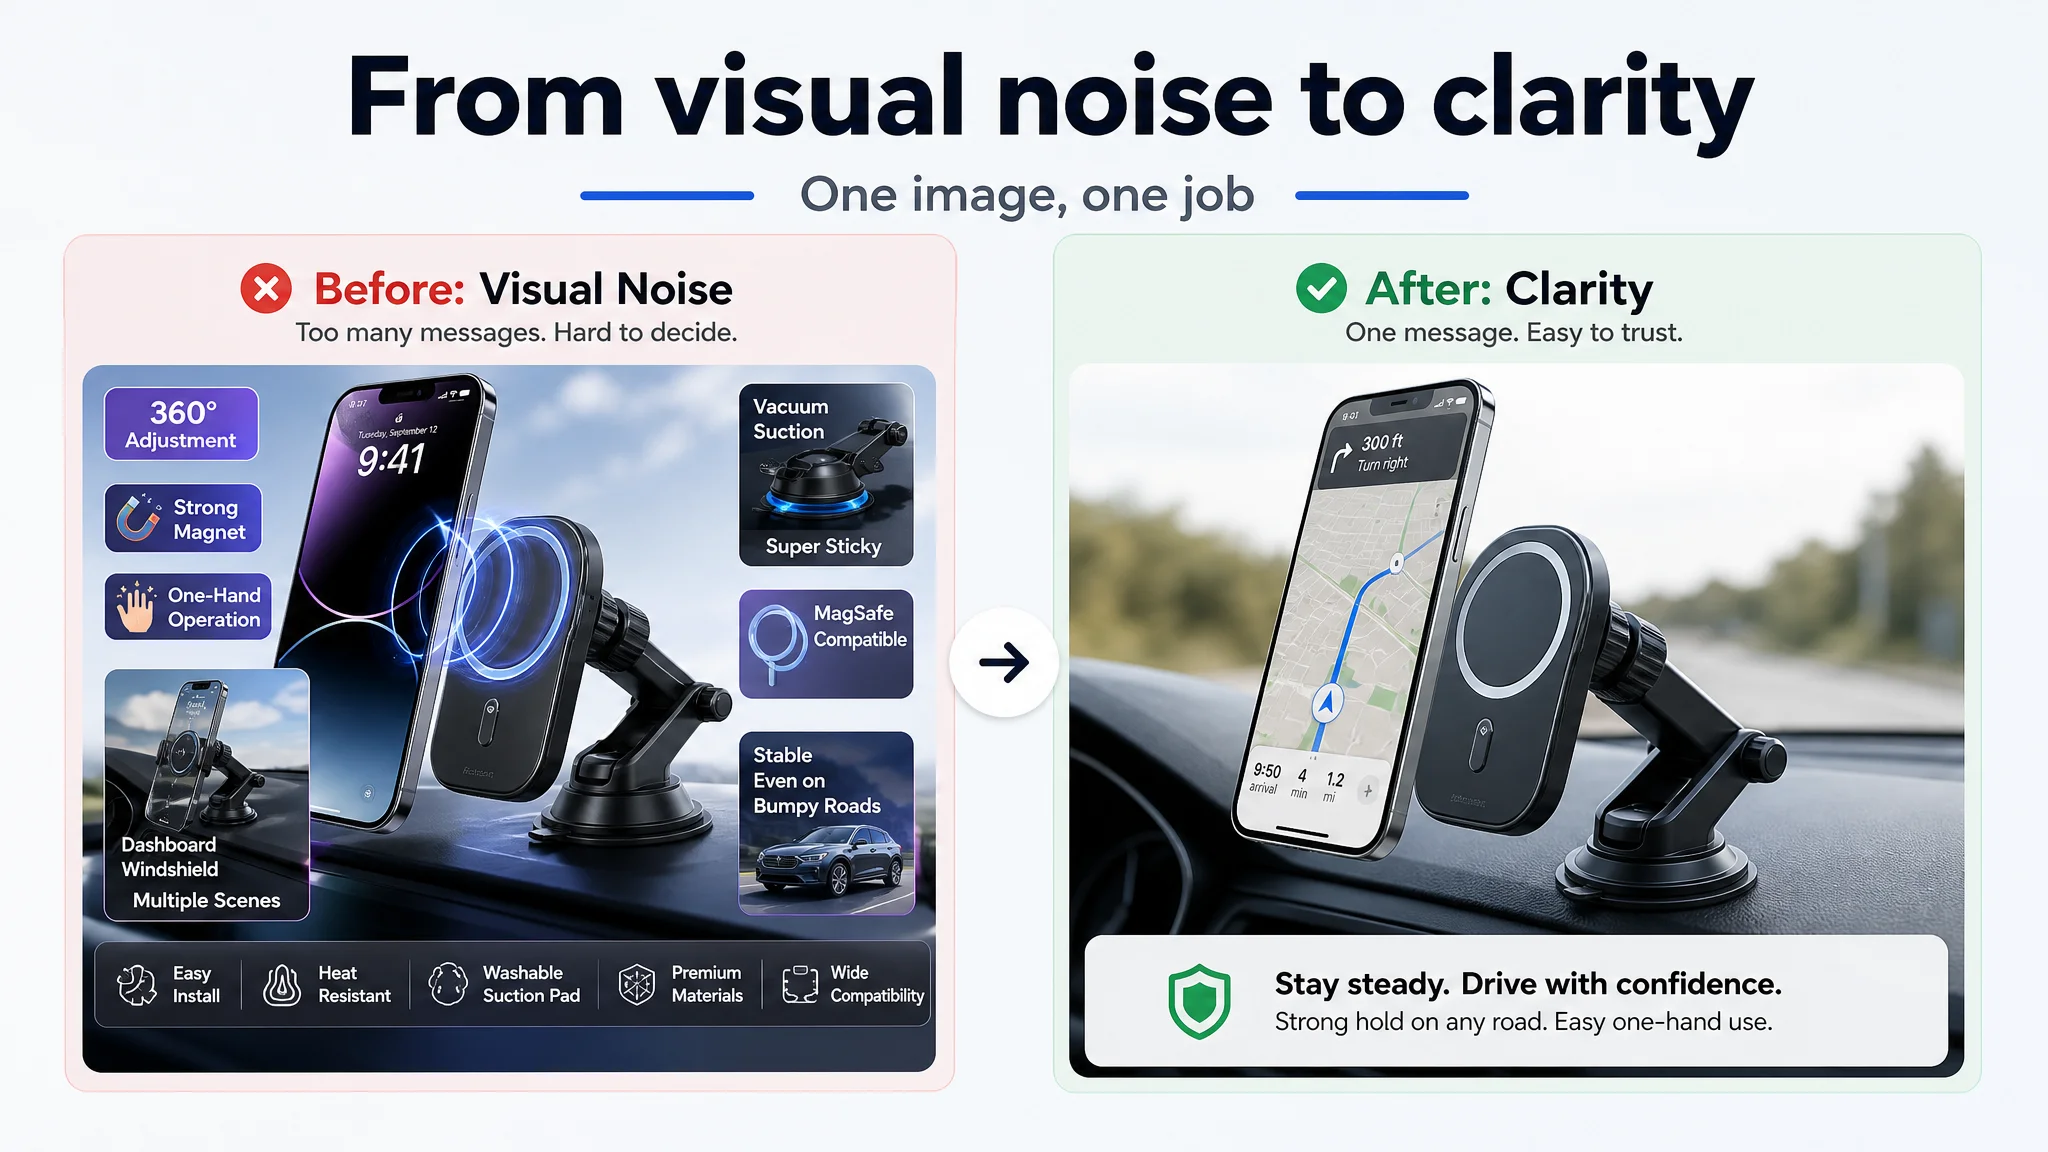
In the magnetic mount comparison, the visual gap was not simply that one page had more images. The customer page attempted to communicate rotation, load testing, magnetic performance, and other functions through dense compositions, multiple panels, decorative effects, and labels. The comparable page used a more controlled visual language and assigned each image a clearer job. This made the product easier to recognize as a thumbnail and made its physical performance easier to believe.
Study the image set as a sequence. One image can establish category recognition, another can show the product in a realistic dashboard or windshield setting, another can demonstrate adjustment range, and another can explain the magnetic or locking mechanism. When several claims compete inside one frame, the shopper may see more information but understand less of it. A layout gap often exists in the relationship between modules, not only in the individual assets.
Step 7: Study the Reviews
Read reviews on selected competitor listings and your own listing. Group repeated themes, including setup friction, fit or compatibility, durability or material complaints, and gaps between listing promises and delivered products. These patterns reveal expectation-management problems. A listing should address the two or three most common doubts near the top of the page. If buyers question durability or waterproofing, use precise, verifiable specifications rather than stronger language. Review themes may require copy changes, clearer images, or product changes. They inform listing decisions but do not prove that a competitor’s layout caused its performance.
Reviews can also show whether the listing is proving the right things. In the automotive accessory comparison, the customer page had detailed use experiences and installation guidance, but the comparable page had slightly stronger review scale and more review content connected to magnetic performance and use scenarios. That did not mean design could eliminate the review gap. It meant the listing needed stronger non-review proof, such as clearer compatibility logic and more credible demonstrations of stability and ease of use.
Steps 8-10: Analyze, Articulate, and Track the Gaps
Consolidate the notes into a shortlist ranked by expected conversion impact. Tie each gap to a module and a concrete action, such as clarifying the title, reordering benefits, adding scale context, or strengthening substantiated trust evidence. Write one guiding statement describing what your listing will do differently from the comparison set. Recheck two or three dimensions on a recurring cadence. Competitors change images, prices, and A+ content, so a useful diagnosis can drift. Where possible, connect changes to CTR, CVR, and ACoS observations rather than assumptions.
Turning Layout Gaps into Conversion Fixes
A competitor gap is useful only when it becomes an executable listing change. Start with a comparable benchmark: the same product form, use case, audience, and a reasonably similar price band. Then connect each gap to the buying decision it affects. A weak main image usually affects the click. Weak detail-page structure affects confidence and objection handling. Validate changes through CTR, CVR, return data, and customer feedback rather than assuming an improvement.
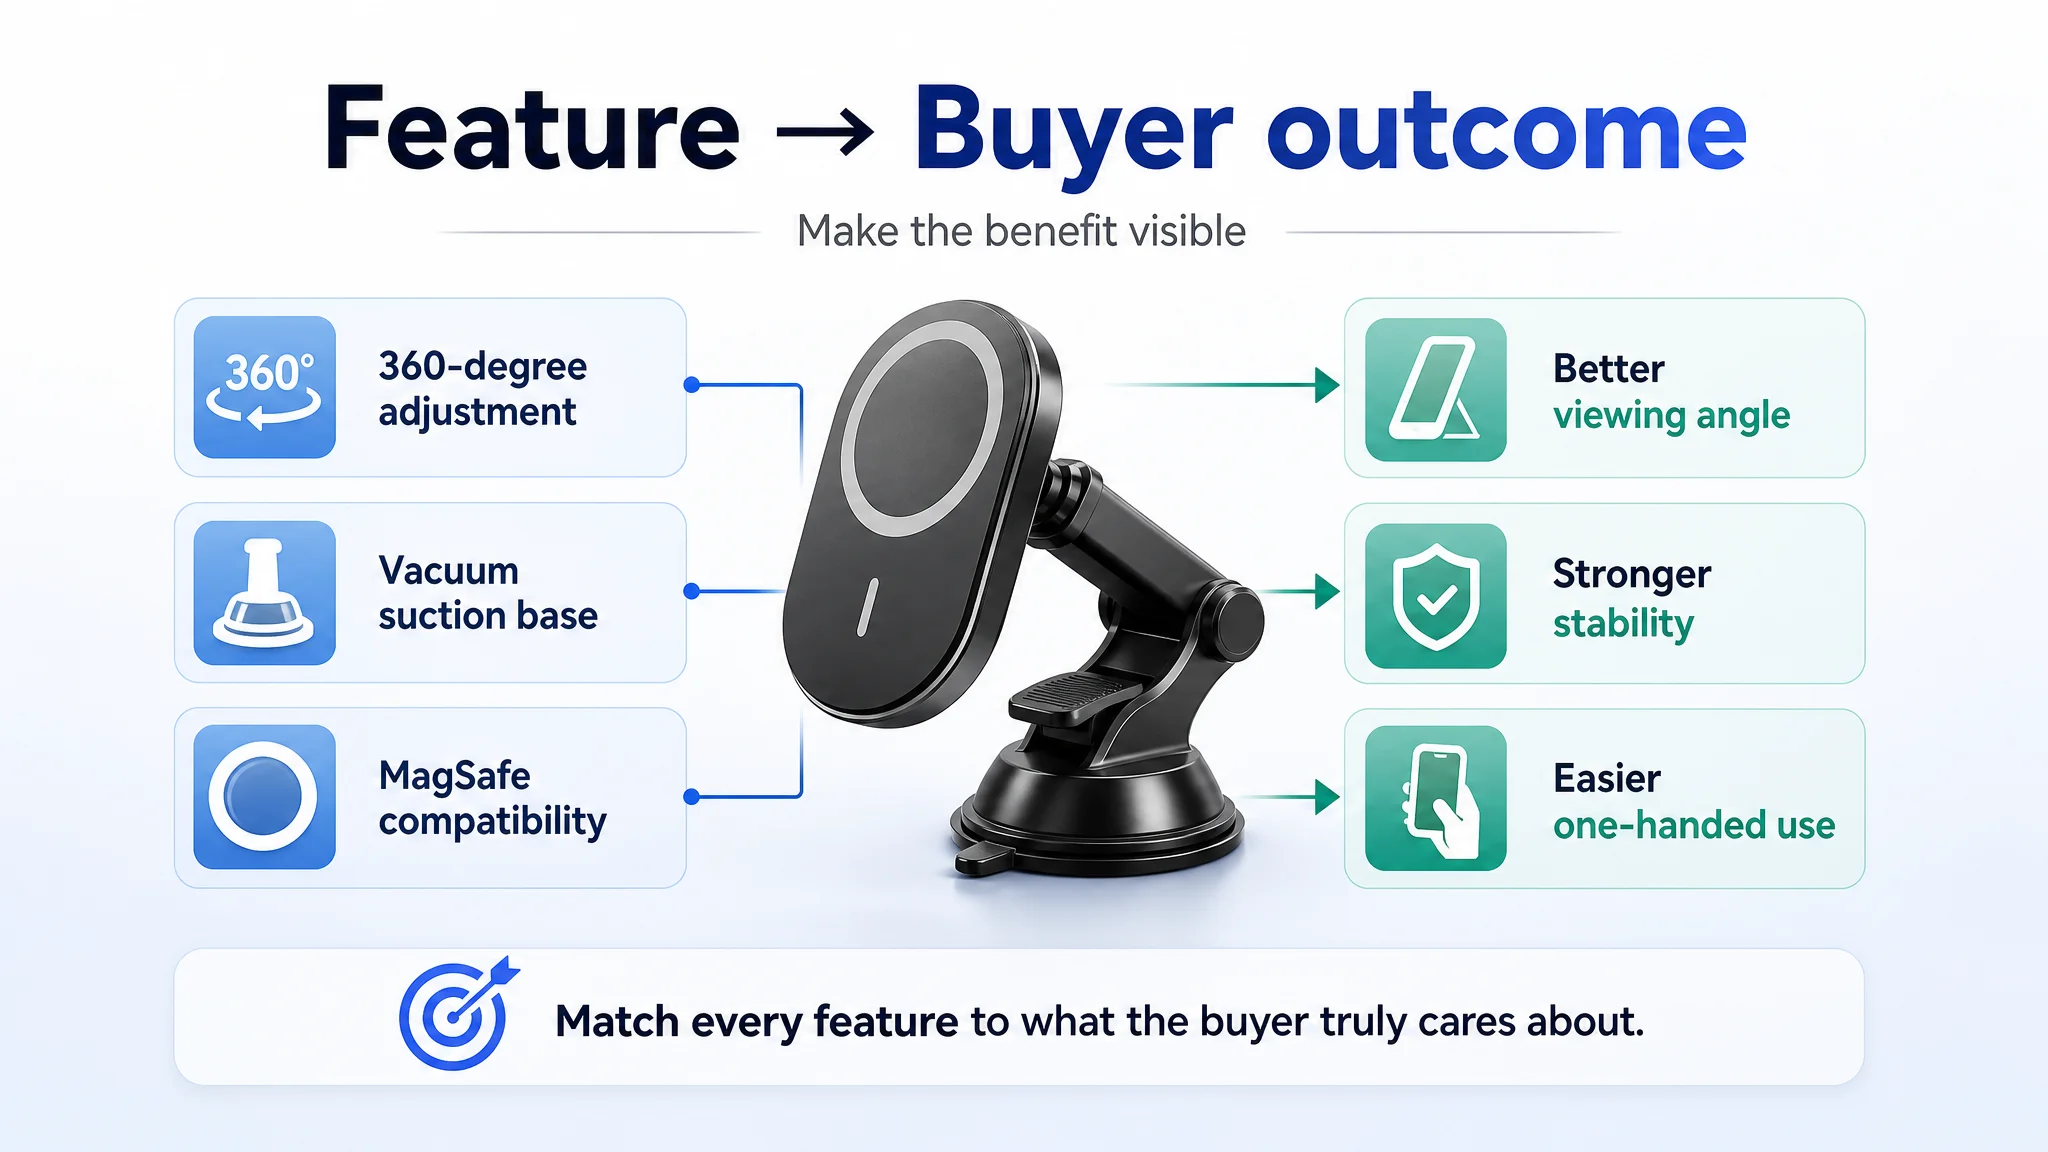
The distinction between a feature and a buying argument is central. The automotive listing had a 360-degree adjustment mechanism, a vacuum suction base, a magnetic attachment system, and MagSafe compatibility. Those features were real, but the page initially presented them as separate technical components. The more useful conversion logic was to connect each one to a concern: viewing angle, stability, one-handed use, or device compatibility. A listing does not become persuasive by adding more claims; it becomes persuasive when the existing claims answer the shopper’s actual questions.
- Main image — change the click decision. Make the product large, clear, and correctly framed. Strengthen subject prominence, contrast, visual focus, and product proportions while preserving the actual structure, materials, logo placement, and functional openings. Follow Amazon requirements for white-background presentation, correct proportions, RGB format, and the required pixel dimensions. The trade-off is that a stronger composition cannot compensate for an inaccurate product depiction. Any image that creates product-image mismatch can increase refunds and negative reviews. If an image iteration is published, connect the change to subsequent CTR data so the visual hypothesis can be evaluated rather than judged by taste.
The automotive listing showed how visual density can weaken this first decision. Floating product-and-phone compositions, strong purple or blue effects, several scene panels, and multiple functional labels competed for attention. The issue was not that the product lacked visual material. It was that the product’s visual center was difficult to identify quickly. A more stable composition with the mount as the primary subject would make the category and basic value easier to recognize. A visual asset should not merely contain a feature; it should make the feature easy to believe.
- Title — change the click and early-confidence decision. Lead with the brand and primary benefit or outcome, followed by the product form and differentiating attribute. Put high-value search terms and the clearest reason to choose the product before incidental descriptors. Remove redundant modifiers. The trade-off is limited title space: adding secondary details can weaken the first impression and obscure the core offer.
In the comparison, “Magnetic Car Phone Mount for MagSafe” established the category earlier than a title beginning with “360° Adjustable.” The latter described a useful feature, but it made the shopper process a capability before the product type. Moving the category phrase forward was therefore not simply an SEO adjustment. It improved the reading logic of the offer.
- Bullet points — change the confidence and objection decision. Order bullets by purchase importance, not by internal product specifications. Address the most common objection early using a pain point, confirmed product evidence, and the problem the feature resolves. A bare parameter list may be accurate but still leave the buyer uncertain. The trade-off is that every benefit statement requires proof. Unsupported sizing, compatibility, performance, material, or durability claims can create returns and post-purchase disappointment.
The magnetic mount’s original bullets were organized around adjustability, suction mounting, magnetic attachment, compatibility, and installation. A more decision-oriented sequence would begin with magnetic attachment and one-handed use, then explain the suction base, viewing-angle flexibility, construction, compatibility, and setup. This does not require inventing performance figures. It requires translating “360-degree adjustment” into a viewing-angle benefit, “vacuum suction cup” into a stability concern, and “MagSafe compatibility” into a clear device-use explanation.
- A+ content — handle unresolved objections. Use A+ modules for doubts raised by the bullets, such as comparisons, usage scenarios, deeper explanations, or verified authority support. Do not repeat the same bullet copy. The trade-off is production effort and evidence burden; vague authority language cannot replace certifications, test evidence, specifications, or authentic usage information.
The automotive listing already included usage scenes, compatibility, installation, structural details, and accessories. Its remaining problem was proof strength. Shoppers still needed to understand whether the mount would stay upright, whether the viewing angle could be adjusted freely, whether the phone could be attached or removed easily, and whether the base would hold on a dashboard surface. A first-person attachment scene, a close-up of the locking base, or a clear demonstration of adjustment positions could answer these concerns more directly than another static product view.
- Price — position the purchase deliberately. Compare against a genuinely relevant set and test the position instead of assuming that lower is better. A cheaper offer can also signal lower quality when the comparison set is poorly matched. The trade-off is margin: price changes may influence CVR while affecting contribution, ACoS, and brand perception. Document the benchmark before changing the offer.
Converting a Diagnosis into Prioritized Execution with DeepBI Listing Scoring
DeepBI is an AI-centered, Amazon-only operating system spanning product competitiveness, advertising, and organic growth. This section focuses on its Listing module: the layer that converts competitive evidence into scored listing work. Its purpose is not to produce another generic content audit, but to create a traceable path from observable listing components to prioritized execution.
The Listing module evaluates the main image, title, bullet points, A+ content, and review structure across multiple dimensions. The score is built from concrete signals such as visual presentation, keyword and title structure, bullet-point logic, A+ completeness, information depth, benefit clarity, and review-related listing signals. The output provides more than a single grade. It identifies where the score gap occurs and connects that gap to a specific visual, copy, hierarchy, or benefit-presentation issue.
The magnetic mount comparison demonstrates why this distinction matters. The 77-to-86 difference did not mean that the lower-scoring page needed a longer list of edits. It showed that the page was behind in several connected dimensions. The title and main image were slightly weaker, while the bullets and detail page did more to limit the page’s ability to turn technical information into confidence. The review score also represented a trust constraint that design alone could not erase. A useful scoring system must therefore support interpretation, not merely rank pages.
Benchmark selection provides the comparison baseline. DeepBI identifies strong competitor ASINs through signals such as product form, function, use case, price band, audience, title, and bullet-point relevance. It then applies similarity boundaries so materially different products do not distort the diagnosis. The strongest genuinely comparable ASIN becomes the benchmark. Sellers can compare their listing against a defined standard rather than relying on personal taste or an arbitrary competitor sample.
The next layer is strategy generation. DeepBI translates the scoring report into a structured optimization list ordered by expected impact. Main-image weaknesses and visual-hook problems receive attention when the likely business effect is on click-through rate. Title, bullet, A+, hierarchy, and benefit-clarity issues are prioritized when they constrain conversion rate. Recommendations can cover:
- Copy that matches SEO intent while improving readability, pain-point coverage, proof, and conversion logic.
- Visual expression, including composition, viewpoint, lighting, scene relevance, and information density.
- Information hierarchy that helps shoppers understand the product and its use case quickly.
- Benefit presentation that connects category concerns, competitor expression, and a clearer optimization structure.
This workflow replaces a disconnected sequence of diagnosis, planning, production, and delivery. It also reduces manual listing work that can require substantial operator time. The operating metrics remain practical: CTR, CVR, content quality, and refresh speed. A stronger process does not guarantee a fixed uplift. It gives the team an explicit work queue, a defensible benchmark, and a faster listing cycle for testing changes through subsequent Amazon performance data.
Generating and Shipping Listing Assets with DeepBI and One-Click Sync
- DeepBI Listing Product Document, Combined Edition: DeepBI connects the full Listing workflow: diagnosis identifies gaps, strategy converts those gaps into executable recommendations, generation produces assets, and delivery sends approved changes to Amazon. The product profile and Product DNA remain the source of truth, so generated main images, detail images, A+ layouts, titles, and bullet points stay tied to the verified product structure, materials, logo, colors, and functional attributes. This control matters because unrestricted image generation can create product-image mismatch, which can damage CVR and increase post-sale risk.
- DeepBI Listing Product Document, Combined Edition: Image generation follows structured recommendations for composition, camera angle, lighting, scene elements, color direction, information density, and selling-point emphasis. Text generation can restructure titles around relevant search terms and product benefits, while bullet points can follow a benefit, proof, and problem-solution structure. The system produces multiple candidate versions in parallel rather than forcing the operator to accept a single output.
- DeepBI Listing Product Document, Combined Edition: Front-end previews and old-versus-new comparison keep selection under the seller’s control. Operators can compare the existing asset with each proposed replacement before publishing, review the likely layout and message, and apply only the approved image or text change. This is content production and controlled publishing, not experimentation. The comparison step reduces subjective review risk while preserving a clear record of which Listing version is being replaced.
- project_0100 — One-Click Apply and Amazon SP-API delivery: Manual delivery requires downloading files, renaming them, logging into the backend, and uploading assets one by one. DeepBI’s One-Click Apply module sends approved Listing changes through Amazon’s official Selling Partner API. It maps assets to Amazon positions such as Main, PT01-PT06, and A+ modules, reducing placement errors and shrinking listing cycle time from manual minutes to seconds. Submission status can also be tracked through Amazon’s returned processing or rejection states.
- project_0098 — Performance Evaluation: After an image is published, DeepBI can mark a visual iteration event in its ad reports so operators can observe subsequent CTR movement. This keeps diagnosis, strategy, generation, publishing, and old-versus-new review in one operating loop instead of separating creative work from performance analysis. High-converting Listing content also helps advertising and organic efforts compound because stronger pages absorb more of the traffic those sources send.
- project_0097 and project_0099 — Product DNA and generation risk control: Competitor assets can inform composition, lighting, and visual direction, but the generated result must remain authentic to the seller’s product and must not invent specifications, accessories, or unsupported effects. The commercial value comes from converting prioritized Listing recommendations into compliant, reviewable, publishable Amazon assets—not from open-ended creative output.
The automotive listing provides a useful boundary for this workflow. Its stronger direction did not call for unrestricted creative output or a complete visual redesign without evidence. It called for specific assets with specific jobs: a clearer product-centered main image, a believable driving scene, a readable adjustment demonstration, and restrained treatment of the magnetic function. This is the difference between generating more content and generating content that resolves a diagnosed conversion barrier.
Traffic Quality: The Advertising Bridge That Protects Listing Conversion Rate
Conversion rate equals orders divided by sessions. Irrelevant sessions increase the denominator without creating corresponding purchase demand. A strong Listing can therefore show a weak CVR when the traffic entering it is poorly qualified. Traffic quality and Listing quality must improve together. Better images, copy, and positioning cannot fully offset a stream of mismatched clicks.
Broad keyword targeting is a common source of this mismatch. A seller may bid on a general product term while selling a specific variant, attracting shoppers whose needs do not match the offer. Those sessions can dilute CVR and increase wasted spend without producing a reliable signal for Listing decisions.
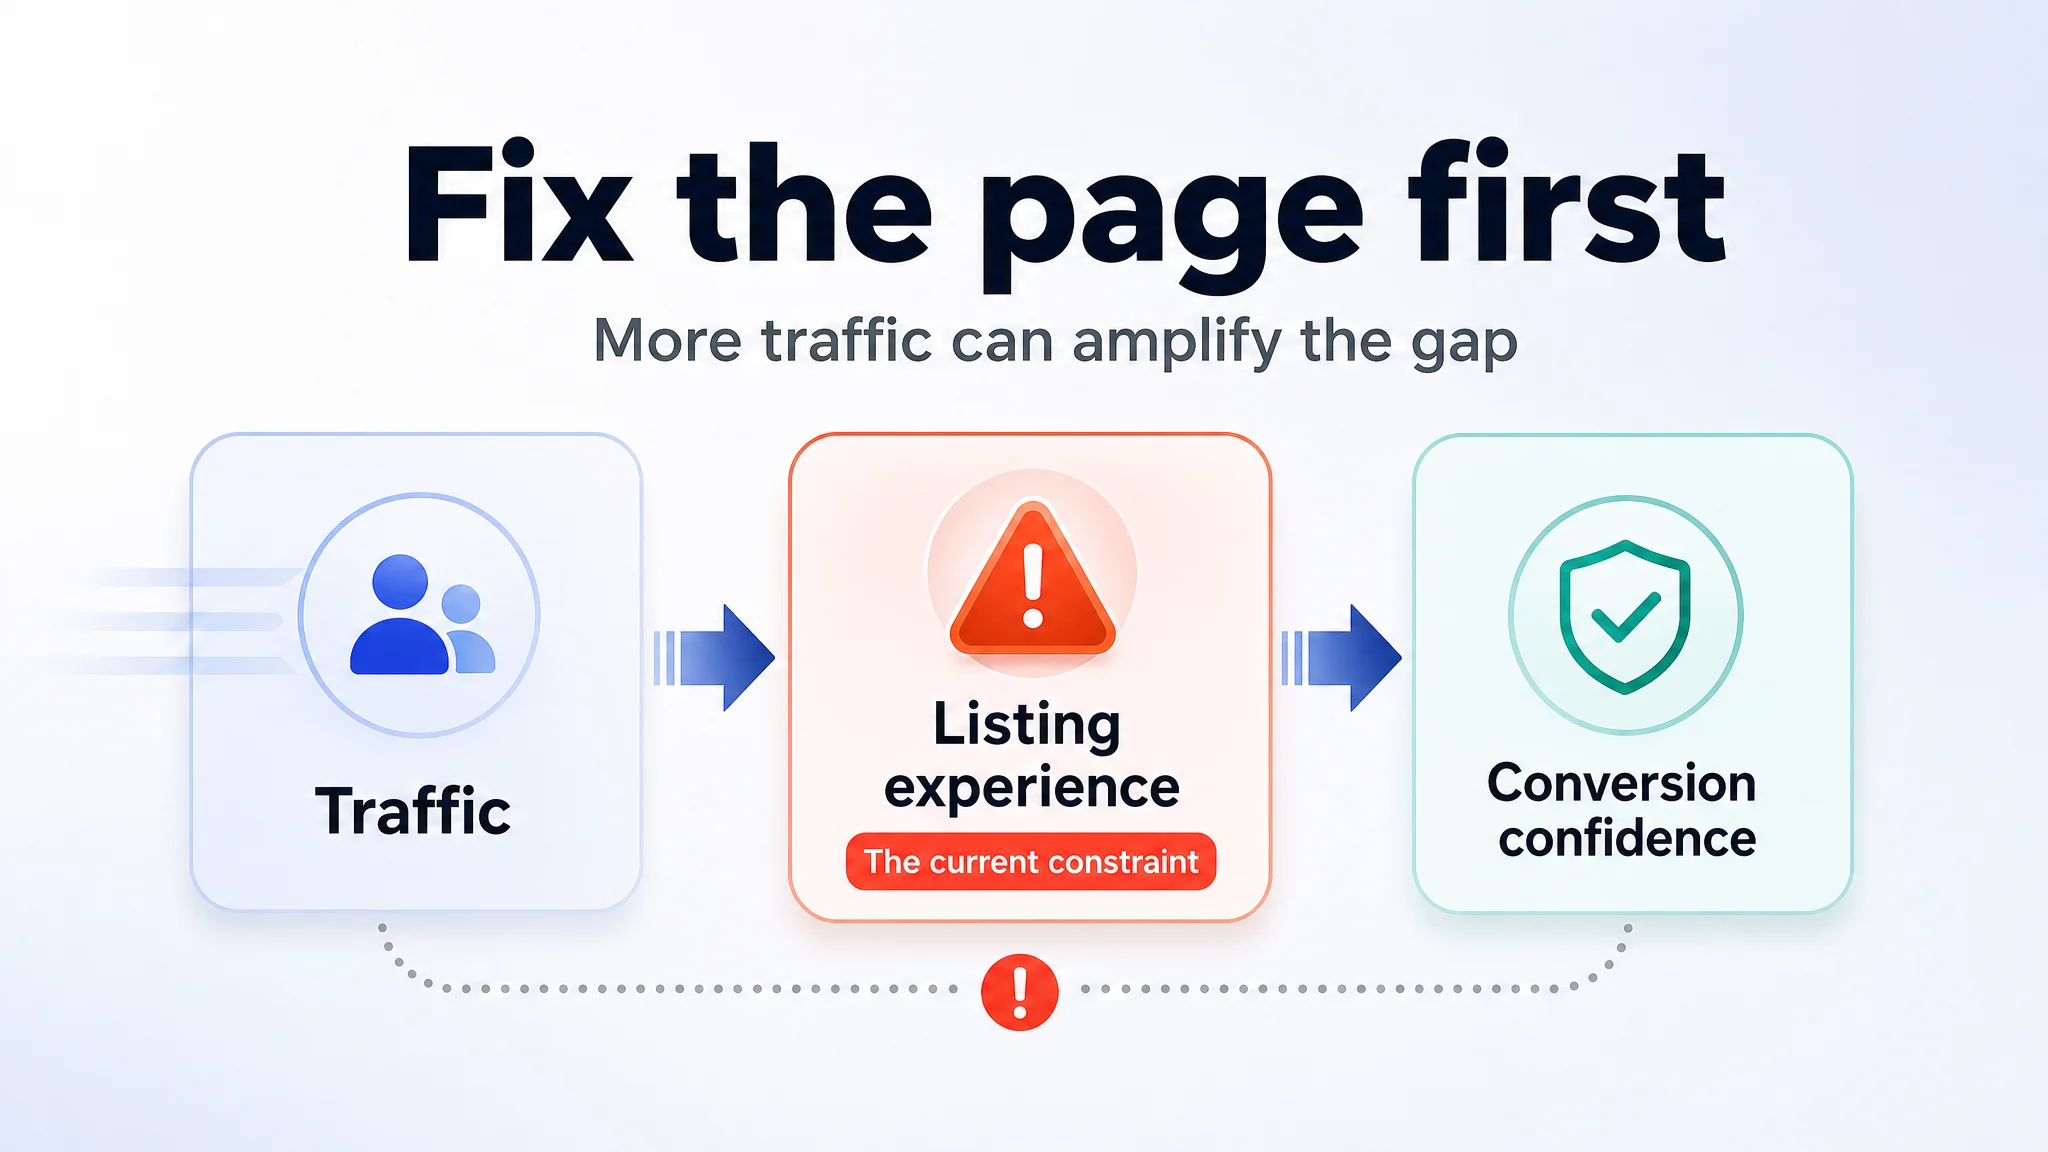
There is also a second risk: sending additional traffic to a page that has not resolved its central buying objection. In the magnetic mount case, the product page already contained a credible set of features, but the page did not fully demonstrate stability, locking performance, viewing-angle control, or one-handed use. More exposure would not automatically solve that communication gap. It could simply bring more shoppers into the same uncertain decision process.
DeepBI’s Amazon Sponsored Products approach uses a layered traffic funnel. It expands coverage across relevant keywords and competitor ASINs, then uses recent advertising data to filter low-converting traffic and focus attention on high-converting terms. Repeated testing separates promising targets from weak ones. Winners can then be scaled through budget and bid adjustments.
The operating loop should remain close to the data. Day-level bidding and budget changes use recent clicks, conversions, spend, and ACoS signals rather than fixed assumptions. This helps improve traffic selection while maintaining spend control. The objective is not advertising activity by itself, but better-matched demand reaching the Listing, where the improved page must absorb that traffic, convert it, and lift CVR.
A 30-Day Execution Plan for Improving Amazon Listing Conversion Rate
Treat the next 30 days as a controlled operating sequence rather than a series of disconnected edits. The objective is to isolate whether listing presentation, traffic quality, or both are limiting CVR.
- Week one: establish the baseline. Record sessions, order items, CTR, CVR, ACoS, and relevant ad terms. In Business Reports, use Order Item Session Percentage, calculated as order items divided by sessions. Log the result by ASIN and weekday. Then build a competitor comparison document using genuinely comparable products: similar form, use case, price band, audience, and validated customer expectations. Compare the main image and image set, title, five bullets, A+ content, and visible customer feedback. A bestseller is not automatically a valid benchmark.
Add a diagnostic question to the baseline: does the page contain information, or does it provide a clear buying argument? The magnetic mount listing demonstrates why this question matters. Its feature coverage was broad, but the page still lagged a comparable listing because the information was not arranged around practical concerns. This distinction helps prevent the team from treating every conversion issue as a traffic or content-volume problem.
- Week two: diagnose the layout gaps. Run a structured comparison between your listing and the selected competitors. Separate click-performance gaps from traffic-to-order gaps. A weak visual hook may affect CTR; missing usage explanation, trust evidence, or clear product information may affect CVR after the click. Rank each gap by expected business impact, evidence strength, and implementation cost. Conversion rate can mislead when session volume is thin, so use the internal baseline and traffic context rather than treating one reading as decisive.
For each major gap, record the initial assumption and the evidence that supports or challenges it. A team may initially assume that more technical language will increase confidence, as happened with the magnetic mount. The diagnosis instead showed that the stronger opportunity was to convert technical attributes into visible, believable outcomes. Writing down this shift makes the optimization logic auditable.
- Week three: publish the highest-impact edits. Prioritize the main image, image sequence, title, bullets, and A+ modules instead of rewriting everything simultaneously. Use a controlled old-versus-new review and record the exact application time. Keep every statement tied to confirmed product facts. Verify durability, waterproof, material, and rating wording before publication. Waterproof and durability ratings follow a formal international ingress-protection standard, but they are typically manufacturer-declared rather than government-enforced. Do not strengthen a claim beyond the verified specification.
Assign each image and copy block one job. A main image should establish product recognition, a secondary image should clarify use context or physical operation, bullets should resolve purchase concerns, and A+ content should demonstrate the claims that remain difficult to understand from text alone. This prevents the dense, multi-message presentation that weakened the automotive listing’s first-glance clarity.
- Week four: refine traffic and re-measure. Shift the advertising mix toward higher-intent terms and send better-matched sessions to the revised listing. Do not judge the edit by traffic volume alone. Re-measure Order Item Session Percentage through the same Business Reports path and on the same weekday used for the baseline. Maintain a recurring weekly review, with a deeper monthly comparison. The decision metric is the CVR trend against the internal baseline. If the result disappoints, diagnose traffic quality and remaining layout gaps before considering any pricing action. Do not default to more discounting.
The method is simple but not casual: measure correctly, benchmark against your own category reality, identify competitor layout gaps, fix the highest-impact presentation problems, and keep traffic quality aligned with listing quality. Competitor analysis should sharpen differentiation, not replace it. Copying another page can create an invalid comparison and weaken product positioning. The durable edge comes from a genuinely better product and a listing that presents its confirmed value honestly.
The magnetic car phone mount example also shows why numerical caution matters. The comparison established a score gap and a change in operating judgment, but it did not provide post-optimization CTR, CVR, ACoS, or organic-order data. Those results should not be invented. The reliable conclusion is narrower and more useful: before increasing traffic, determine whether the page makes the product easy to recognize, understand, and trust.
Start today by exporting the relevant Business Reports data, recording the baseline on your chosen weekday, and opening the comparison document. Then ask the most important diagnostic question before making another edit: is the listing missing information, or is it failing to turn existing information into a convincing buying decision?