


Why Your Amazon Listing Suddenly Lost Ranking (And How to Fix It)
A sudden organic rank drop is rarely as sudden as it looks. More often, a slower chain is already in motion: a rating, availability, or creative change weakens click or conversion behavior; Amazon receives weaker relevance and performance signals; visibility then erodes. The productive response is diagnosis first—isolate the failing signal, verify the likely cause, and only then change the listing. This section previews a relevance-versus-performance lens and a diagnosis-first approach to recovery, not a promise of restored rank.
Lead with the diagnosis promise
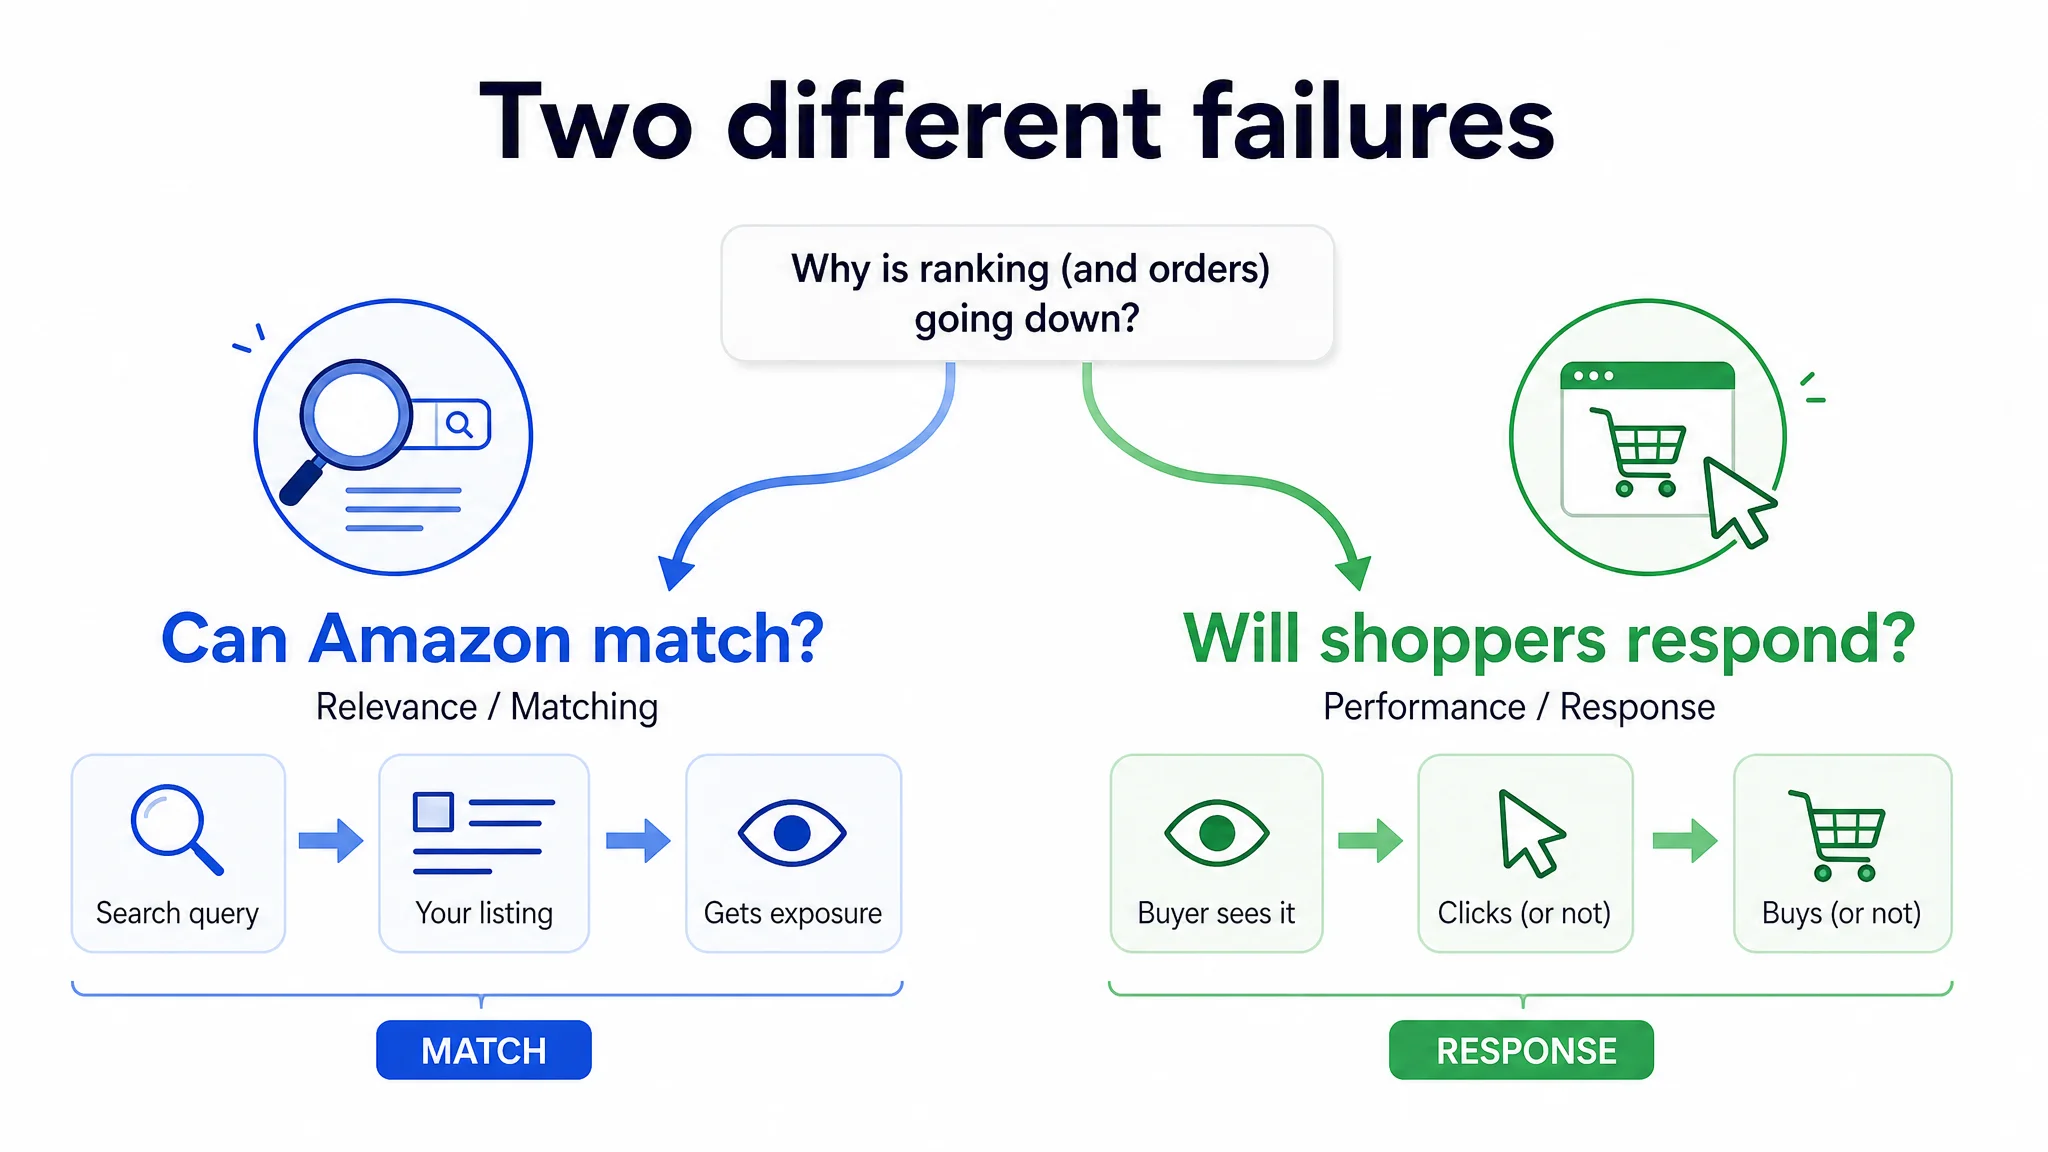
The promise here is disciplined diagnosis, not a guaranteed rebound. Ranking recovery starts with an objective baseline: what changed, when, and which shopper signal moved first. Without that baseline, optimization becomes guesswork—subjective edits can consume time and budget while CTR or CVR keeps falling. A practical relevance-versus-performance model separates two questions. Relevance asks whether Amazon can confidently match the listing to a query; performance asks whether shoppers click and convert once they see it. Both sides matter, but they fail differently. Low CTR paired with a weak main image suggests a missing visual hook. Low CVR paired with weak detail-page proof or review sentiment suggests traffic is arriving but not being convinced. Cross-checking these signals against listing dimensions turns a vague rank problem into a testable diagnosis.
That distinction is not academic. In one US OTC hearing-aid account, the team had ads running and an A+ page that was actually richer and more emotionally coherent than the benchmark competitor’s. Yet orders were not following traffic. Internally, the discussion kept returning to familiar explanations: bids were not aggressive enough, keywords might be wrong, or the listing simply needed more reviews over time. When the listing was benchmarked against a category-leading competitor, the visible weakness was not a lack of traffic or technical specs. It sat at the front of the funnel: the title and bullets spoke in parameters, the main image did not make comfort or anti-loss obvious, and a fragile review profile introduced doubt at the moment of decision. The page could still match queries, but it was not converting the traffic it already had. That is exactly why diagnosis has to separate “can Amazon match this listing?” from “does the shopper respond once the listing is seen?”
Rank drops are lagging indicators, not sudden events
In 2026, with search results crowded and buyer attention scarce, a rank decline is better treated as a diagnostic prompt than as proof of a single algorithm change. Organic rank is an output. It reflects prior signals: how shoppers respond in search, how well the listing converts, and whether availability and rating support the promise made in the click. Consider a rating dip or a short stockout. Either can weaken conversion, especially when a shopper sees the change at the moment of decision. Weaker CVR can then reduce the listing’s competitive standing in search, and visibility may soften with a lag. The same logic applies to CTR: if the main image or title loses its relative pull, clicks can fall before rank does. These are hypotheses to verify, not verdicts. The diagnosis-first path is to confirm which signal moved first, then act on the cause rather than the symptom.
The hearing-aid account showed this lagging-indicator logic in a concrete way. The seller’s review profile was about 4.1 stars with only 7 reviews, and roughly 29% of those reviews were 3 stars or below. The benchmark competitor had 4.6 stars, 150 reviews, and no low-star reviews on the first page. The team knew reviews were weaker, but the working assumption was that review volume would improve with time. The more important issue was that the existing review profile was already shaping CVR: it created uncertainty exactly where a risk-averse hearing-aid buyer needed reassurance. By the time a rank decline becomes visible, that kind of trust signal has often been weakening conversion for a while.
How Amazon Organic Ranking Actually Works in 2026: Relevance vs. Performance Signals
Organic rank is not a single lever you can tune directly. It is better read as two stacked evidence sets: whether the listing matches shopper intent, and whether shoppers who see it respond. Diagnosis gets clearer when you separate the two instead of treating every rank decline as a keyword problem.
Relevance signals
Relevance is the entry ticket. Amazon can only reliably judge a listing against a query when the keyword-intent match is clear: title, bullets, backend terms, category node, and attributes point to the same use case. A title that carries high-frequency search terms but blurs selling-point clarity can create a weak match even when the product fits. Category fit matters because a listing placed in a broad or adjacent node competes against different shopper expectations. Listing-content alignment is the cross-check: image content, text modules, and function descriptions should map to each other. When visual claims and copy drift apart, relevance weakens before performance data arrives.
In the OTC hearing-aid listing, relevance was not the main failure. The title correctly front-loaded “OTC Hearing Aids for Seniors,” which is the kind of phrase Amazon needs to understand the category and query. But the rest of the title leaned on parameters such as “32-Channel Digital Sound” and “7 Volume Levels,” while the competitor led with outcome and emotional benefit: superior sound quality, smart noise cancelling, no feedback, and only later the OTC and accessory details. So the listing could still be matched to the right intent, but the title did a weaker job of turning that match into a click. That is a relevance-adjacent problem, but it is also a performance problem: the searcher sees the result and still does not get a simple answer to “Will I hear clearly, without whistling and hassle?”
Performance signals
Performance is the proof layer. Shoppers see the listing, click or do not click, buy or do not buy, and Amazon interprets those interactions as evidence. The core signals are CTR, conversion rate, sales velocity, availability, and price competitiveness. Low CTR usually points to a weak visual hook or an offer that does not stand out in search results; low CVR points to a detail-page trust or information-density problem. Availability gaps and price positioning can suppress both. Many rank declines begin here because relevance can remain intact while response quality erodes: the listing still matches the query, but fewer shoppers click, fewer convert, and sales velocity softens. That is why a rank drop can appear without any obvious keyword change.
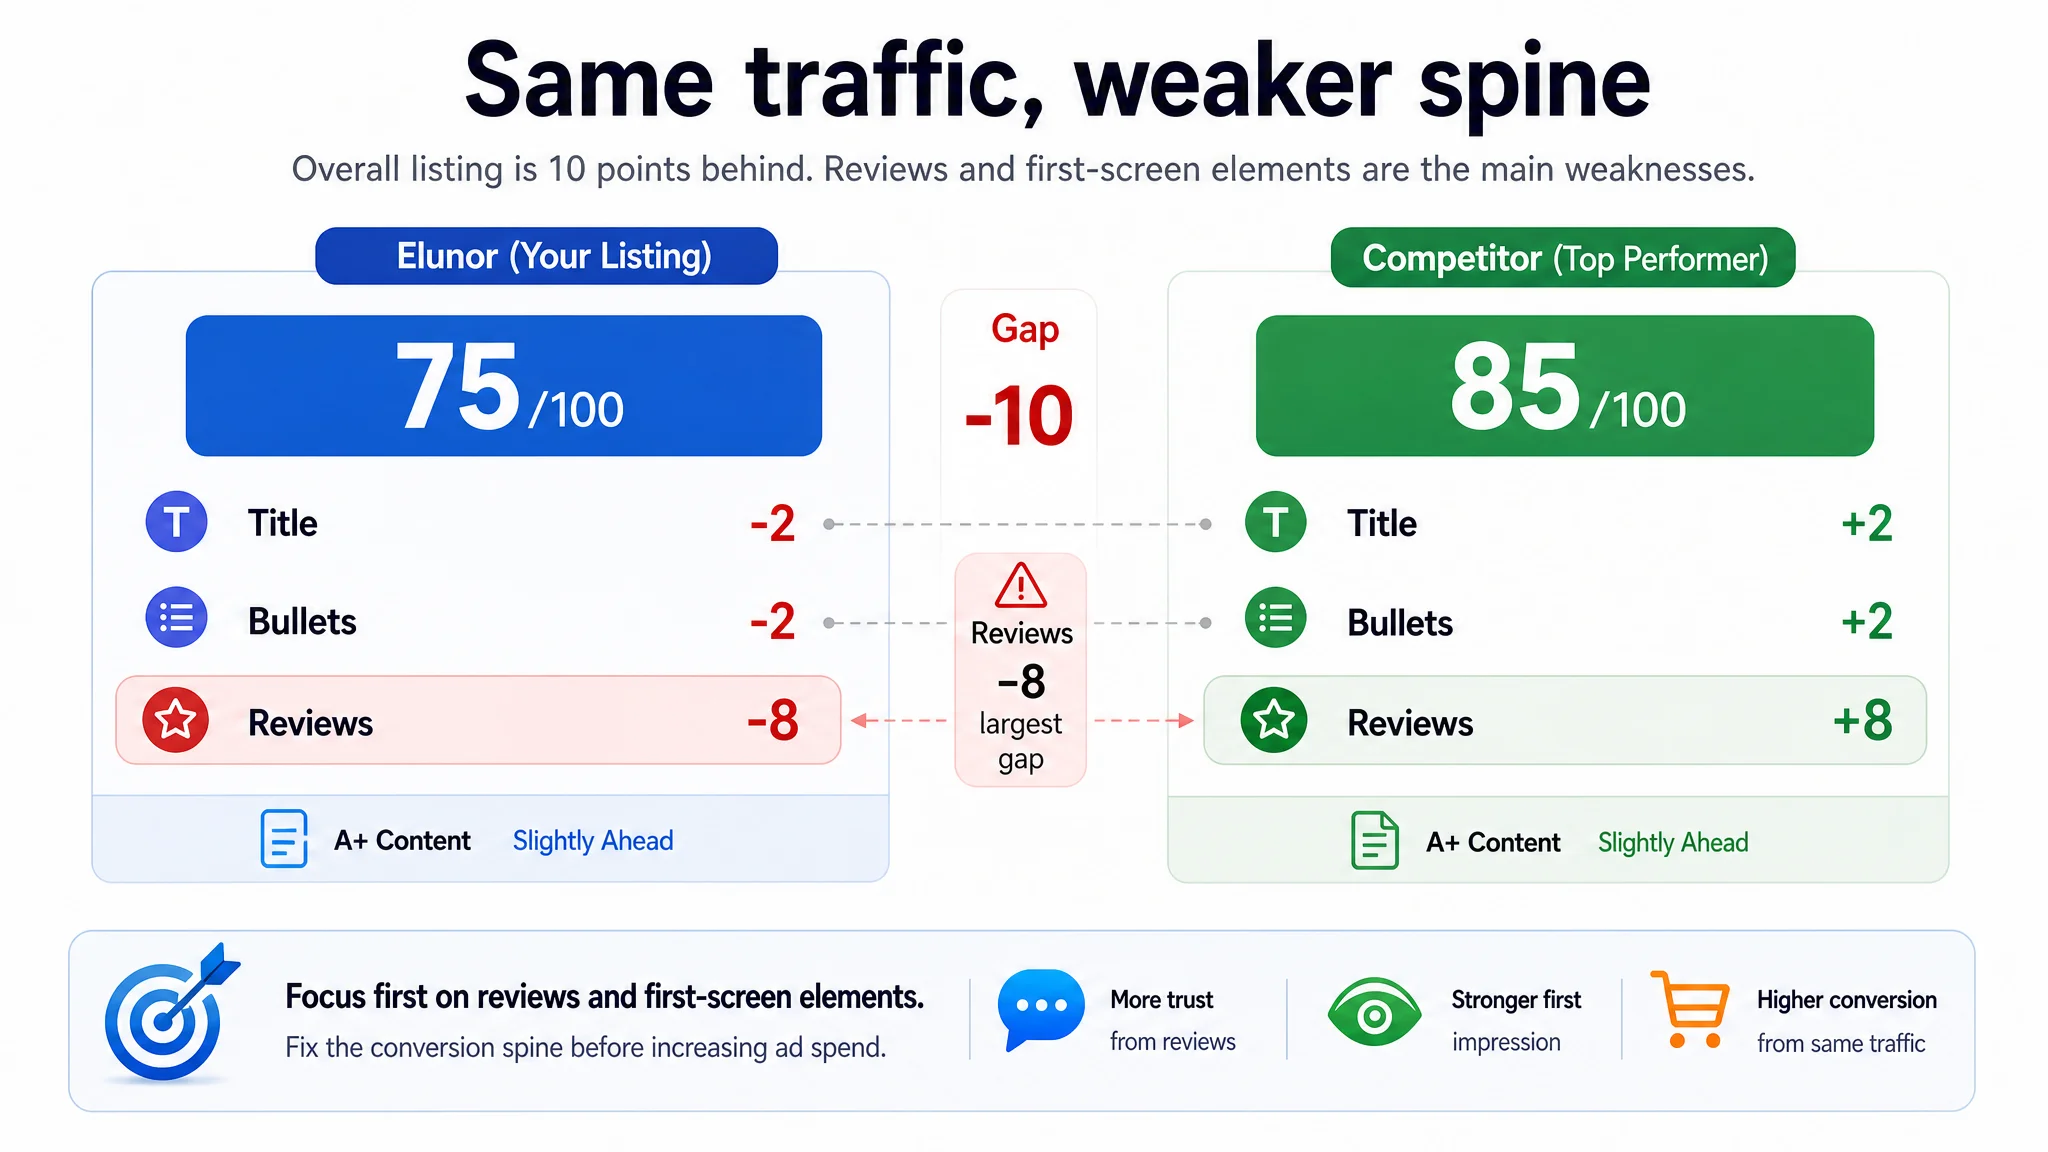
The hearing-aid listing is a useful example of performance signals failing while the product looked “complete” on paper. The product had real technical advantages: 32-channel digital sound, dual-chip processing, a neckband anti-loss design, voice low-battery alerts, and a 40-hour battery life. The A+ page was slightly ahead of the competitor in logic and depth. But against the benchmark competitor, the listing scored 75/100 versus 85/100. Title was down 2 points, bullets were down 2 points, the main image was slightly ahead on raw score but had structural issues, and reviews were down 8 points—the largest single gap. The seller had traffic, ads, and a relatively strong A+ backbone, but the first screen and social proof were not carrying the buyer from interest to conviction. That is a performance-layer diagnosis, not a traffic-quantity diagnosis.
Why separation matters for diagnosis
Separation prevents the wrong fix. If impressions are stable but CTR falls, rewriting keywords may not solve the problem; the main image, price, coupon, or review signal may need attention. If CTR is healthy but CVR falls, traffic is arriving but the detail page is not carrying trust. DeepBI's organic-traffic mapping can help prioritize keywords by CTR, CVR, and order value and focus Top of Search support on priority terms. This is prioritization support, not a ranking guarantee. DeepBI can also use ad reports and listing data to mark visual iteration events and observe CTR movement after a change, connecting execution to measurement rather than subjective judgment. The diagnostic rule is simple: fix relevance when the listing is matched to the wrong intent; fix performance when the right shoppers arrive but do not respond. Keeping those questions separate makes the recovery plan narrower, faster to test, and easier to judge against CTR, CVR, ACoS, BSR, and listing cycle time.
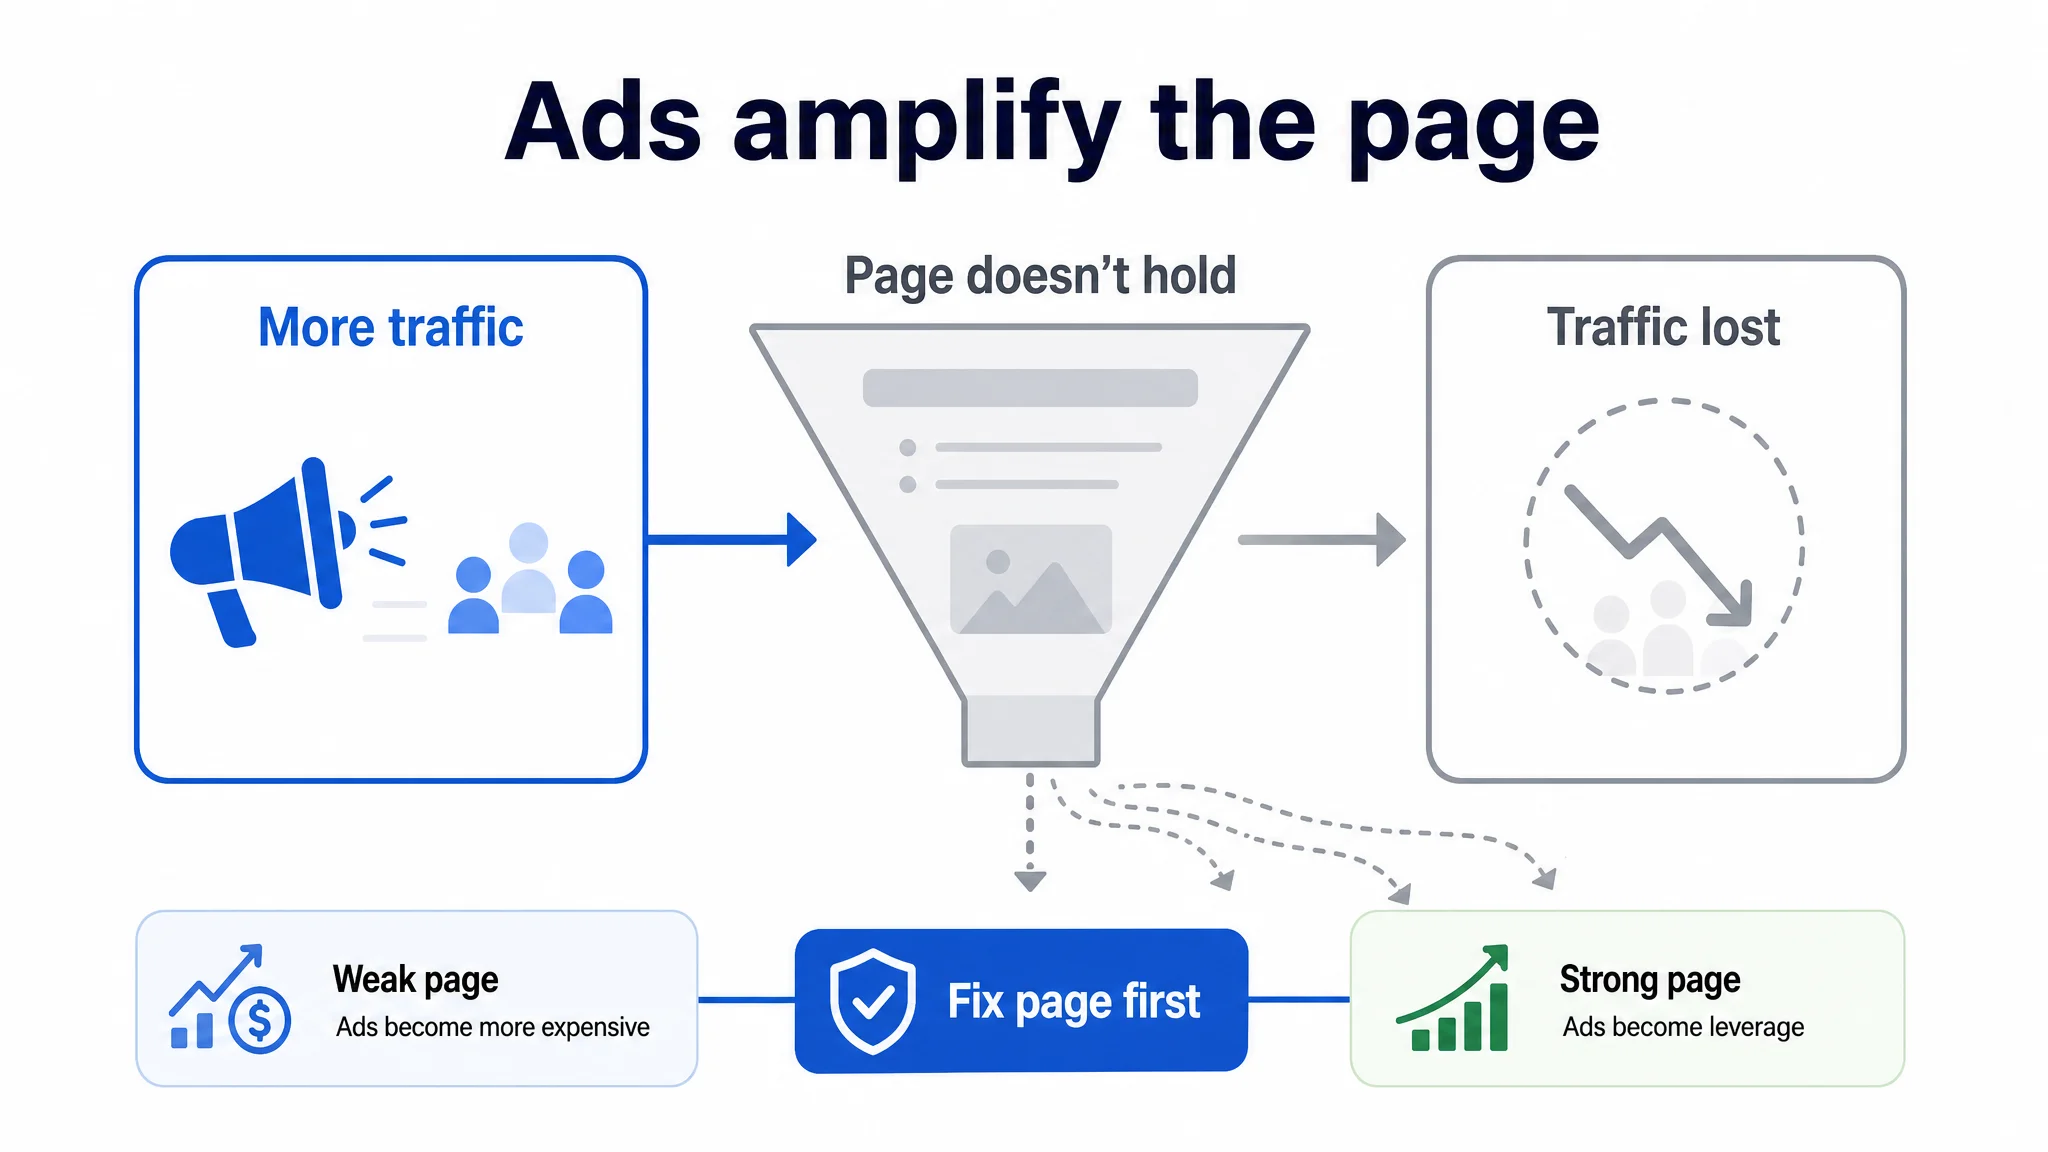
This is why the hearing-aid seller’s first instinct—rebuild campaigns, split more keyword groups, adjust bids more frequently, push harder on branded terms—was not the recommended starting point. From a purely ad-operations view, those are plausible actions. But the listing could not yet fully convert the traffic it was already paying for. The account also had an internal contradiction: some visuals showed 35 hours of battery life while the text claimed 40 hours. Sending more ad traffic into that page would have amplified confusion, not fixed it. If CTR is acceptable and CVR lags, the leverage point is often the detail page and first-screen trust, not the campaign console.
The Most Common Reasons Your Ranking Dropped
Most organic rank declines are not mysterious. They trace to five causes, and each one leaves an observable signal in your listing, offer, or inventory data. Work through them in order before assuming an algorithm change.
1. Review loss or rating movement
Signal to check: review count trend and the star-rating distribution in your VoC view, against a benchmark competitor.
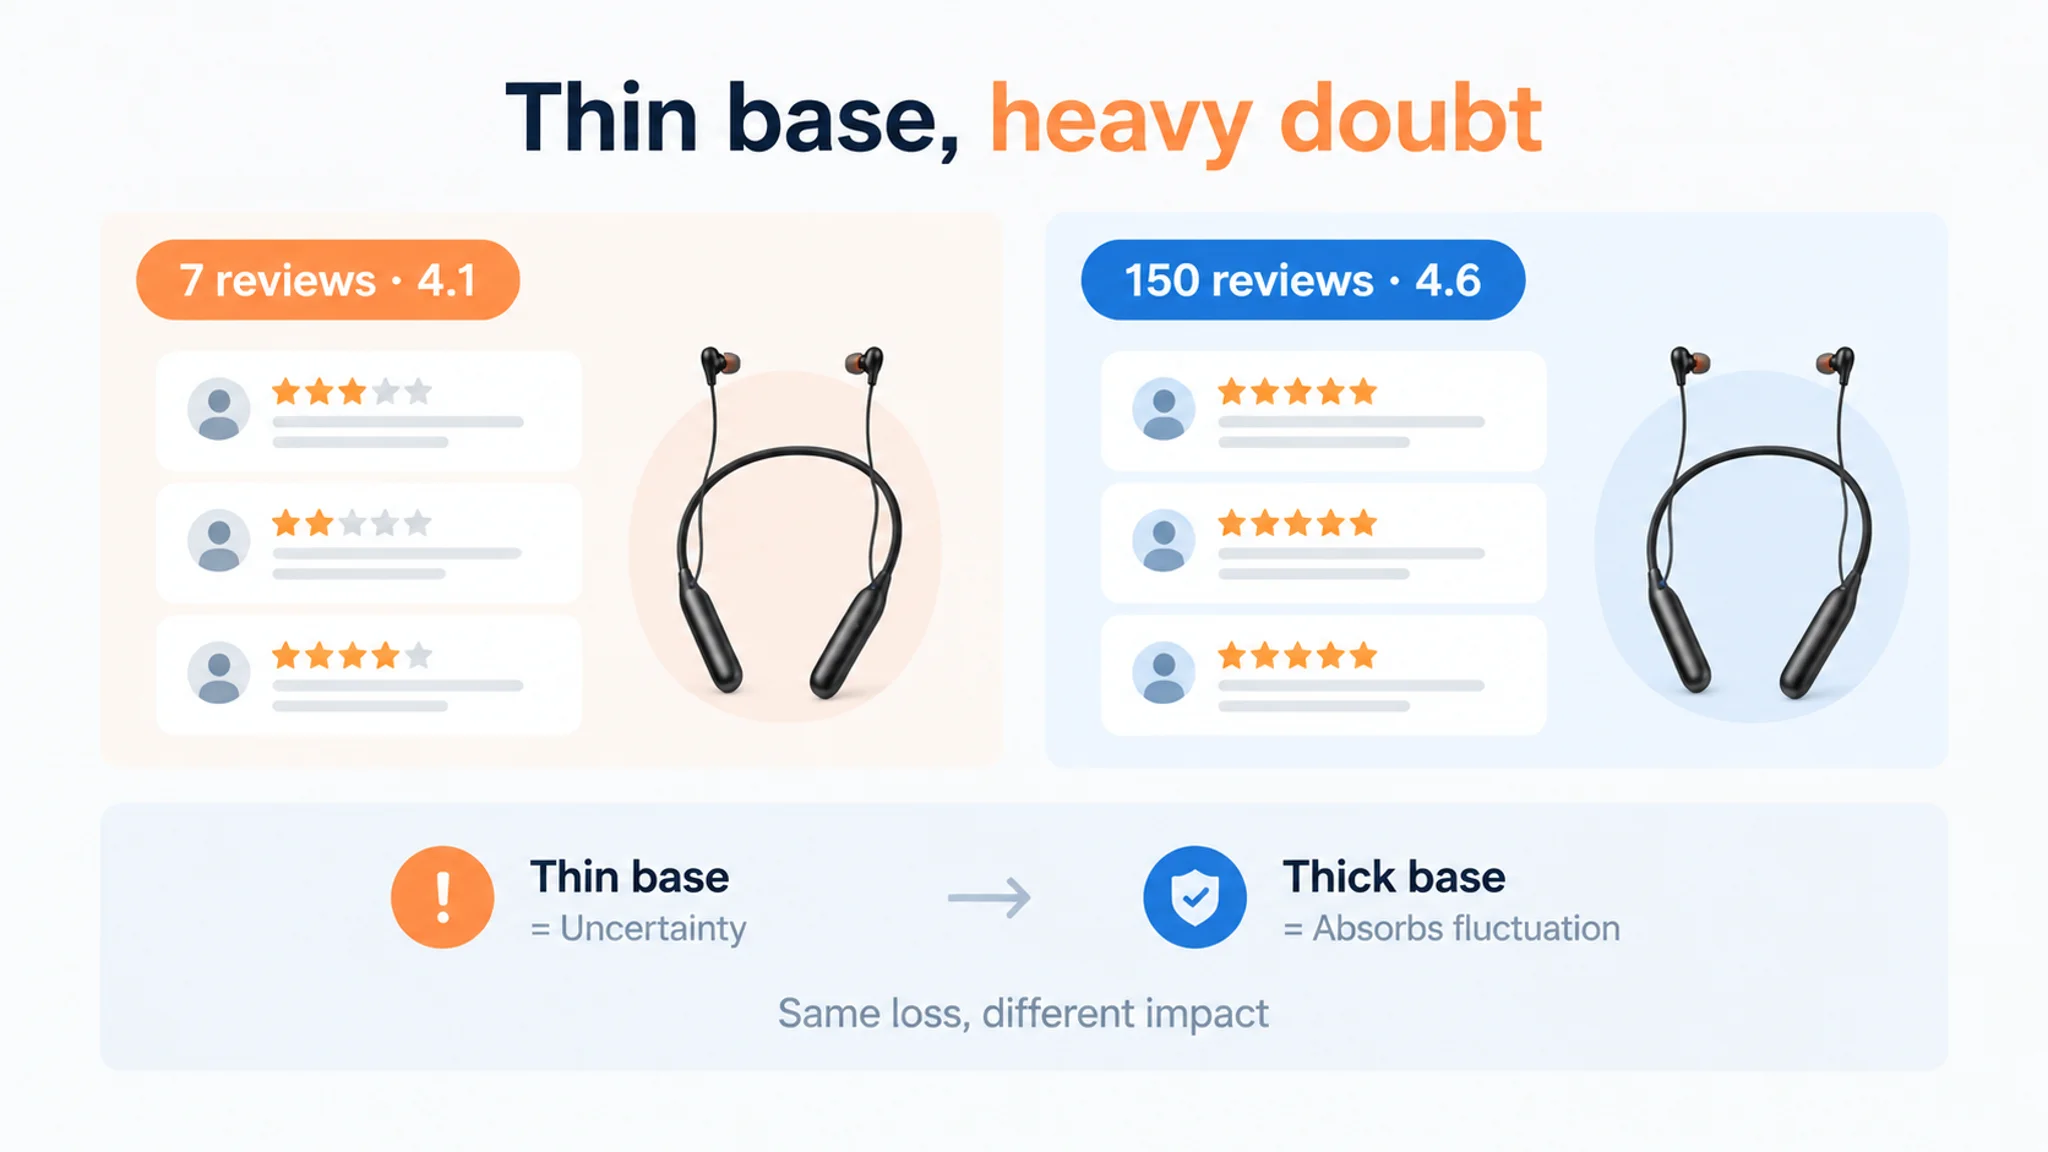
Rating impact depends on scale. Losing a handful of reviews moves the average only when the review base is thin, or when the lost reviews were recent and highly rated. A large, evenly distributed base absorbs the same loss with little visible movement in CVR. Fix: track new-review velocity weekly, isolate the themes behind downgrades or removals, and correct the product or fulfillment issue underneath rather than chasing the star number itself.
The hearing-aid account shows why the distribution matters as much as the star count. With about 4.1 stars and only 7 reviews, the customer’s review base was thin enough that a small number of low-star reviews carried disproportionate weight. Nearly 29% of reviews were 3 stars or below, while the benchmark competitor had 150 reviews, 4.6 stars, and no low-star reviews on the first page. The team’s initial read was “we need more reviews,” which was not wrong, but it was incomplete. The existing review structure was already part of the page’s conversion logic: it made buyers question whether the device would really solve their hearing problem. Listing changes cannot instantly fix review volume, but they can reduce new negative experiences and remove contradictions that make the existing review profile feel riskier than it needs to.
2. Losing the Buy Box
Signal to check: Buy Box ownership share by ASIN, plus the offer-level details behind each loss.
Price is one input, not the whole equation. A below-MAP offer from a reseller can undercut your price and compress margins, but a MAP violation is not an Amazon Buy Box eligibility criterion — treat it as a commercial problem, not a ranking mechanism. Fix: review price competitiveness, fulfillment method, seller health metrics, and offer-level availability, then correct whichever input actually moved.
3. Running out of stock
Signal to check: days of cover per SKU against expected sales velocity.
When inventory reaches zero, recent sales velocity weakens and the climb back can be slower than the drop. It does not reset your performance history to zero, and you are not rebuilding without data. Fix: restock, restore availability, and ramp ad spend gradually while watching BSR recovery and CVR, instead of assuming rank returns on its own timeline.
4. Drop in click-through rate
Signal to check: CTR against your category benchmark. A CTR below 0.35%, paired with a weak main-image score, points to a missing visual hook.
Also check keyword-intent match. If impressions arrive from search terms your listing does not actually serve, impression-to-click behavior degrades even when the image is strong. Fix: rebuild the main image around the primary use case, align title keyword layout with high-frequency search terms, and confirm that impressions and clicks come from the same intent.
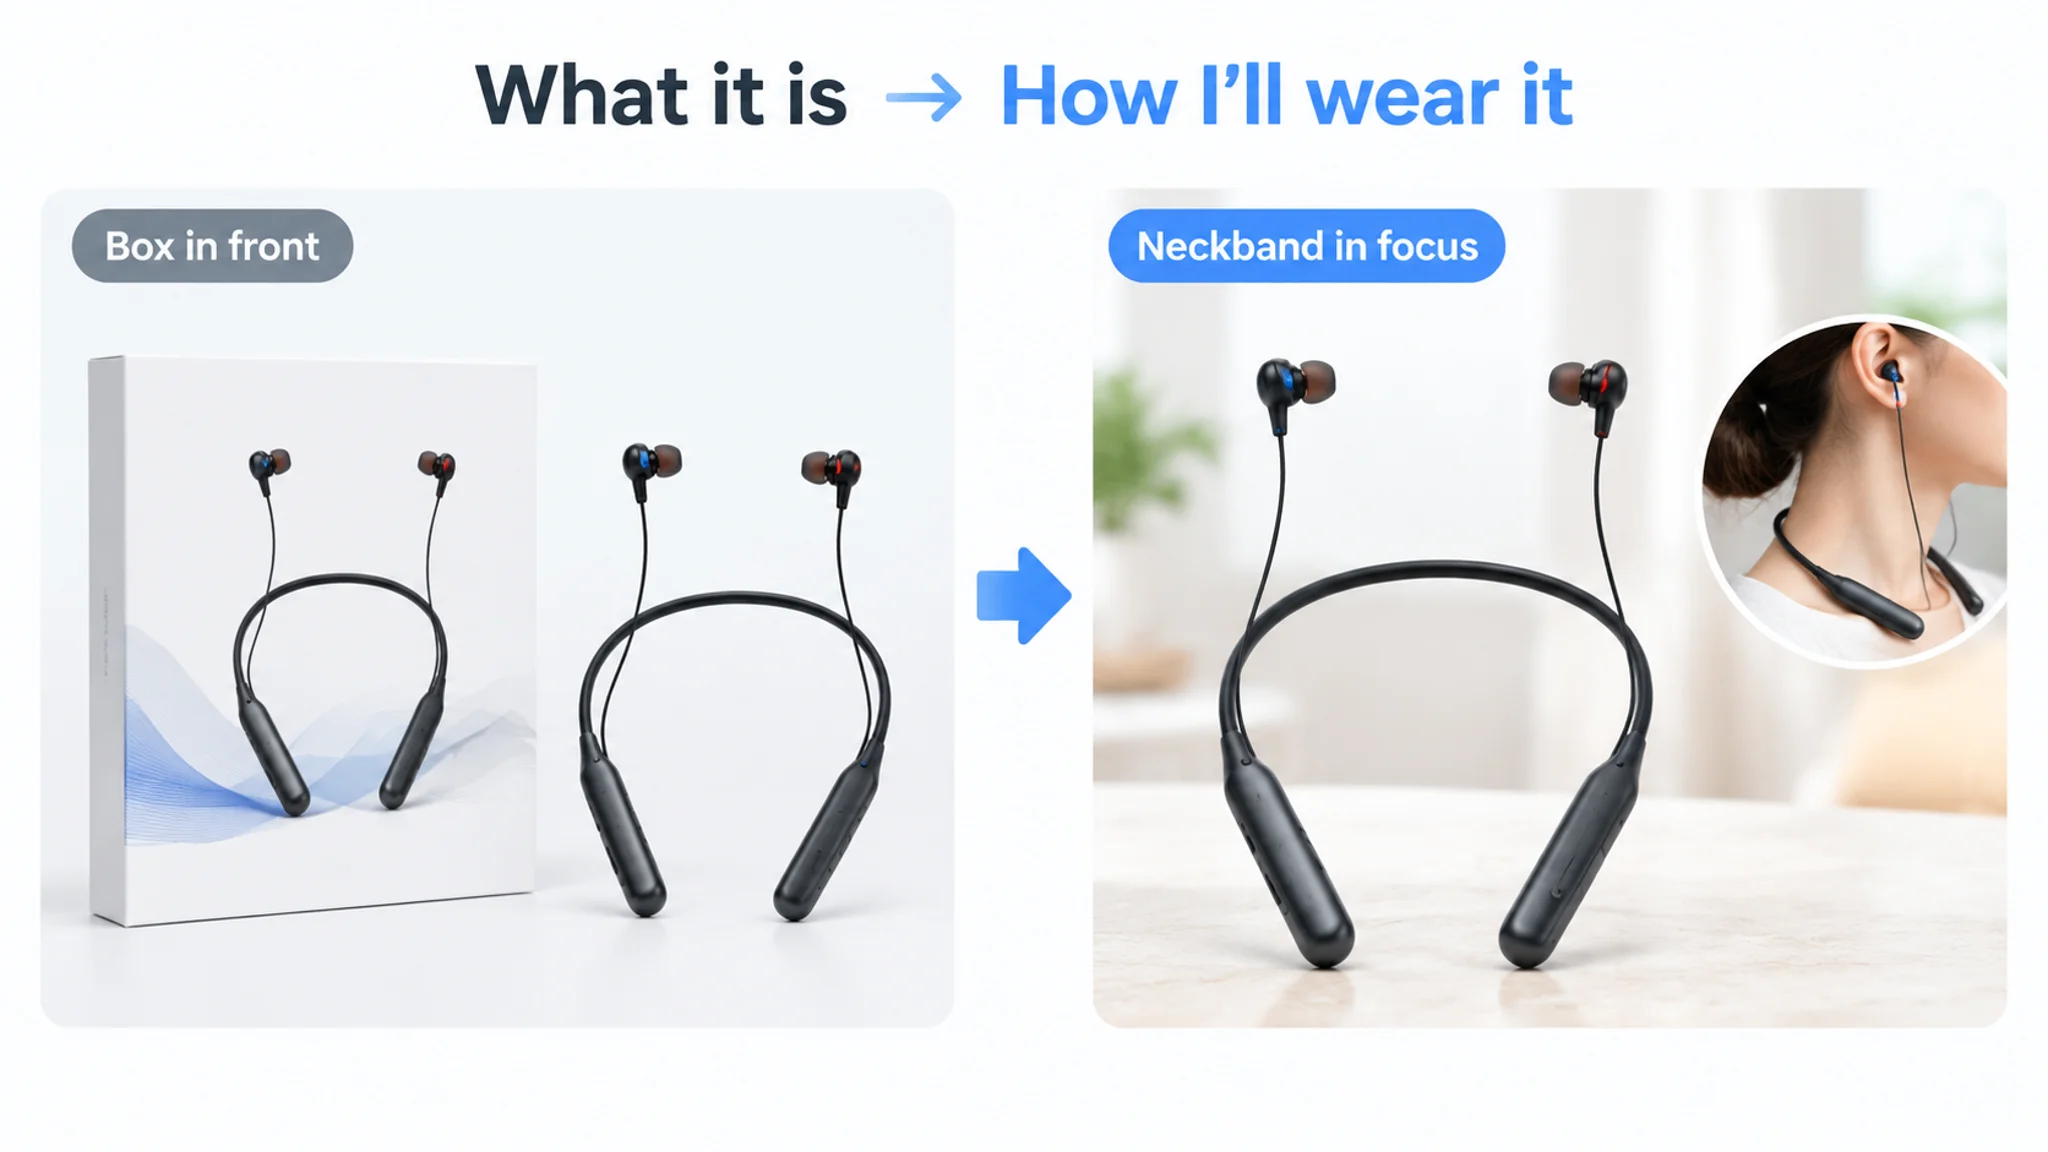
The OTC hearing-aid main image is a good example of a visual set that looked technically clean but was under-leveraged for trust. The primary image included the product, color, neckband design, and packaging, but the box occupied too much space and diluted focus. Left/right color cues were underused, there was no strong early visual for the anti-loss neckband or a real person wearing it comfortably, and the technical callouts focused on channels and dB rather than “hear your family clearly” or “wear all day without worry.” On paper, the main image scored slightly above the competitor. From a decision standpoint, it still failed to create a simple, trustworthy reason to click. That is how CTR weakness can appear even when the image is not obviously “bad.”
5. Conversion-rate decline
Treat every cause here as a hypothesis until the data agrees. A CVR below 7%, alongside weak detail-page and VoC scores, suggests traffic is not being absorbed.
Hypotheses worth testing: bullets that list parameters without connecting them to user problems, A+ modules missing comparison tables or proof elements, price-perceived-value gaps, thin high-quality image reviews. A structured audit across main image, title, bullets, A+, and VoC keeps those tests orderly instead of guesswork. Cross-check ad reports for CTR, CVR, and ACoS movement in the same window as any listing change, so you can separate a real cause from coincidence.
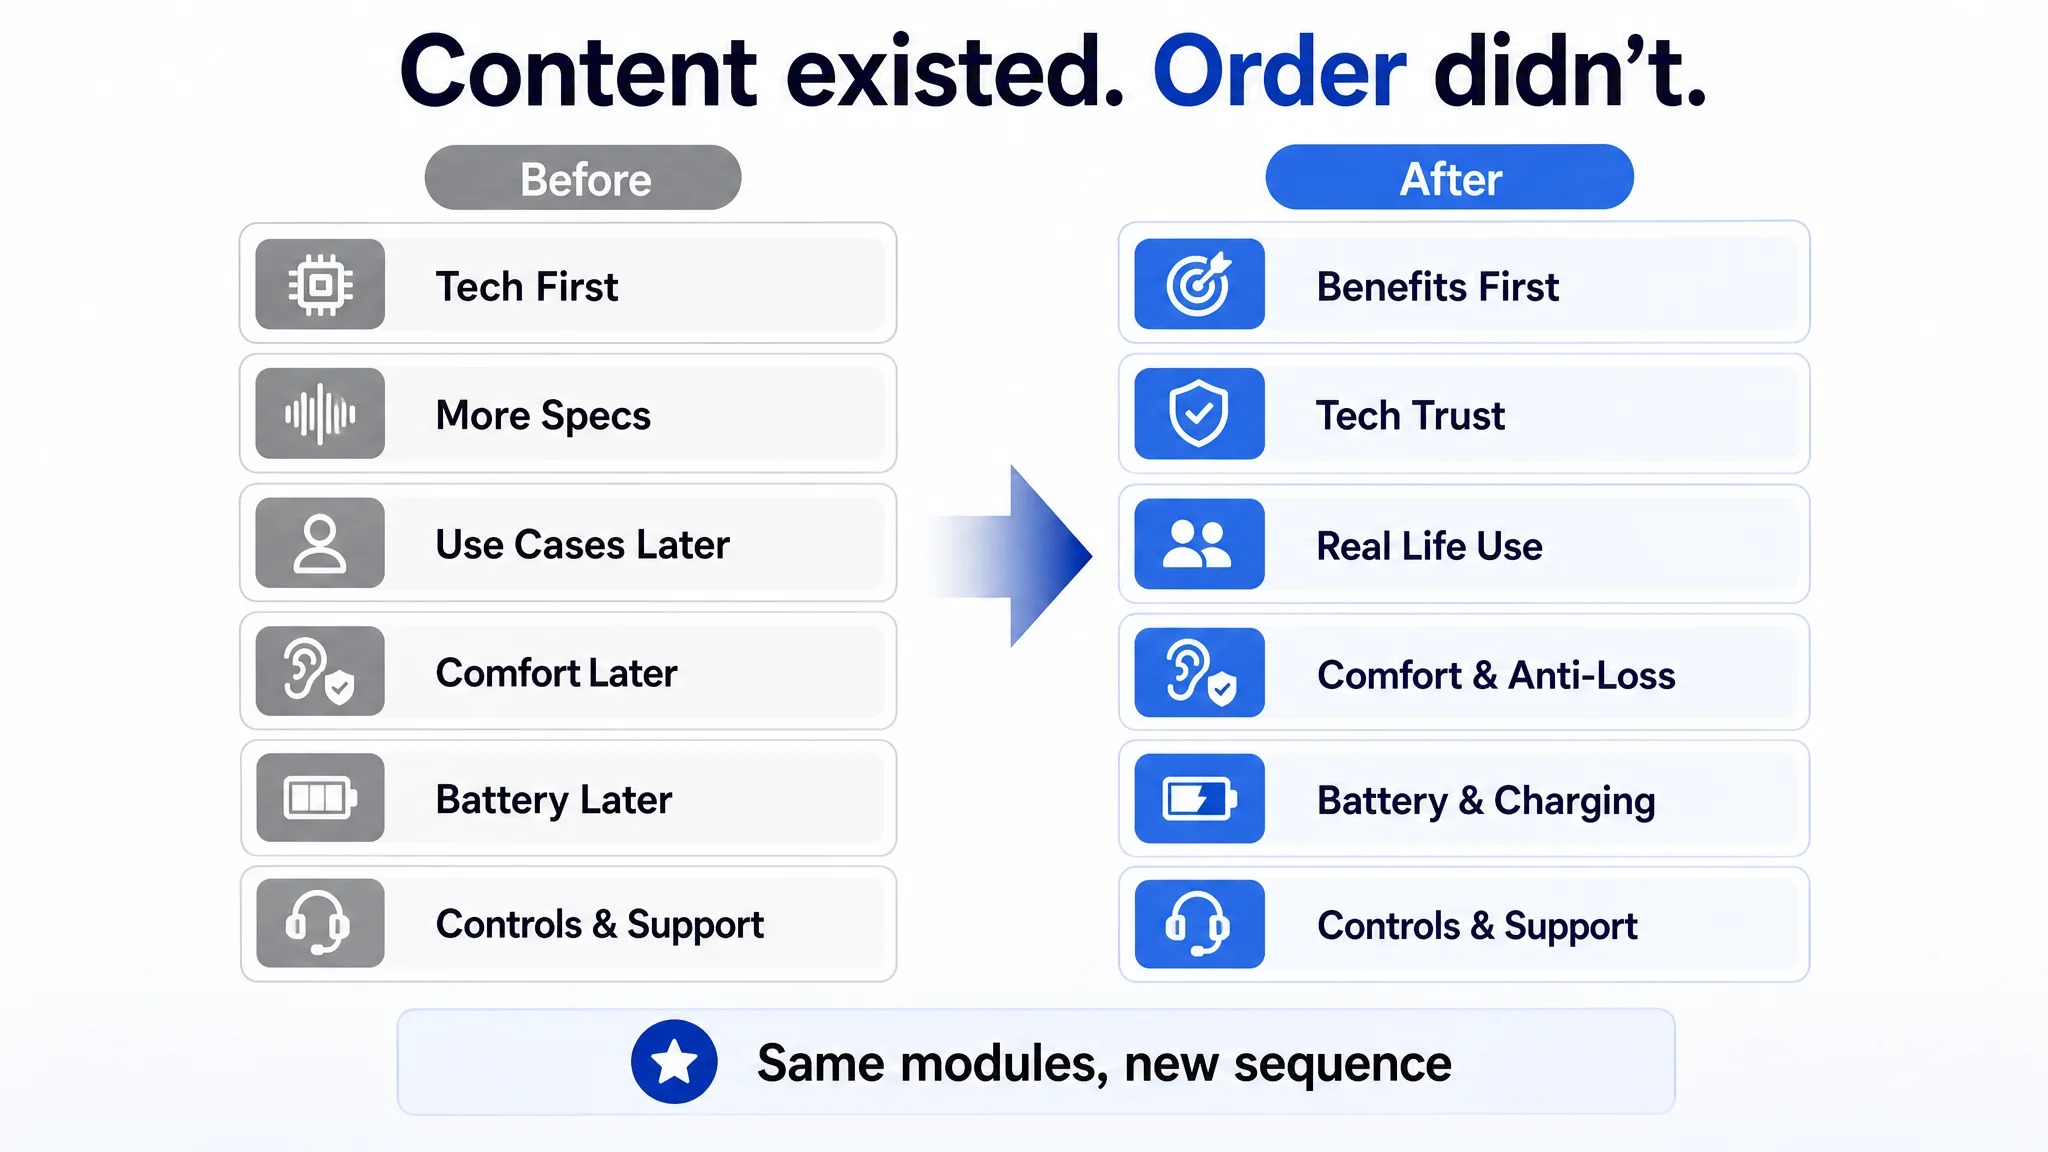
In the hearing-aid account, the bullet gap was not mainly about grammar or length. The customer’s bullets opened with technical spec talk, while the competitor’s opened with pain relief: crystal clear sound, no feedback, all-day comfort, easy controls, fast charging, and everyday-use features. The customer had data; the competitor had logic. DeepBI scored customer bullets at 7/10 versus 9/10 for the competitor. The A+ page was actually more coherent than the competitor’s, with a clear problem-solution-emotional payoff storyline, a consistent model, and useful modules such as a hearing-loss level guide and model comparison table. The problem was sequencing: the most useful trust and clarity modules appeared too late in the scroll, after many risk-averse buyers had already bounced. Content existed, but priority did not match buyer psychology.
How to Diagnose the Problem: A Signal Audit for Organic Rank Decline
A rank decline is an outcome, not a cause. Diagnose it with a repeatable audit that separates observed signal from inferred cause: a reported sales drop is a hypothesis until sessions, unit session percentage, keyword-level CTR, and conversion data point in the same direction.
Pull platform-native metrics
Start in Amazon's native reports, not in assumptions. Pull sessions, unit session percentage, units ordered, and BSR over a recent comparable window, then align them with keyword-level CTR and CVR. The sequence matters. If sessions are stable but unit session percentage falls, the loss is likely conversion-side. If unit session percentage holds while sessions fall, the problem is more likely impression or traffic-side. A BSR slide without a matching sales signal may be noise; a BSR slide with falling sessions and CVR is a business loss that needs a cause.
Use DeepBI organic-traffic mapping as a second lens: compare keyword-level CTR and CVR with natural-order-share trends. The purpose is not to prove an algorithm change. It is to see whether the decline is concentrated in specific search terms, spread across the listing, or visible in natural-order share before and after the drop. Where those signals diverge, record the gap as a hypothesis and keep digging. Do not blame Amazon search changes alone until impression and conversion evidence supports it.
When the hearing-aid seller pulled the signals together, the benchmark score made the audit less subjective. The headline score was 75/100 versus 85/100 for the competitor. Title was down 2 points, bullets were down 2 points, the main image was slightly ahead on raw score but had structural issues, A+ was slightly ahead in logic and depth, and reviews were down 8 points. That breakdown did not prove a single cause, but it showed where the funnel was most likely breaking: not in traffic quantity, not in technical specifications, and not in A+ depth, but in early trust, social proof, and the front-line explanation of value. That is the purpose of a signal audit—to turn “rank fell” into a ranked set of hypotheses.
Check keyword-intent match and impression-to-click behavior
Reverse-extract the core search terms from the title and bullets, then compare them with the terms that are actually producing impressions and clicks. A listing can rank for a term and still lose the click because the title, main image, or opening bullet does not match the searcher's intent. High impressions with weak CTR point to an impression-to-click problem; the searcher sees the result but does not choose it. Inspect the main image's visual hook, the title's keyword layout and selling-point clarity, and whether the first bullets confirm the promise. If keyword-level CTR is weak and the listing's main-image score is also weak, the click-side diagnosis is supported. If CTR is acceptable but CVR lags, the loss is more likely after the click. DeepBI's organic-traffic lens can help compare keyword-level CTR and CVR patterns, but the interpretation should remain tied to observable listing elements.
The hearing-aid title shows the distinction well. “OTC Hearing Aids for Seniors” was correctly front-loaded for search, so the listing was not obviously matched to the wrong intent. But the remaining title copy emphasized “32-Channel Digital Sound” and “7 Volume Levels,” while the competitor led with “Superior Sound Quality,” “Smart Noise Cancelling,” and “No Feedback.” The searcher could understand the category, but the title did not quickly answer the more human question: “Will I hear clearly, without whistling and hassle?” That is an impression-to-click problem sitting on top of an otherwise relevant listing. It also explains why the team’s focus on keywords and bids was incomplete: the listing could match the query and still fail to earn the click.
Compare listing layout against benchmark competitors
Apply a competitor layout gap audit against benchmark ASINs selected by multi-dimensional semantic matching: same use scenario, same function logic, and the strongest listing within that similarity set. Filter out price outliers and low-review listings that lack market validation. Then compare five visible layers: title keyword-intent match, main image clarity, bullet hierarchy, A+ ordering, and review/rating presentation. Look for gaps that explain the funnel signal, not gaps that merely look different. A weak title-to-intent match may depress CTR; a bullet hierarchy that lists parameters without problem-solution closure may weaken CVR; an A+ sequence that ignores the decision path may leave trust unanswered. Treat every layout change as an experiment with a measured outcome. It does not guarantee ranking recovery, but it gives the next iteration a cleaner signal.
The hearing-aid benchmark made those five layers concrete. On title, the customer had strong keywords but a weaker promise; the competitor led with outcomes. On main image, the customer included packaging, parameters, and model comparison, while the competitor’s visual logic was easier to read for trust and daily use. On bullets, the customer listed technical facts; the competitor tied parameters to concrete outcomes such as no whistling, all-day comfort, and avoiding sudden power loss. On A+, the customer actually had the stronger story, but the most useful modules were buried late. On reviews, the competitor had structurally stronger social proof. The point of the comparison was not to copy the competitor. It was to identify which visible layer could explain the funnel signal—and in this account, the first screen and review presentation were stronger explanations than the ad campaign structure.
How to Fix Your Ranking: A Realistic Recovery Plan
Recovery is not a single tactic. It is a matched response to a specific cause, followed by a re-measurement step that tells you whether the response worked. If you cannot name which input moved — reviews, Buy Box, availability, or listing conversion — you are guessing. The plan below pairs each major cause with a direction and a checkpoint. None of it guarantees restored rank; it gives you a testable sequence.
Recovering from review and rating issues
Start with honest expectations. You cannot operate your way back to a previous review count, and a small number of lost reviews does not automatically move the star rating. What you can control is the flow of new negative sentiment.
The most preventable source is mismatch between what the listing shows and what the buyer receives. Visual optimization may only touch external elements — composition, lighting, background, scene, and angle. Any change to material, color, or industrial design creates a product that does not exist, and that gap is what triggers damaging negative reviews.
Recovery direction: enforce product entity consistency across main image, A+ modules, and bullet claims, and describe only specifications that are visible in the image or confirmed in the base product data. Re-measure by tracking rating movement and review sentiment alongside CVR — if trust is recovering, conversion should stop eroding before the rating visibly moves.
In the hearing-aid account, the review gap could not be fixed quickly, but the listing could stop making the existing review profile feel even riskier. The internal contradiction between 35-hour and 40-hour battery claims was a trust leak: a cautious buyer comparing visuals and text could see inconsistency before seeing proof. The recovery direction was therefore not “wait for more reviews” alone. It was to align every visual and text claim around a single battery figure, remove early reassurance gaps, and make the first screen answer the buyer’s risk questions more directly. The review score would still take time to change, but the page no longer had to add new doubt on top of an already fragile review base.
Winning back the Buy Box
A lost Buy Box is a seller-account and offer-level problem, not a content problem. Check the levers in order: seller metrics such as order defect rate, late shipment rate, and cancellation rate; fulfillment method and its delivery promise; available inventory; and price competitiveness against competing offers on the same ASIN.
Recovery direction: fix the metric that actually moved rather than discounting reflexively. If availability is the gap, price cuts will not help. Re-measure by watching featured-offer share and Buy Box win rate across a defined window after the correction, and confirm that session volume responds before you touch listing content.
Recovering from a stock-out
Prevention is the cheaper recovery: set restock triggers so replenishment lands before inventory reaches zero, not after. Once an ASIN is already out, the practical pathway is rebuilding recent sales velocity — recent conversion and sales signals carry more weight than older history, so the offer needs traffic and conversion working again quickly.
Recovery direction: restore availability, keep price stable, and concentrate ad and traffic support on the ASIN while it rebuilds. Do not assume a stock-out wipes the record clean; some history persists, some signals weaken. Re-measure through BSR, session count, and CVR after restock to see whether velocity is returning.
Improving CTR and conversion rate
Diagnose before editing. Low CTR combined with a weak main image score points to a missing visual hook. Low CVR combined with weak A+ and review dimensions points to a trust and decision gap.
DeepBI's listing diagnostic and competitor benchmark score title, main image, bullets, A+, and review structure as inputs, then cross-validate those gaps against CTR and CVR to generate an impact-ranked action list — so the first fix is the one most likely to move the metric. Suggestions are parameterized, specifying composition, camera angle, light distribution, and scene elements instead of vague direction like "improve texture."
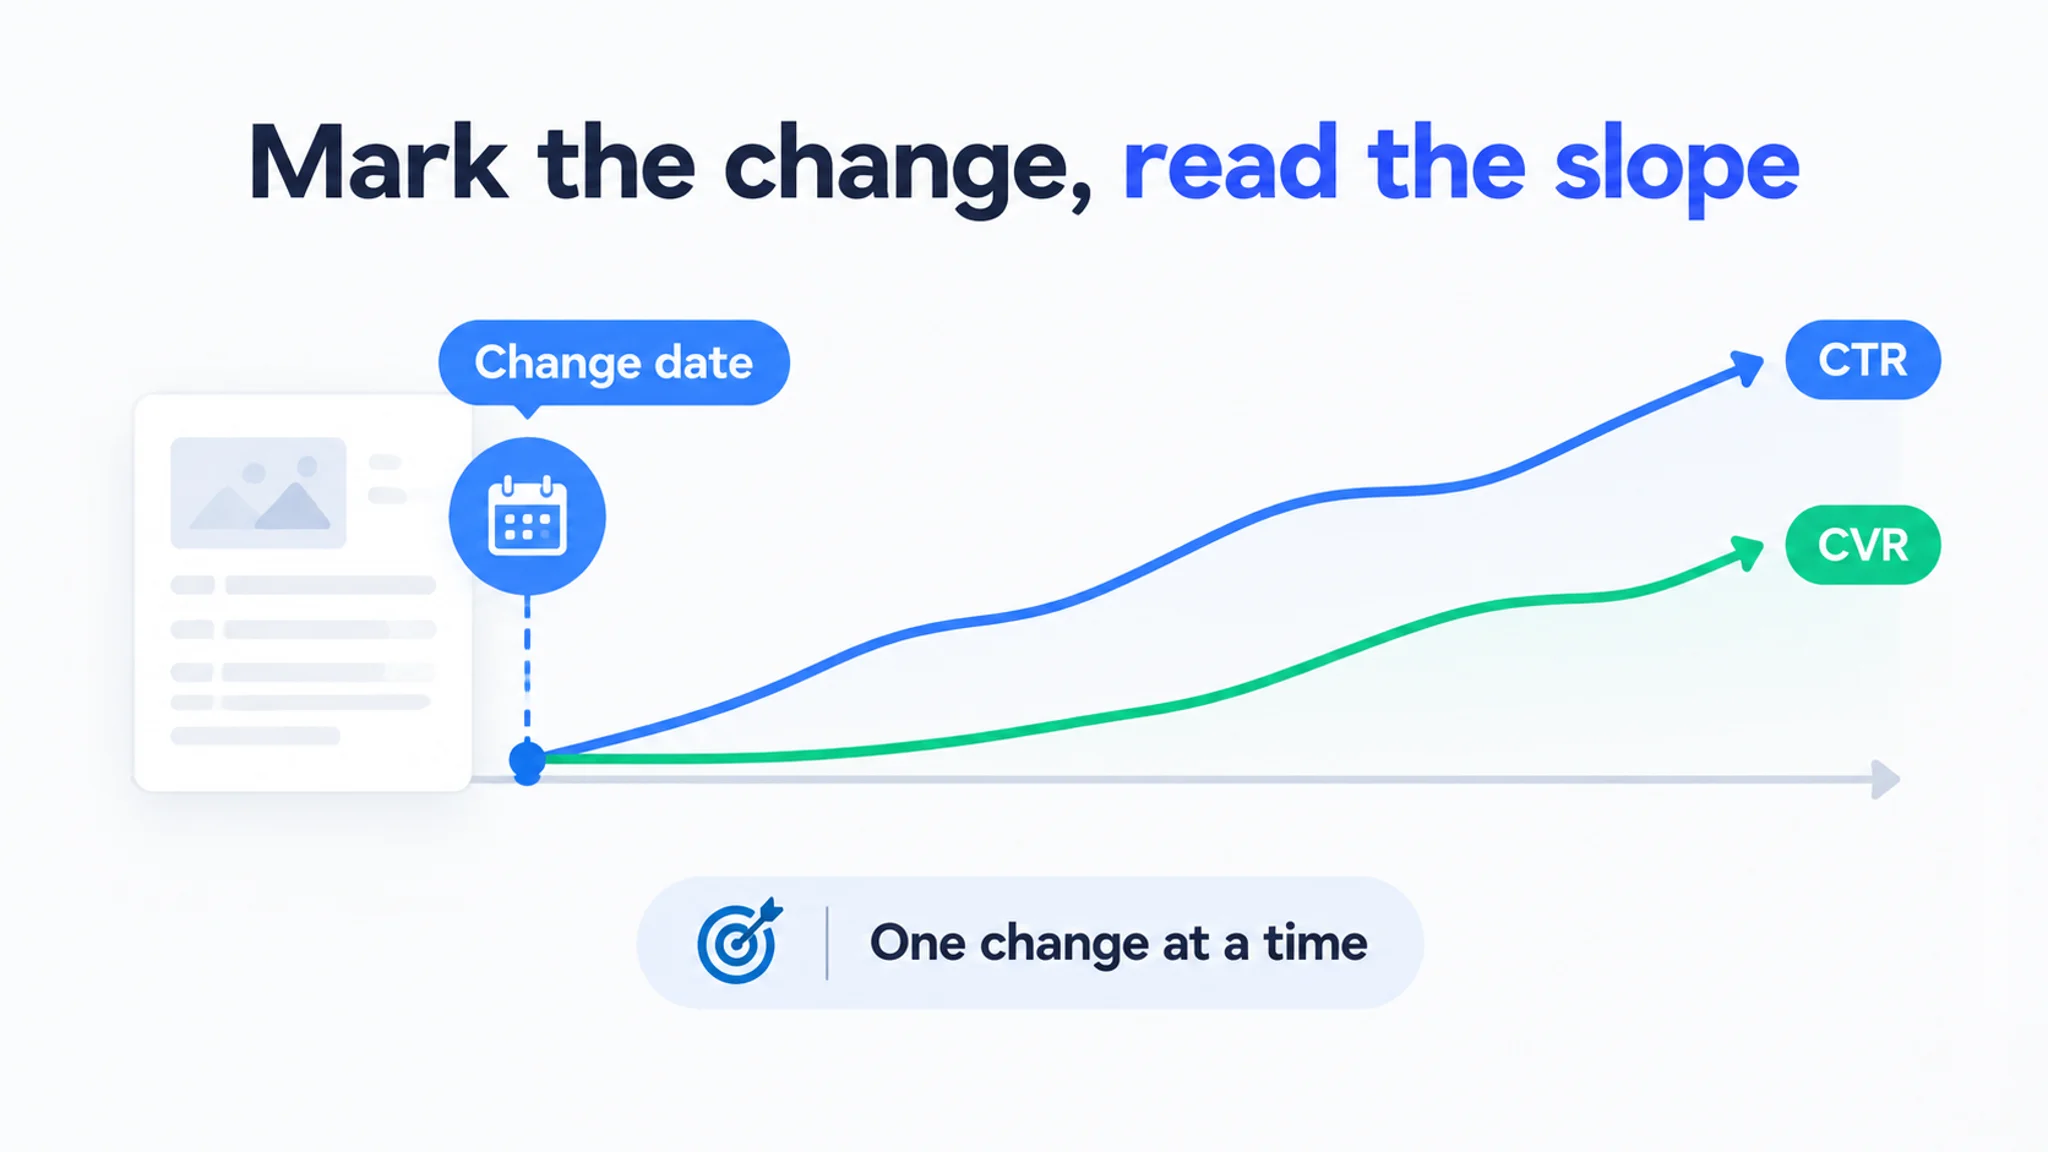
Recovery direction: rewrite titles around brand, core selling point, and product form; rebuild bullets as concern, competitor expression, then your structure; add missing high-value A+ modules such as comparison tables or authority proof. Re-measure by marking a visual iteration event point in ad reporting after publishing, then observing the CTR slope over the following window as an observation checkpoint, not a promised recovery date.
The hearing-aid recovery plan followed that same logic, but the specific changes show how diagnosis turns into execution. The title kept “OTC Hearing Aids for Seniors” at the front for search relevance, added “Adults” to broaden reach, paired the 32-channel promise with “Smart Noise Cancelling” and “Clear Sound,” and surfaced the neckband anti-loss design and 40-hour rechargeability as concrete benefits rather than hidden details. The main image set removed the box from the hero, centered the hearing aid itself, made left/right color cues easier to recognize, and gave anti-loss and comfortable wear a visible role. The team also unified the battery story around 40 hours, removed model comparison from the main image carousel, and used that slot to address power and charging anxiety with “40 hours of use” and “2-hour fast charging.”
The bullets were restructured from parameter listing to pain-point closure: lead with sound quality and feedback control, turn comfort and anti-loss into a central promise, frame controls as “no learning curve,” recast battery specs as continuity of daily life, and make after-sales support feel concrete rather than vague. The A+ page did not need a total rewrite, because its content was already stronger than the competitor’s in narrative and depth. It needed reordering: bring the core-benefits block up near the hero, cluster technical credibility into one trust block, tie noise reduction to daily-life hearing rather than waveforms, move comfort and anti-loss forward, surface battery and charging earlier, simplify operation visually, and close with a risk-reduction and support module. Each change mapped to a diagnosed gap—first-screen trust, review-risk reduction, or conversion clarity—rather than to a generic instruction to “make the page better.”
Monitoring Turns Rank Recovery into a Competitive Advantage
Recovery is not finished when the fix ships; it is finished when the signals that changed have been measured again under comparable conditions. Without that second reading, a seller cannot separate a genuine recovery from a temporary lift caused by seasonality, a competitor going out of stock, or advertising spend covering a weak organic position. Monitoring is what turns a single correction into a repeatable diagnostic process — and repeatability, not luck, is what makes rank recovery defensible.
Re-measure after every fix
Treat the moment an asset goes live as the start of the test, not the end of the work. That timestamp becomes the anchor for ad data returning and for a second scoring pass, so the comparison window is defined rather than guessed.
- Anchor the change date. Publishing a new main image or rewriting a title should be logged as an event point in the ad reports, so the impact on CTR can be read as a slope over the following 7–14 days rather than as a single snapshot.
- Read keyword-level CTR and CVR together. Click-side weakness and conversion-side weakness produce the same headline rank drop but require opposite fixes. CTR below 0.35% alongside a weak main-image score points to a missing visual hook; CVR below 7% alongside weak detail-page signals points to traffic that is not being absorbed. These are diagnostic reference points, not universal thresholds.
- Confirm at the session level. Sessions and unit session percentage show whether organic traffic actually returned after the click improved, or whether impressions merely shifted.
- Watch natural-order-share, not just ad metrics. Advertising lift is short-term; natural ranking and order share are the durable outcome. Stable ad signals should be converting into stronger natural ranking and lower TACoS — if they are not, the fix has not propagated.
For the hearing-aid seller, re-measurement had to follow the same discipline. Title, main image, bullet, and A+ changes were not treated as a single “page refresh.” Each asset change needed an event point, because CTR could respond to the main image while CVR could respond later to bullets or A+ sequencing. The team also had to watch whether ads were amplifying a clearer offer rather than amplifying confusion. The operating-state change they described was not a promised rank rebound; it was that the page’s conversion capacity improved, trust gaps shrank, and ads became useful again because clicks had a better chance of turning into orders. That is the kind of change monitoring can verify—or falsify.
Keep a signal dashboard
A recovery process decays into guesswork when each fix is evaluated from memory. Keep one running view per ASIN and keyword: the change made, the date it went live, CTR, CVR, sessions, unit session percentage, natural-order-share trend, and the report identifier for that scoring pass. A unique report ID per task preserves an audit trail, so a later regression can be traced back to the specific change that preceded it.
DeepBI supports this re-measurement through its dual-growth view: advertising-driven short-term lift read alongside natural rank and order-share tracking, with ad-report feedback closing the loop after each listing asset is published. Monitoring does not guarantee an advantage on its own — but it consistently separates sellers who can explain a recovery from sellers who can only hope it holds.
The hearing-aid account is a reminder of why the dashboard matters. A 35-hour versus 40-hour battery inconsistency, a buried A+ trust module, or a main image dominated by packaging can each look like a small creative detail in isolation. In a running ASIN, those details sit inside the same funnel as CTR, CVR, sessions, and review sentiment. Without a change log and a second reading, the team cannot tell which fix moved the signal and which one merely coincided with a seasonal shift.
Contact us to review your organic rank recovery process
Final Thoughts: Diagnose First, Then Recover
An organic rank decline is a lagging indicator. By the time BSR or search position visibly moves, the shift in relevance and performance signals behind it has usually been running for some time. That is why sequence matters more than speed: diagnose which signal moved, isolate the cause, then act. Fixes applied before diagnosis tend to be cosmetic changes that make core metrics worse rather than better.
The OTC hearing-aid account is the concrete version of that principle. High ACOS and weak CVR looked like an ad problem, and the team’s first instinct was to adjust bids, split keywords, or wait for more reviews. The benchmark diagnosis pointed instead to first-screen trust, review structure, and A+ priority. The recovery sequence was listing first, ads second—because ads amplify whatever the page already is.
- Check the signals first. Read sessions, unit session percentage, CTR, CVR, availability, price competitiveness, and rating movement as one funnel rather than as isolated metrics, so you can see whether the break sits at exposure, click, or conversion.
- Isolate the cause before editing anything. Low CTR with a steady conversion rate often points toward a relevance or main-image problem; a conversion slide on stable traffic often points toward price, availability, review presentation, or A+ trust signals. Treat a sales collapse or a rating drop as a hypothesis until account-level data confirms it.
- Fix the weakest link, not the whole listing. Map each confirmed gap to one specific change — main image composition, title keyword order, bullet hierarchy, A+ module order — and benchmark against competitors rather than against your own previous version. Visual changes can adjust composition, lighting, or scene, not product structure or functional claims.
- Re-measure after every change. Mark the date of each edit, then watch the CTR and CVR slope over a defined window before starting the next test. One change at a time keeps the feedback loop readable and the next diagnosis honest.
In 2026, the sellers who recover fastest are those who diagnose before they act and re-measure after every change.