

Why Job-Based Ranking Beats Tool-Hype
The adoption-versus-impact gap
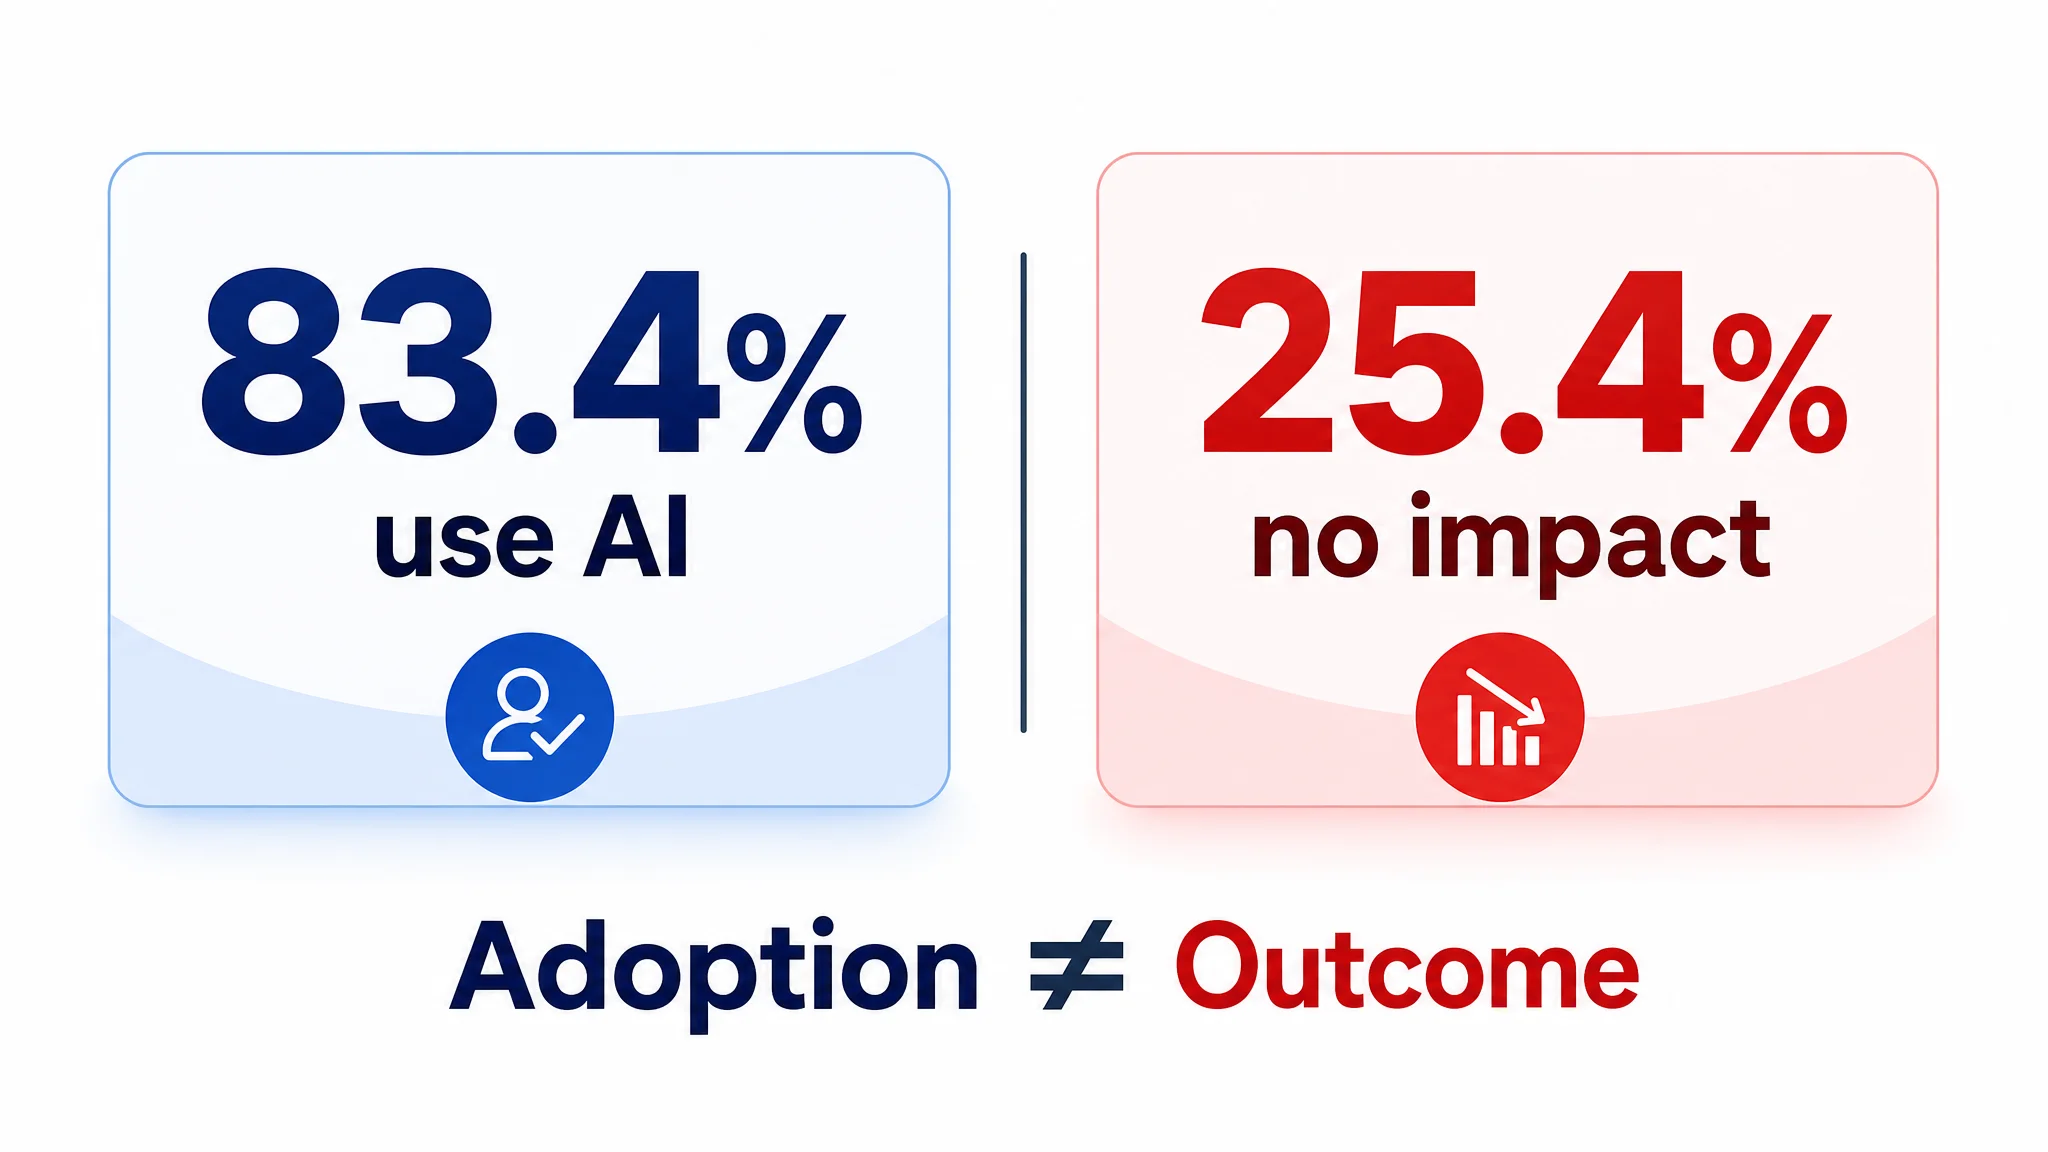
The cited 2026 seller-index figures show that 83.4% of marketplace sellers use AI somewhere, averaging 3.2 use cases, while 25.4% report no measurable impact yet. That is the central tension: adoption proves access, not outcomes. A seller can add another AI workflow and still see flat CTR, unresolved CVR drag, rising ACoS, or a listing cycle that does not shorten. Usage counts become noise when tools are judged by feature volume rather than by the business evidence they produce. The better question is not “Does this tool use AI?” but “Which Amazon job does it improve, and what evidence proves the improvement?” Ranking should start with the job a tool performs and the evidence it produces.
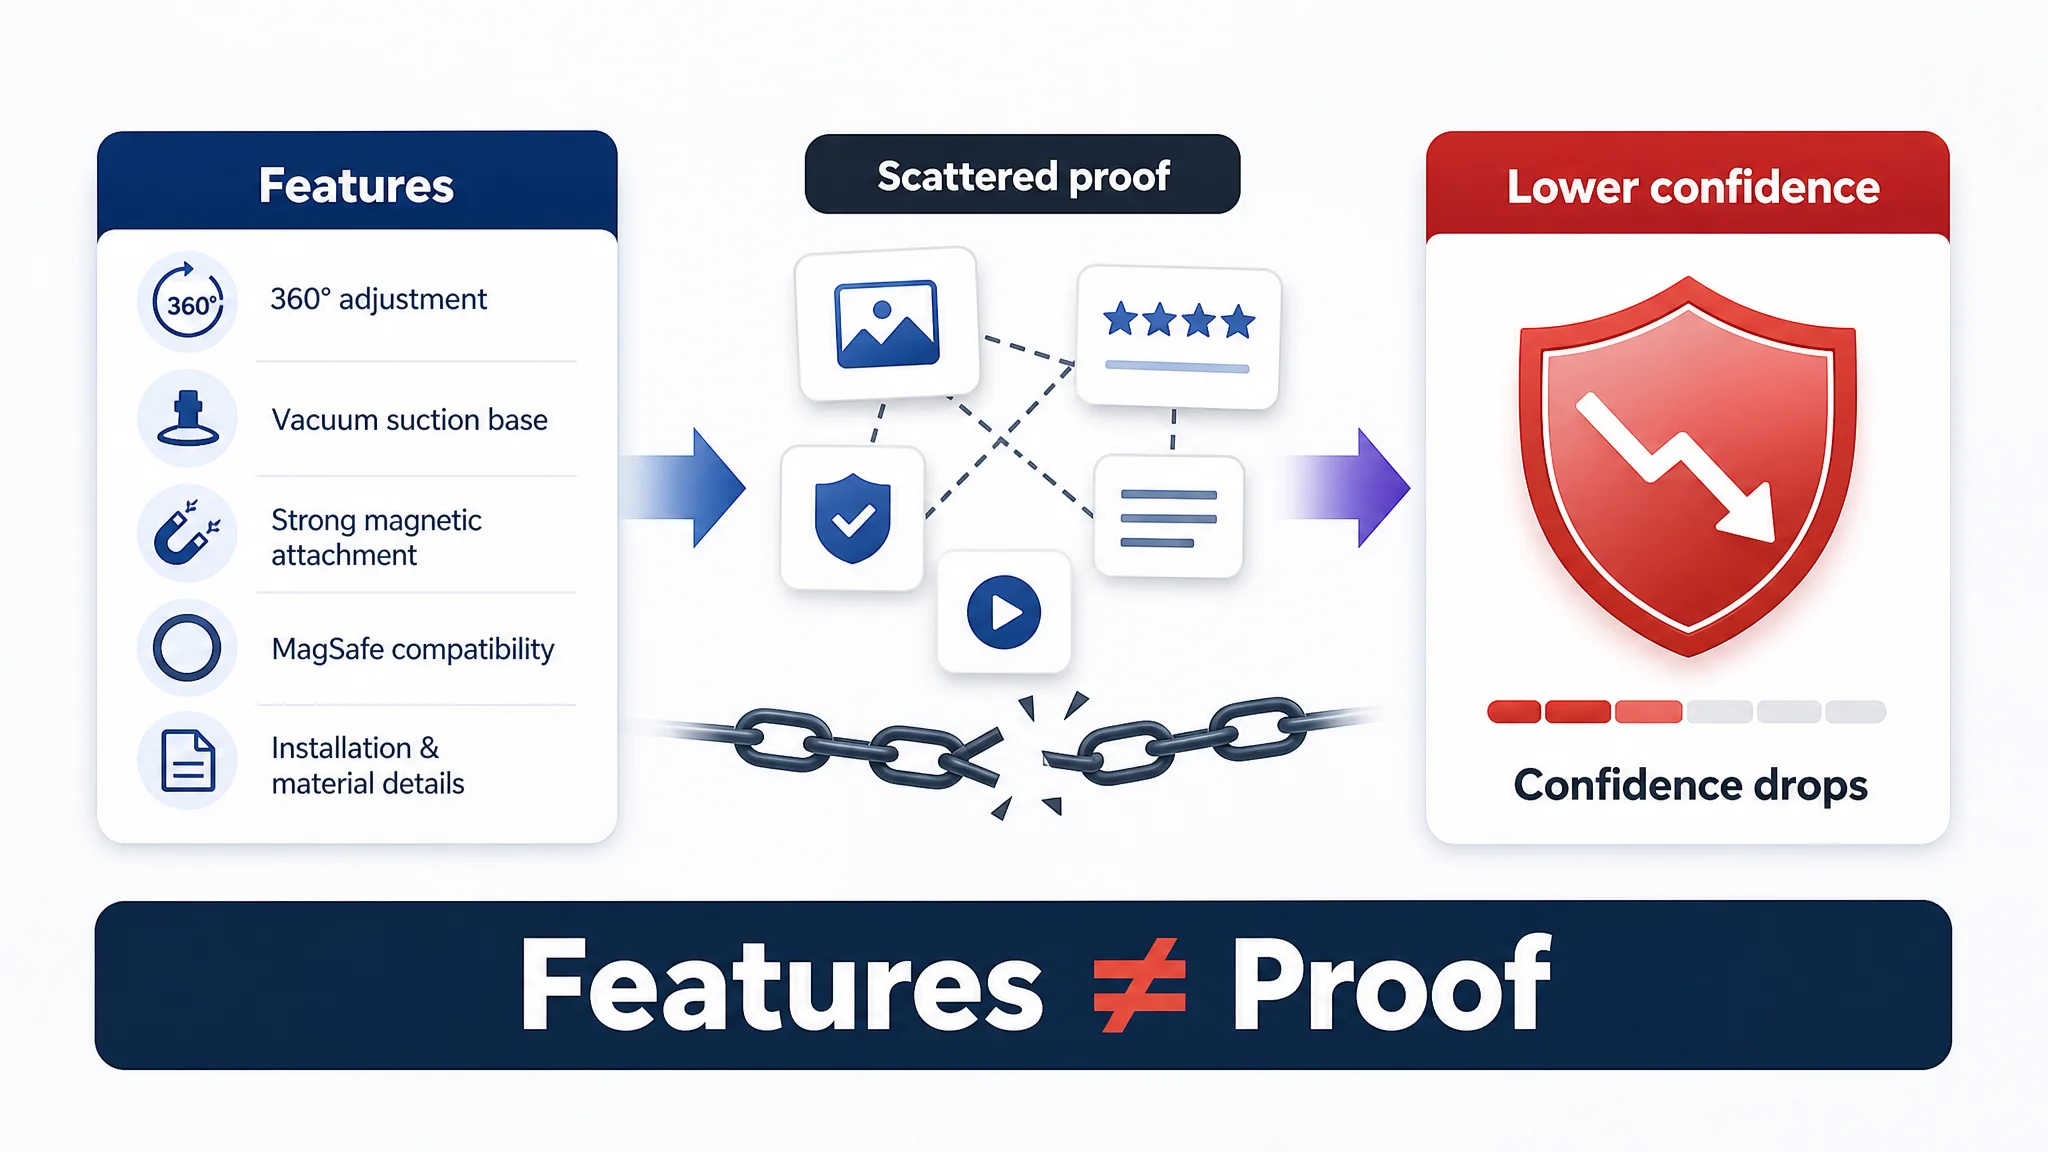
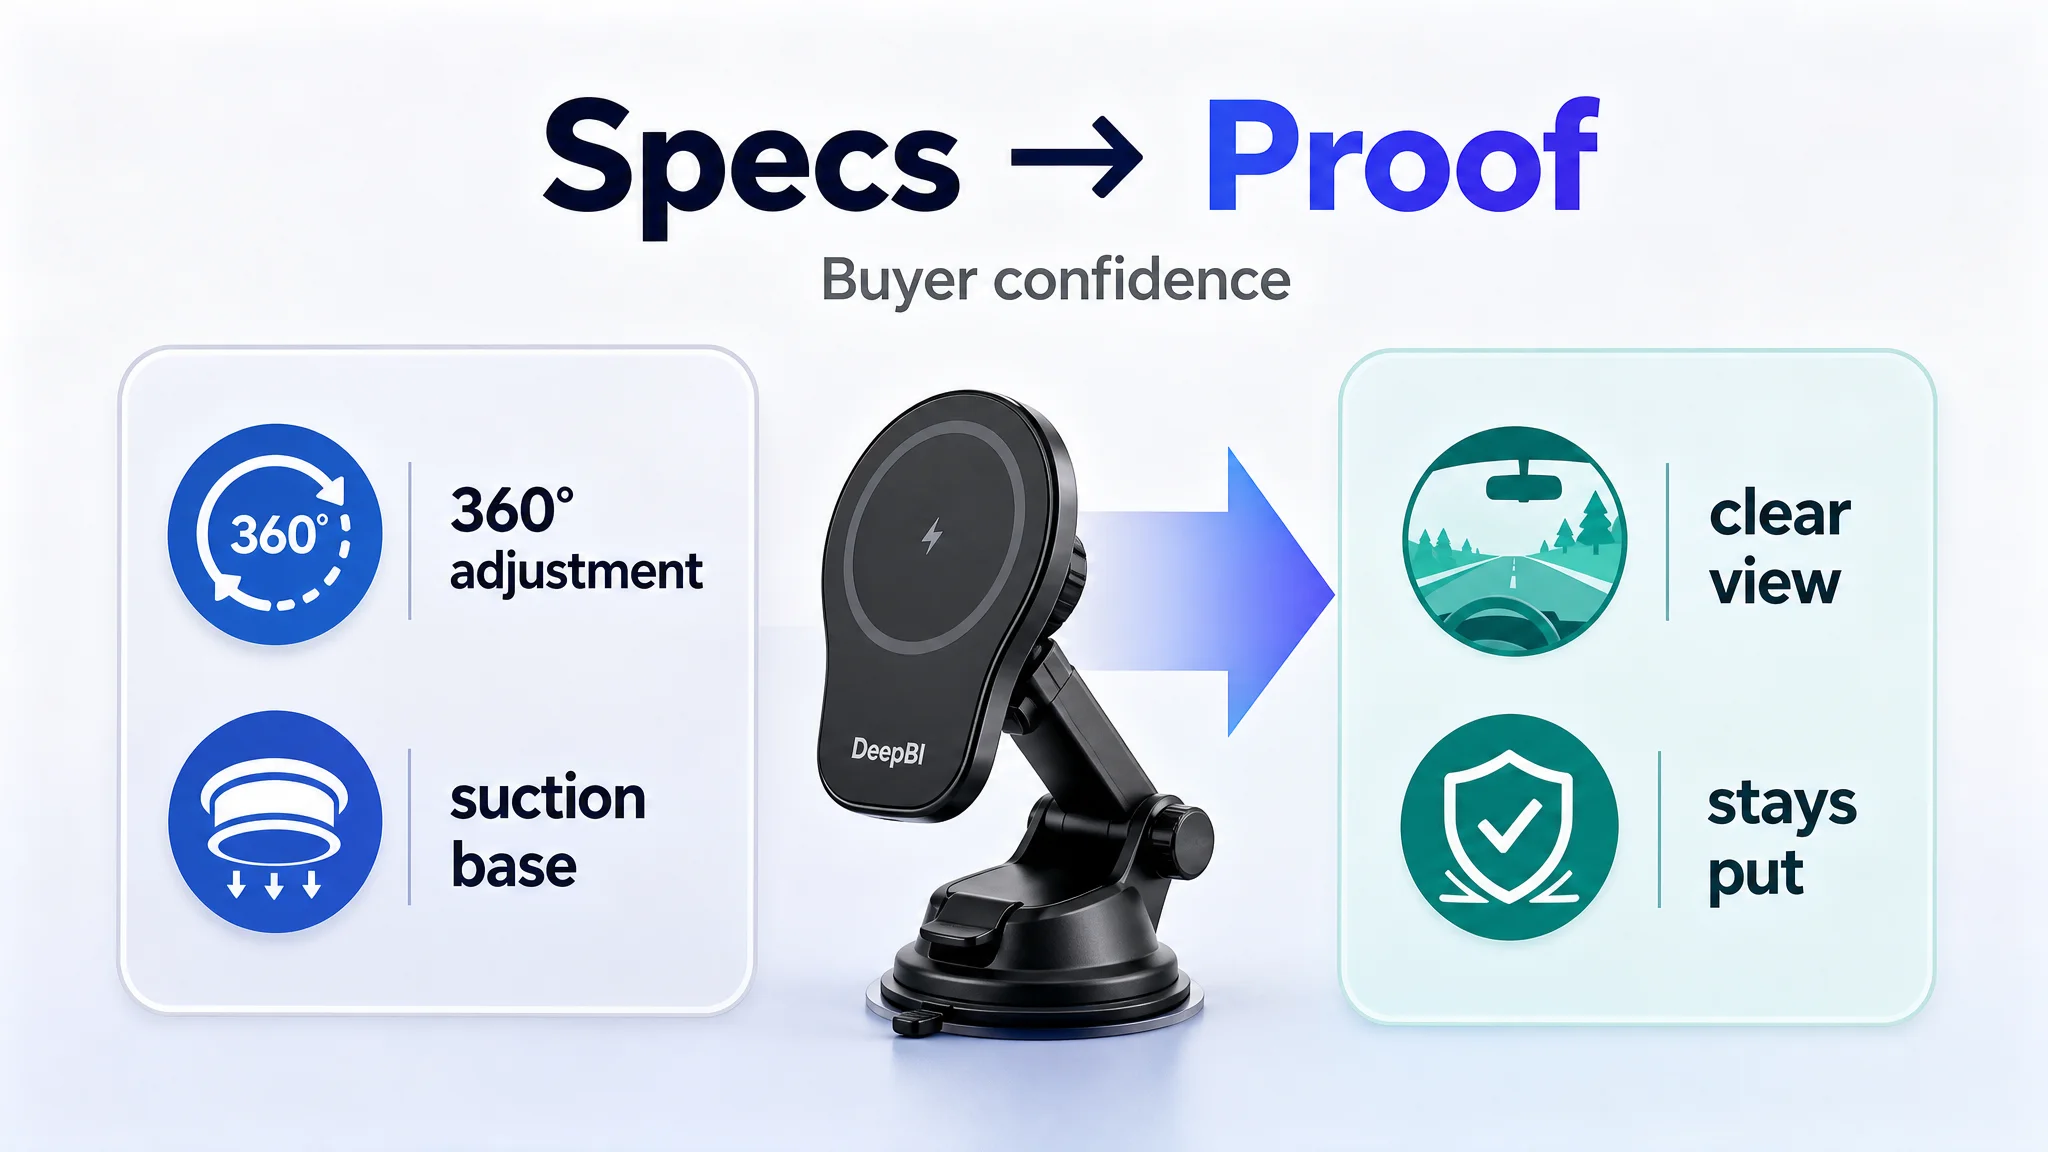
A magnetic car phone mount listing in automotive accessories already described 360-degree adjustment, a vacuum suction base, strong magnetic attachment, MagSafe compatibility, installation instructions, material details, and multi-scene images. It still scored 77 against a comparable high-performing page at 86. The initial optimization direction was to make the product more complete: refine the title, add technical language, explain the materials, and present more functions. The diagnosis pointed elsewhere. The page was not short of features; it was short of a clear buying argument. That is the adoption-versus-impact gap in miniature: content volume was visible, but conversion evidence was not.
The jobs Amazon sellers actually optimize
Amazon sellers do not buy “AI” in the abstract. They buy progress on specific jobs: product research, listing conversion, Sponsored Products efficiency, repricing and margin control, analytics, and enterprise advertising. Each job has its own inputs, KPIs, and proof standard. This guide therefore ranks tools by job fit and evidence, with a deliberate focus on Amazon-only optimization work—especially ad quantification and listing conversion. The argument moves from the adoption-impact gap to the job map, then to evidence-first ranking, and finally to the two areas where operational proof matters most.
For the listing-conversion job, the proof standard is not “the page contains more information.” The car mount page had information. The job was to turn technical attributes into reasons to click, trust, and buy. A listing diagnosis is only useful if it shows which module is losing the score and what executable change closes the gap.
Best AI Tools for Amazon Sellers in 2026: 13 Tools Ranked by Job
The 2026 landscape catalogs 13 AI tools for Amazon sellers, but the durable lesson is the ranking method, not the brand list: “best” depends on the job, the data access, and the measurable outcome.
Rank the job, not the brand
- Listing diagnosis — market data access, similarity-constrained benchmark selection, and quantified gap output.
- Listing optimization — diagnosis-to-instruction conversion and 1:1 executable output, not a feature list.
- Ad optimization — ad report integration and daily control logic; test whether bid and budget decisions are explainable.
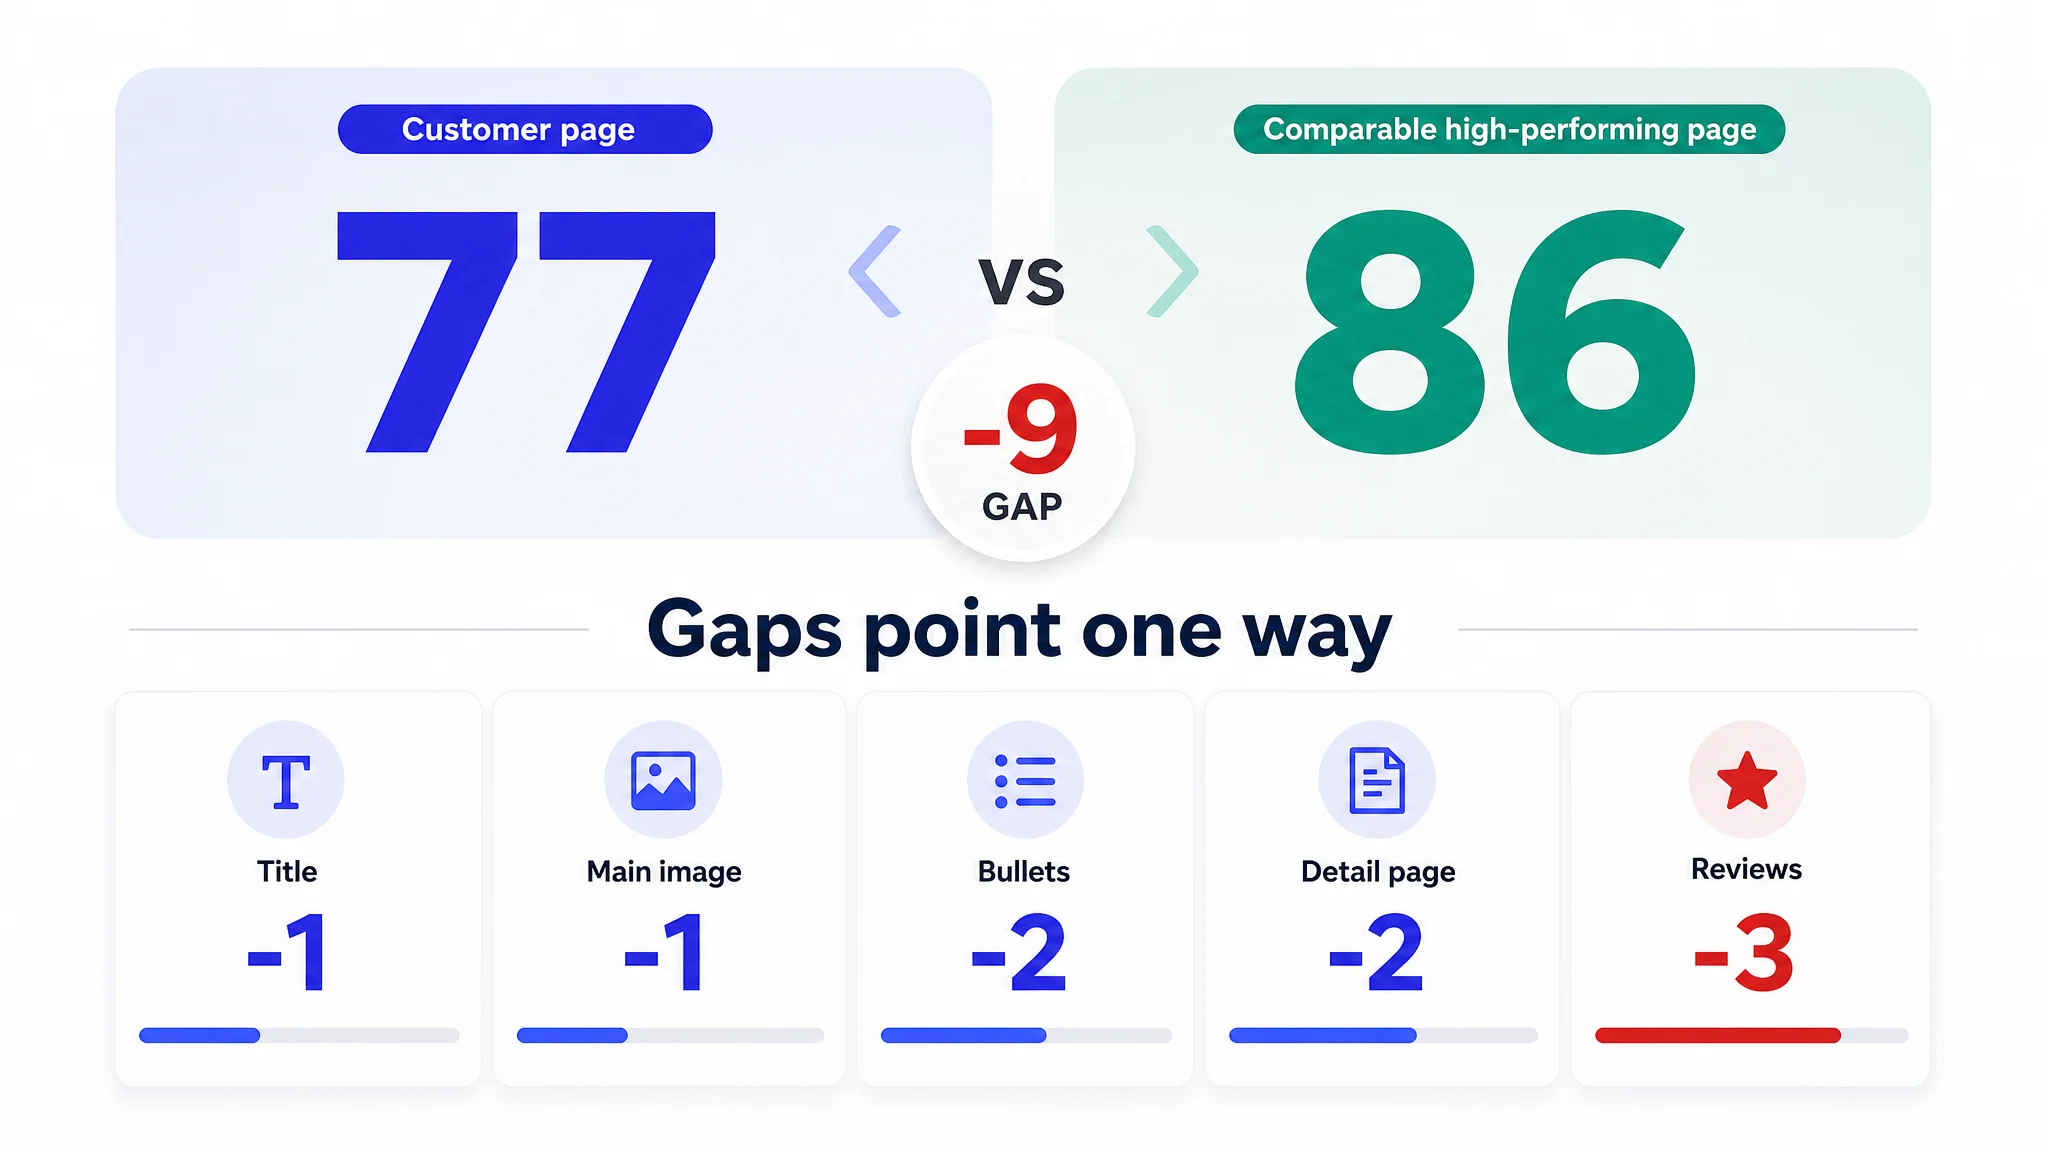
The car mount score table made the job concrete: title and main image trailed by one point each, bullet points and detail page by two, and reviews by three. No single gap explained the whole problem. The pattern did: the page described the product, while the benchmark demonstrated why the product should be trusted in real driving conditions. A tool that only returns a total score is less useful than one that shows which modules are behind and why those gaps reinforce one another.
What to verify before shortlisting
- Data access: Amazon-specific inputs for the job—ad reports, listing performance, or image asset management via SP-API.
- Evidence chain: each diagnosis maps 1:1 to an executable output with before/after comparison.
- Outcome proof: movement in CTR, CVR, ACoS, BSR, or listing cycle time; least-privilege scope, like DeepBI’s image workflow that excludes pricing, inventory, and orders.
Where DeepBI fits the ad-optimization job
- The fit is mechanism-level: a four-layer funnel—exploration, initial filtering, precision, and scaling—plus daily bid and budget adjustment based on the past seven days of clicks, conversions, spend, and ACOS.
- Strategy should be reviewable and explainable, with attributable logic rather than an opaque automation label. Ad signals can feed listing diagnosis: CTR below 0.35% points to main-image weakness; CVR below 7% points to A+ detail or information-density weakness.
- High-value ad keywords can inform a fifth-layer natural-rank push, but that is a bridge from ad evidence, not a separate organic workflow.
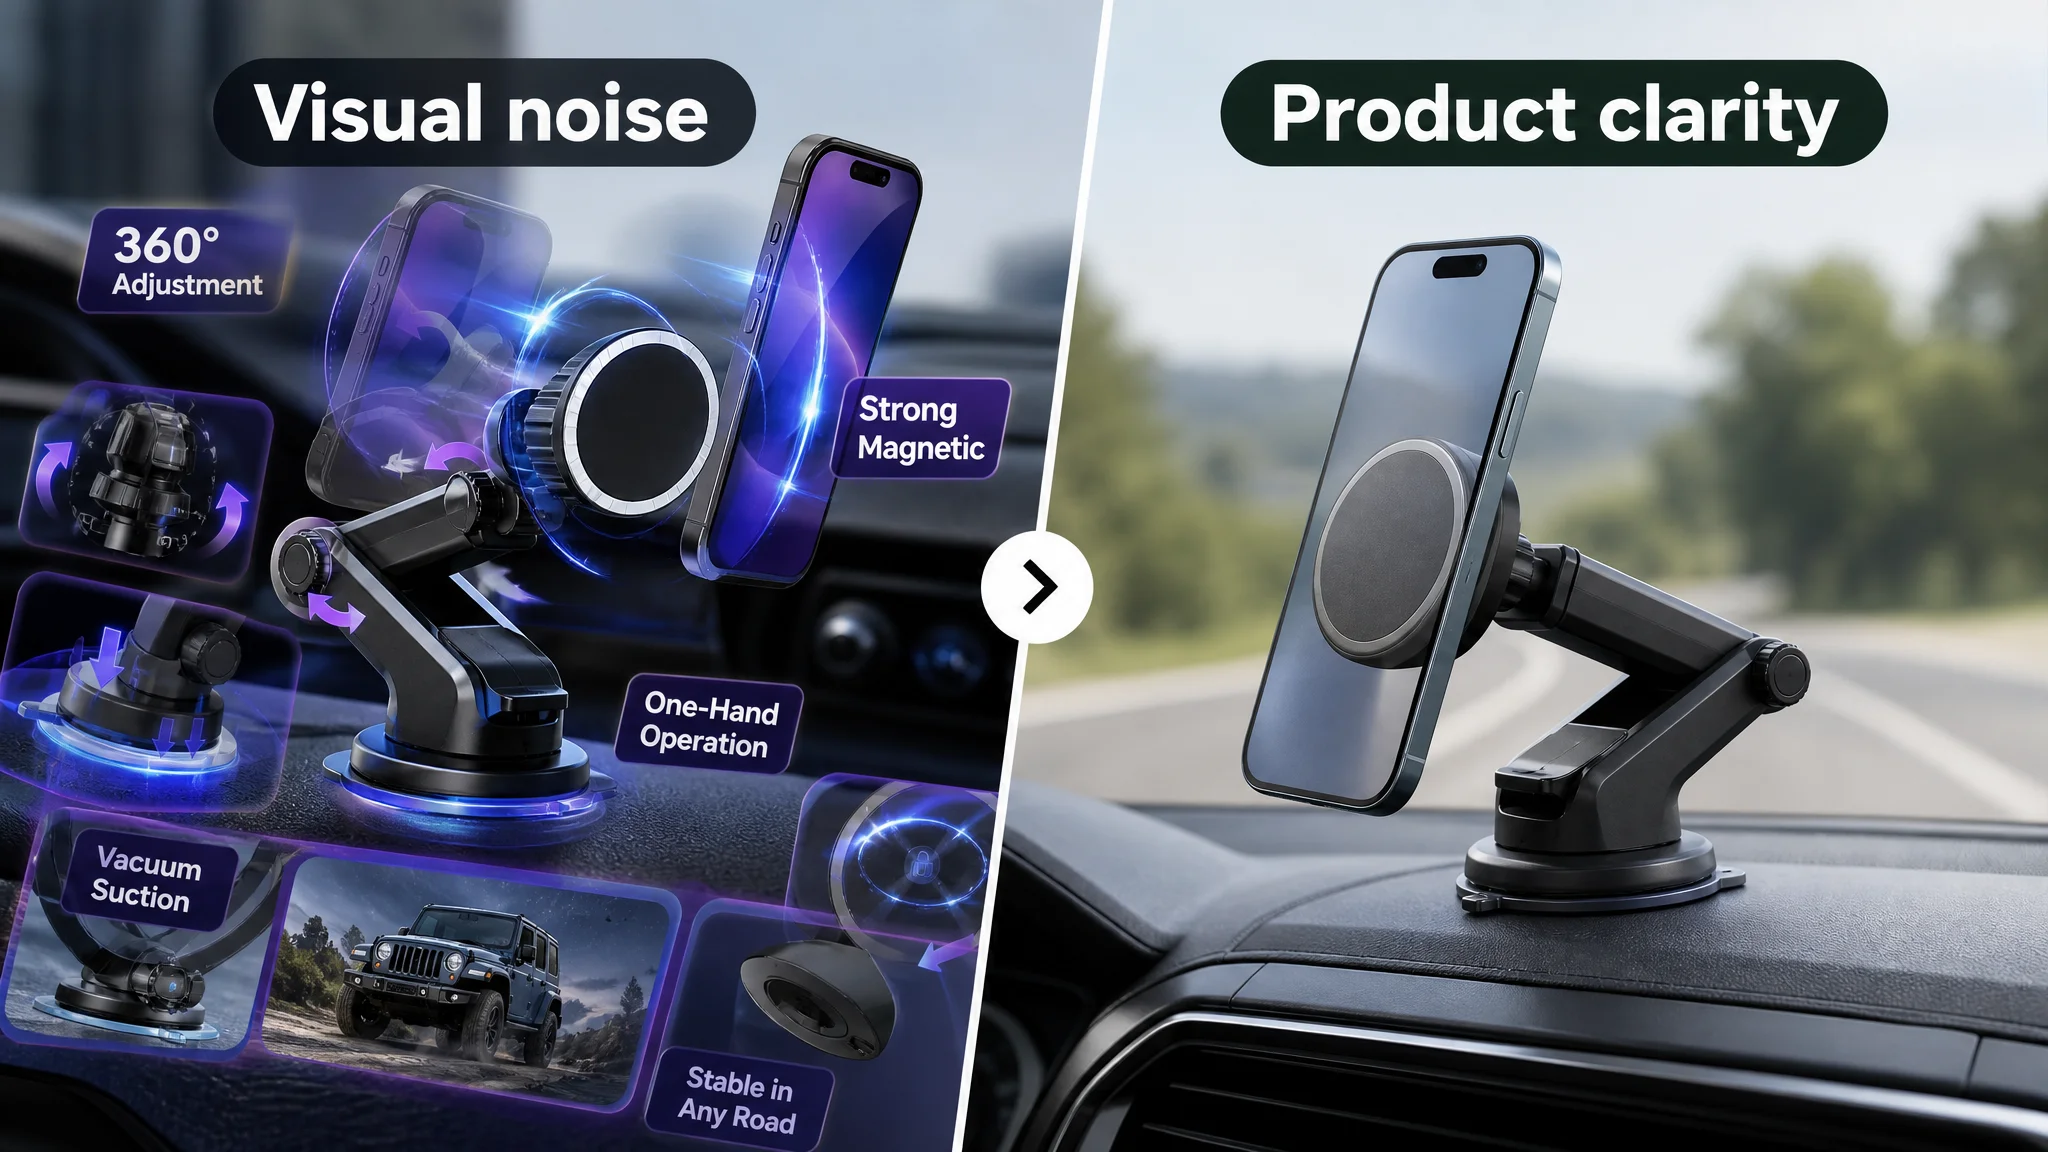
In the car mount example, the main image was visually overloaded: floating product-and-phone compositions, strong purple or blue effects, multiple scene panels, rotation, load testing, and magnetic performance shown together, dense labels, decorative light effects, and small functional details compressed into four-panel layouts. The A+ content had modules, but it relied on text and static structure. The ad and listing evidence therefore asked for the same repair: improve first-glance recognition and make stability, adjustment, and one-handed use visible before buying more traffic.
Updated July 2026: What Changed
AI shopping assistant versus matching layer
The consumer-facing AI shopping assistant—formerly Rufus and now folded into Alexa for Shopping—is distinct from the COSMO matching layer. The assistant handles conversational shopping: interpreting shopper questions, comparing options, and guiding discovery in dialogue. COSMO influences how listings are matched and surfaced. Keeping these roles separate matters because vendor messaging often blurs them, implying that an assistant-facing feature changes ranking logic. It does not determine matching. A seller tool should be evaluated by how it affects listing signals and execution, not by proximity to the consumer assistant.
Pricing restructures and tool consolidation
The 2026 pattern is consolidation: suite pricing restructures, entry-tier changes, vendor consolidation, and listing-optimizer updates. The practical effect is fewer like-for-like comparisons. Bundled plans can hide which task a tool actually improves, while tier changes can move useful functions behind higher commitments. Without naming brands or quoting prices, the selection lesson is to map each package to a concrete workflow step—diagnosis, recommendation, asset generation, or deployment—and verify what remains usable at the entry tier.
The car mount example shows why package mapping matters. The page already had broad content coverage—feature claims, compatibility, installation, material details, and multi-scene images—but it still trailed a benchmark page by nine points. More surfaces did not equal more persuasion. A suite can create the same illusion if it adds modules without assigning each one to a decision job.
What the changes mean for tool selection
Tool selection should focus on whether the tool improves execution under AI-mediated search, not whether it carries AI branding. Ask whether it can turn a listing diagnosis into specific changes, generate assets within defined product constraints, and deploy approved updates through the official SP-API. Then connect that execution to CTR, CVR, ACoS, BSR, and listing cycle time. A tool that shortens the path from diagnosis to compliant publishing is more valuable than one that merely claims AI capability.
The car mount example shows the difference between naming a gap and turning it into execution: move the core category phrase forward in the title, assign each image a clear job, convert “360-degree adjustment” into a visibility benefit, and use A+ content to demonstrate the twist-lock base and suction contact. That is the execution test, not an AI branding test.
Quick Comparison Table: Match the Job Before the Tool
This is a shortlisting aid, not a final purchase decision. Read each row as a job to staff, then verify the mechanism, then compare cost.
- Listing conversion: What to verify: Check CTR/CVR diagnosis and competitor benchmark before listing changes, Fit signal: Low CTR is tied to main-image weakness; low CVR to detail/A+ trust gaps; recommendations respect product entity, Risk to avoid: Changing material, color, structure, or aspect ratio; generic visual advice without benchmark
- Sponsored Products efficiency: What to verify: Check daily bid/budget logic and seven-day signal window, Fit signal: Exposure, clicks, conversions, ACoS, CTR/CVR feed measurable actions, Risk to avoid: Treating a 7–14 day visual-iteration observation as a seven-day Sponsored Products signal
- Natural rank and TACOS: What to verify: Check keyword handoff from ads to natural-rank strategy, Fit signal: Stable ad signals inform natural-rank actions; TACOS tracked beside ACoS, Risk to avoid: Rank guarantees or ad-only work without natural-rank handoff
- Product research: What to verify: Evaluate separately, Fit signal: Dedicated research database and validation criteria, Risk to avoid: Assuming a listing/ad tool covers research databases
- Repricing and margin: What to verify: Evaluate separately, Fit signal: Dedicated repricing rules and margin monitoring, Risk to avoid: Assuming listing/ad work controls price or margin
- Enterprise reporting: What to verify: Evaluate separately, Fit signal: Reporting matched to roles, access, and governance, Risk to avoid: Treating listing dashboards as enterprise reporting
How to read the table
Job first, mechanism second, cost third. For listing conversion, verify CTR/CVR diagnosis and a similar-competitor benchmark before changes; DeepBI’s listing scoring fits this check when it returns a quantified benchmark across images, title, bullets, A+ fullness, and voice-of-customer. The car mount example shows why dimension-level scoring matters: a 77-to-86 gap was not uniform, and the larger deficits in bullets, detail page, and reviews changed the priority order. For Sponsored Products, confirm bid/budget logic and the seven-day window. For research, repricing, and enterprise reporting, evaluate separately.
Red flags in each row
Listing: recommendations that alter product attributes. The car mount example is a useful boundary: the correction was not to change the product’s material, color, structure, or aspect ratio; it was to give each visual and bullet a decision job. Sponsored Products: visual-claim evidence confused with ad-signal evidence. Natural rank: guaranteed rank or no keyword handoff. Research, repricing, enterprise: any coverage claim without a separate workflow; keep those as separate buying decisions.
1. Amazon Native AI Tools: The Free Baseline Every Seller Already Has
Amazon’s native AI layer is a conditional baseline, not a universal answer. For a small, straightforward catalog, it can support core listing work, opportunity research, and ad-creative tasks without adding another software line item. For a complex or multi-marketplace catalog, it is a starting point; those sellers still need dedicated software for repeatable execution across markets and SKU sets.
What the native layer covers
Native tools help sellers draft and refine core listing content, surface product opportunities, and produce ad creative for routine campaigns. They also enforce platform requirements: content that misses mandatory standards, such as main-image background rules, pixel dimensions, or title character limits, is blocked before publication. That guardrail reduces avoidable listing errors, but it does not by itself lift CTR or CVR. Source-cited Amazon data reports a 90% content-acceptance rate across more than 900,000 sellers. Acceptance means the content passed review; it does not prove conversion, ranking, or BSR improvement.
Where the native layer stops
The gap appears when catalog complexity rises. Multi-ASIN operations need consistent listing QA at scale, competitor listing benchmarks to judge message and visual parity, and daily bid and budget adjustment to protect ACoS as campaign volume grows. Multi-marketplace sellers also face localization and policy variation that a single native workflow does not resolve. Graduation to a paid layer is justified when those needs become recurring operating work, not when a seller simply wants more AI features. The test is measurable: shorter listing cycle time, stronger CTR and CVR, and controlled ACoS under daily management.
Even a single listing can show the limit. The car mount page passed the basic test of being informative—it had feature, compatibility, installation, and material content—but it still trailed a benchmark page. The gap was not platform acceptance; it was whether the title, main image, bullets, and A+ content organized the facts around buyer decisions. That is the point at which a specialist layer becomes justified by a measurable job, not by a desire for more AI features.
2. All-in-One Research Plus AI PPC Automation: What the Archetype Gets Right
The appeal of one workflow
The archetype is compelling because it promises one operating surface: research finds demand, listing work turns that demand into relevant creative and copy, and PPC automation adjusts traffic against the same signals. For sellers managing listing cycle time, CTR, CVR, and ACoS across a catalog, that continuity removes handoffs and reduces the risk that ad data and listing decisions drift apart.
The depth and cost tradeoff
Breadth has a price. Modules inside an all-in-one suite can be shallower than specialist tools, and the subscription can rise with the number of products, users, or automation layers. Cost discipline matters here: verify what the entry tier actually includes before assuming full ad automation is part of it. A plan that covers research or listing support may not cover daily bid and budget management, so sellers should map tier inclusions to the KPI they need to move before treating a suite as an ads operating system.
The car mount page already had broad content coverage: 360-degree adjustment, vacuum suction mounting, magnetic attachment, compatibility, installation instructions, material and structural details, multi-scene images, and accessory images. The benchmark still showed a nine-point gap. The issue was not module count; it was that the page explained mechanisms rather than reducing purchase risk. A suite can create the same illusion if it adds surfaces without assigning each one to a decision job.
DeepBI's ad-automation half
DeepBI is not a product-research database; it focuses on the advertising and listing-execution half. Its four-layer funnel moves from broad traffic capture to precision filtering, with daily bid and budget adjustments evaluated on seven-day metrics. In the scaling layer, a minority of validated traffic receives more budget and higher bids so spend concentrates where CTR, CVR, and order value support it. DeepBI knows the catalog only after Amazon SP-API authorization and data synchronization, not out of the box. Keywords that survive the precision layer can feed a fifth-layer natural-rank strategy focused on high-CTR, high-CVR, high-order-value terms and Top of Search reinforcement.
3. Where Competitor Layout Gaps Become Ad Profit Leaks
Diagnose the competitorlayoutgap
The competitor_layout_gap is the measurable distance between your listing and high-competitiveness benchmark ASINs across main image, title, bullets, A+ content, information hierarchy, and review structure. It is a scoring input only — not a verdict on product quality.
The automotive accessories example makes the gap concrete. A magnetic car phone mount page scored 77 against a comparable high-performing page at 86. The title and main image were behind by one point each, bullet points and detail page by two, and reviews by three. The important signal was not that every element was weak. It was that the gaps pointed in one direction: the page described the product, while the stronger page demonstrated why the product should be trusted in real driving conditions.
Benchmark selection is ASIN-data driven: the system reverse-extracts search terms from title and bullets, simulates buyer searches, pulls top products from the leaf category, then filters by visual layout and semantic-function similarity to lock one comparable benchmark. Scoring audits five dimensions — main image visual, title weight, bullet-description logic, A+ richness, and user feedback — and returns a competitiveness radar that locates the core conversion constraint.
In the car mount case, the diagnosis did not stop at “improve the listing.” It identified visual noise in the main image, bullet points that explained construction rather than reducing purchase risk, and A+ content that did not make stability, one-handed use, or locking performance tangible. That is the difference between a score and an executable diagnosis.
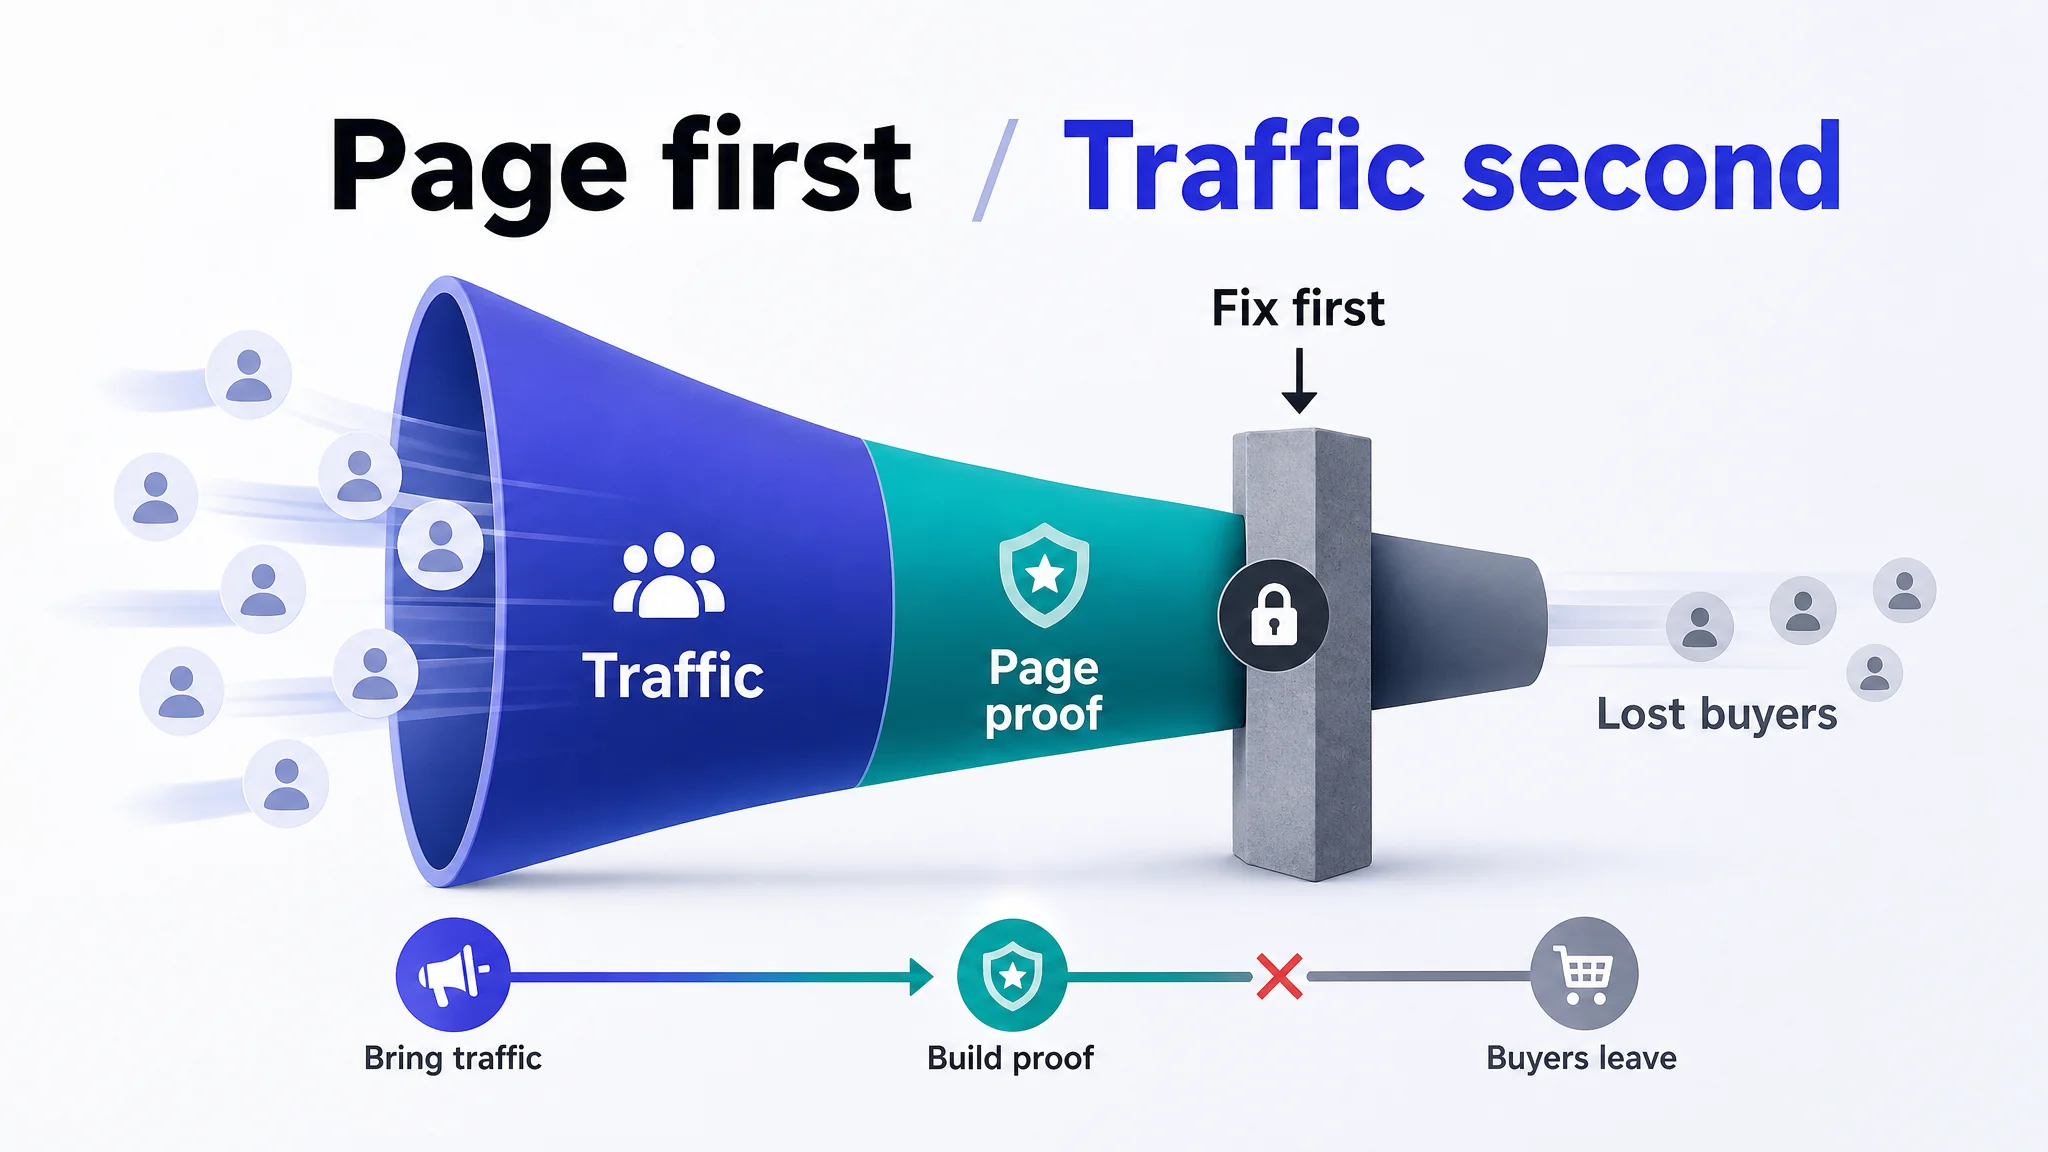
Fix the conversion leak before scaling ads
Weak CTR or CVR makes every ad click less productive. When CTR is low and the main-image score is weak, the listing is diagnosed as missing a visual hook. When CVR is low and A+/reputation scores trail the benchmark, traffic is arriving but not converting.
The car mount page fit the second pattern more than the first: its product foundation was credible, but the page did not convert that foundation into confidence. The main image carried too many messages at once—floating product-and-phone compositions, strong purple or blue effects, multiple scene panels, rotation, load testing, and magnetic performance shown together, dense labels, decorative light effects, and small functional details reduced by four-panel layouts. At thumbnail scale, that weakens first-glance recognition. The bullet points then explained adjustability, suction mounting, magnetic attachment, compatibility, and installation as separate technical modules, while the stronger page translated them into bumps, stops, turns, rough roads, portrait-to-landscape adjustment, durability, and multi-surface use. The A+ content had modules for advantages, comparisons, usage scenes, compatibility, installation, structural details, and accessories, but it relied on text and static structure. It did not make the hardest claims tangible: that the mount stays upright, that the viewing angle adjusts freely, that the phone can be attached or removed with one hand, and that the twist-lock base holds on a textured dashboard.
Each diagnosed gap becomes a 1:1 executable instruction: Score_Report plus Product_DNA produces an Optimization_Plan specifying composition, camera angle, lighting, scene elements, and color tone instead of vague advice. This is the bridge to: closing the conversion gap can improve return on ad spend and helps reduce wasted clicks, rather than buying more traffic for a listing that cannot convert it.
So the conversion leak was not a missing feature list. It was a missing chain of proof. Buying more traffic first would have amplified the same hesitation.
Sync, compare, and verify
Delivery runs through one-click SP-API sync over Amazon's official encrypted channel, auto-matching main, PT01–PT06, and A+ slots — reducing an operation that took roughly 30 minutes to seconds and avoiding manual renaming. Before applying, the platform shows an old-versus-new visual comparison, and you can replace only selected images.
After publishing, the system marks a visual-iteration event point in the ad report, so you can observe how CTR moves over the following 7–14 days. Catalog context begins only after Amazon SP-API authorization and data sync.
How to Choose AI Amazon Optimization Tools: A Decision Framework
Selection should follow jobs, not feature counts. The sequence is consistent: exhaust the native baseline, commit to one measurable job, verify data access and write-back, then add adjacent modules only where the causal bridge to CTR, CVR, or ACoS is clear.
By revenue and ad spend
- Small catalog, low spend. Native reports come first. Pick one job — often a CTR gap traced to a weak main image — and demand a diagnosis that names the specific module losing the score.
- Growing catalog with meaningful ad spend. Choose one ad-led job: profit or growth, ACoS control or scaling. Confirm ad-signal reads and a defined write-back scope before granting access.
- Larger multi-ASIN operations. Add adjacent modules only when one module's output demonstrably moves CVR or ACoS. Cost discipline beats breadth.
By data access and explainability
Score candidates on six criteria: job fit, Amazon SP-API access, explainability, reviewability, cost discipline, and Amazon-only scope. Least-privilege permissions signal maturity: a listing tool that requests only image asset management access, staying out of price, inventory, and orders, is easier to trust than one demanding full account control. Explainability means a 1-to-1 mapping from diagnosed gap to proposed action, with an old-versus-new comparison shown before anything is applied.
The car mount example also shows why explainability matters. The recommendation had to explain why a 77 score trailed 86 across title, main image, bullets, detail page, and reviews, then convert each gap into a 1:1 instruction: move the core category phrase forward in the title, give the main image a stronger visual center, turn “360-degree adjustment” into a visibility benefit, and use A+ content to demonstrate the locking action and suction contact. That is reviewable execution, not a generic instruction to “improve the listing.”
For ad work, make the division of labor explicit: the seller sets the goal — profit or growth, ACoS control or scaling — and DeepBI handles data analysis, daily bid and budget adjustment, continuous optimization, and a reviewable strategy the seller can audit.
AI Tool Buying Mistakes to Avoid as an Amazon Seller
Adoption is not an outcome. A tool can be installed, connected, and visible in a dashboard while CTR, CVR, ACoS, and listing cycle time stay flat. The correction is to buy against a named operating job and require evidence after deployment.
Buying breadth before job fit
Buying a broad AI suite before defining the job creates surface area without accountability. A listing tool should start with diagnosis and benchmarking; a DeepBI mapping should target measurable jobs such as ACOS, ROI, effective ad-spend share, and scaling stability. AI branding is not evidence of mechanism.
In the automotive accessories example, the first instinct was to make the product more complete: refine the title, add technical language, explain the materials, and present more functions. The diagnosis found the opposite constraint. The listing was not short of features; it was short of a clear buying argument. The page already described 360-degree adjustment, a vacuum suction base, strong magnetic attachment, MagSafe compatibility, installation, and material structure, yet it trailed a comparable page 77 to 86. The correction was to rebuild around decision logic: make the core keyword easier to recognize, turn technical specifications into credible use-case benefits, and use secondary images and A+ content to demonstrate physical performance. That is what buying against a named job means.
Without structured inputs, constraints, and a reviewable strategy, teams get opaque automation rather than controlled execution. AI also cannot repair a weak listing or a poorly structured ad account; it is bounded by product data, account structure, and feedback quality. The earlier 25.4% no-measurable-impact finding is the warning: adoption can be complete while the job remains undone.
Ignoring write-back and sync
Optimization that stops at a recommendation is an asset, not a live change. Without write-back and sync, approved work does not reach the listing or ad workflow, so teams pay for insight but still carry manual steps and delay. Require reviewable deployment: old-versus-new comparison, selective replacement, compliance checks, idempotent requests to prevent duplicate overwrites, and narrow permissions. The test begins after deployment.
The car mount example also sets an evidence boundary. It does not provide post-optimization CTR, CVR, ACoS, or organic-order data, so it should not be used to claim a performance lift. What it proves is diagnostic: the page had a proof gap, and the priority order changed from adding more claims to arranging the right proof. That distinction matters when a team is deciding whether a tool has actually closed the loop.
Overpaying for unused modules
Paying for modules with no owner, workflow, or KPI connection raises cost without improving CTR, CVR, or ACoS. Match spend to jobs actually measured and retire unused surface area.
FAQ: AI Amazon Optimization Tools and Strategy
Are free Amazon native AI tools enough?
Not automatically. They are enough only when the job is narrowly scoped to native Amazon surfaces and results are judged by CTR, CVR, and ACoS. Otherwise, treat them as a baseline. Action: define the job before adopting a tool.
How do I compare AI ad tools?
Compare by job fit, Amazon SP-API access, daily adjustment logic, seven-day signal window, explainability, and Amazon-only scope. The reason: inputs, cadence, and reporting must match your operating rhythm. Action: score each vendor against those six criteria before a demo.
What should I fix first: listing gap or ad structure?
If CTR or CVR is weak, diagnose the competitor_layout_gap before scaling ads; otherwise you may buy traffic for a listing that cannot convert. If conversion is acceptable but ad waste is high, fix the ad structure first. Action: follow the failing KPI, not the fastest launch.
The car mount listing illustrates the listing-first case: the score gap was concentrated in bullets, detail page, and reviews, while the visual proof did not make stability, adjustment, or one-handed use tangible. Scaling ads before repairing that proof would have put more shoppers into the same unresolved decision.
What to Do Next
Start by auditing the native baseline. Amazon’s built-in listing and ad tools show what your catalog can already do, where CTR or CVR stalls, and which reports are reliable before you add software. Use that audit to separate a tooling gap from an execution gap.
Then pick one measurable job. Do not buy breadth. Choose the workflow you can judge with a KPI: listing conversion, Sponsored Products efficiency, natural-rank follow-through, or margin control.
The car mount example shows why. The seller already had a credible product foundation and a long feature list; the missing work was a page structure that turned that foundation into confidence. The job was listing conversion, and the evidence was a 77-to-86 benchmark gap spread across title, main image, bullets, detail page, and reviews.
- For ad-led sellers, begin with the ad job: inspect ACoS, wasted spend, and seven-day bid and budget signals, then check whether a competitor_layout_gap in the main image, title, bullets, A+ content, or review structure is limiting conversion.
- For listing-led sellers, reverse the order: diagnose the competitor_layout_gap first, prioritize the highest-friction module, then connect the fix to ad efficiency through CTR and CVR.
Finally, verify the mechanism before buying. Ask how the tool reads your Amazon data, what it changes, whether recommendations are reviewable, and how results feed back into the next cycle. For the car mount page, that meant assigning each image a job: a stronger visual center, a believable driving scene, one readable adjustment movement, and restrained magnetic treatment. It also meant rebuilding bullets around buyer concerns rather than construction modules, and using A+ content to show stability instead of only describing it. The closing criterion is simple: AI Amazon optimization tools and strategy should be judged by job fit and measurable workflow, not by hype.