


Why Amazon Ads Reporting Breaks Down Without a Data Layer
Every Sponsored Products operation starts in the same place: the console serves as the source of truth, while a spreadsheet is where the analysis happens. That pairing works at small scale. It stops working as spend and SKU count grow—not through one dramatic outage, but through a slow accumulation of small frictions that compound quietly until reporting itself becomes the bottleneck.
Four friction points appear first.
- Manual effort. Someone exports Sponsored Products, then Sponsored Brands, then a separate currency or marketplace view, then stitches them together by hand. That reconciliation is a human performing a database join with a copy-paste tool.
- Missed pulls. The export runs on a person's calendar, not on a schedule. A launch week, a holiday, a sick day — and that period is simply absent from the history, permanently.
- Schema drift. A column gets added, a header gets renamed, a report type changes shape, and a formula either returns zeros or, worse, returns plausible but wrong numbers that nobody catches.
- Staleness. By the time the weekly deck is assembled, the bids and budgets that produced those figures have already been adjusted several times. You are reviewing a decision that has moved on.
The deeper problem is joinability. Screenshots and ad exports capture campaign performance, but they cannot be joined to margin, landed cost, or inventory position. A seller can watch ACoS improve on a SKU and still not know whether that SKU earned money, or whether the units it pushed are still in stock. CTR and CVR get measured; profitability and sell-through do not. The reporting cycle and the decision cycle end up speaking different languages.
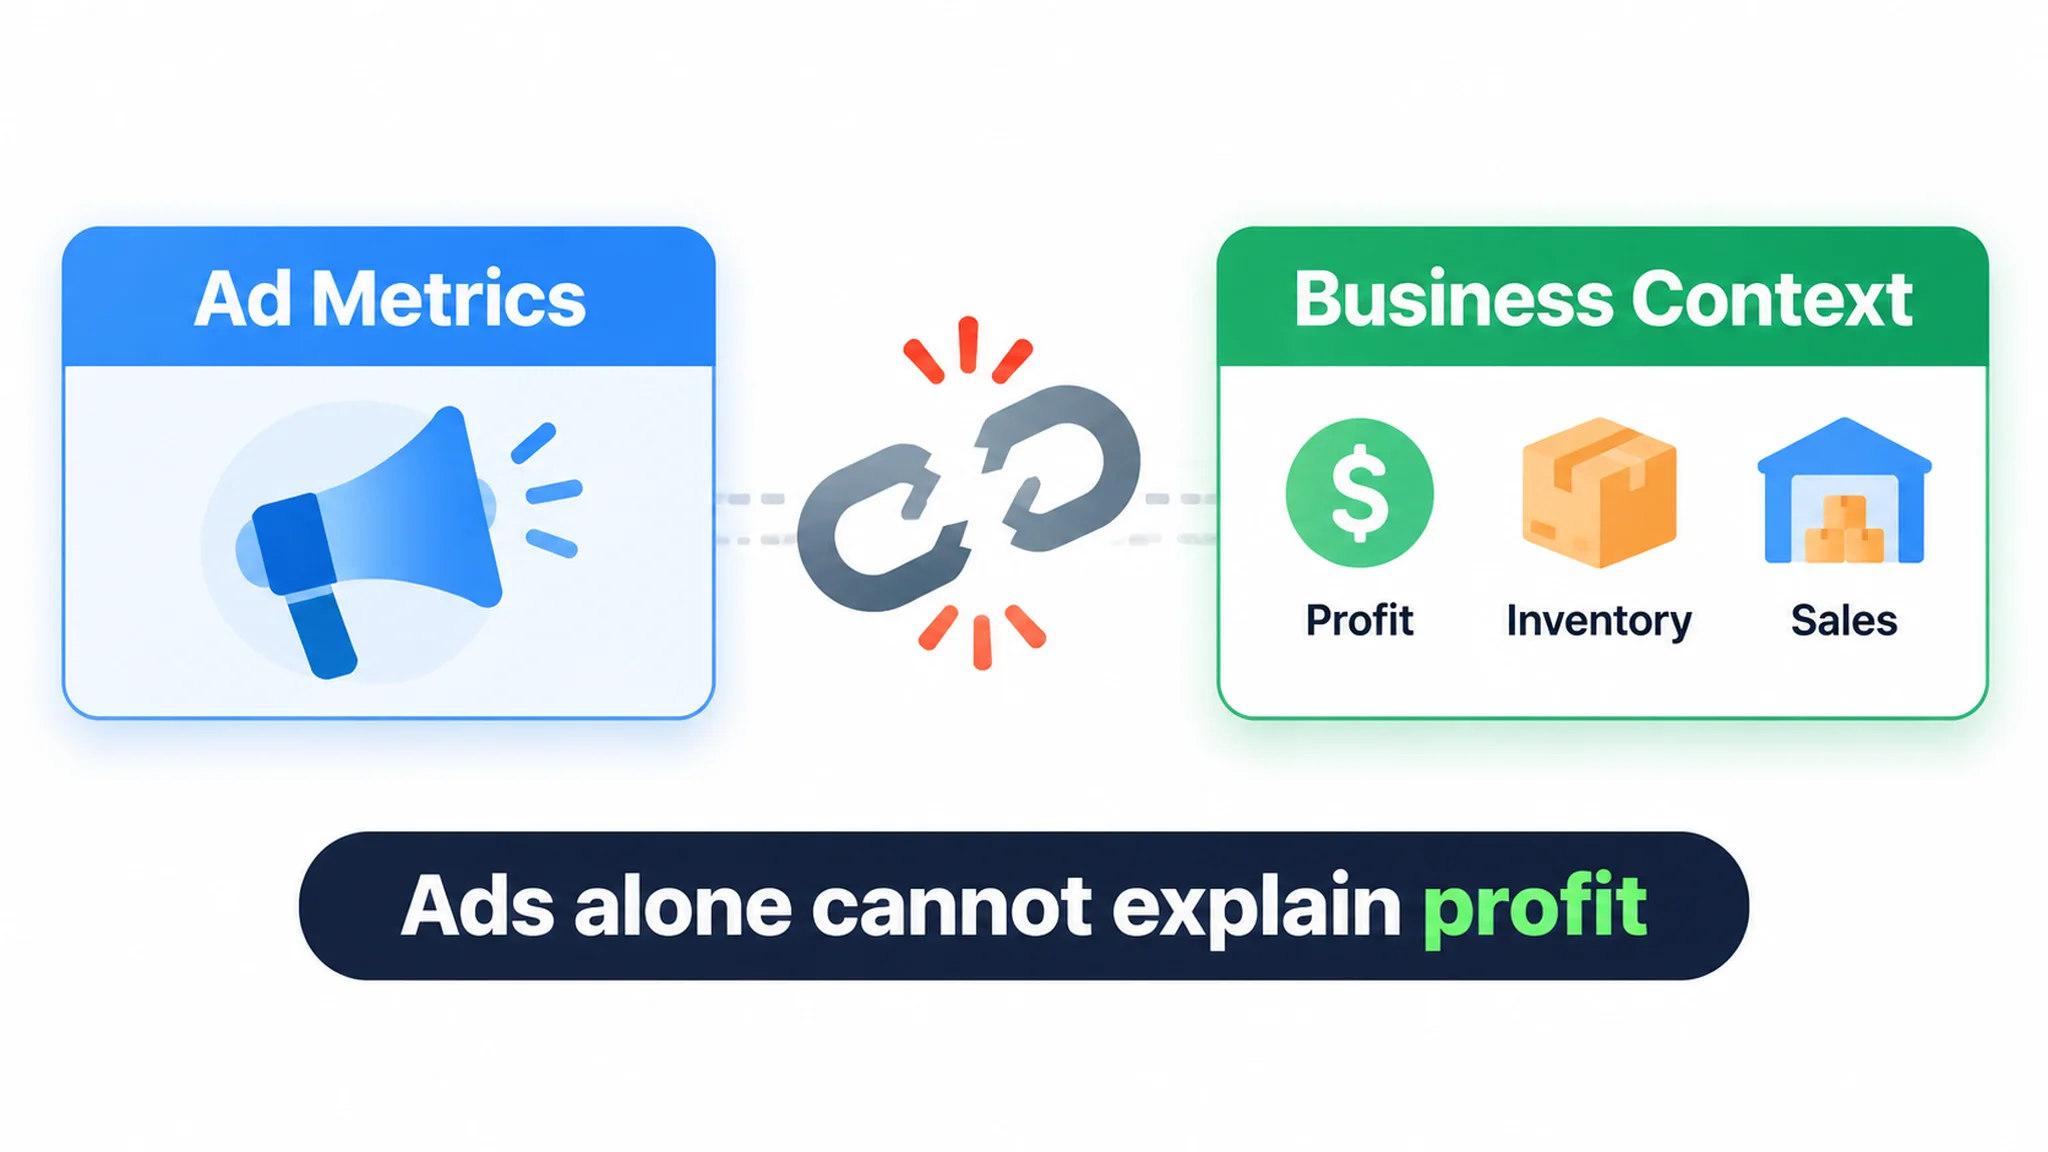
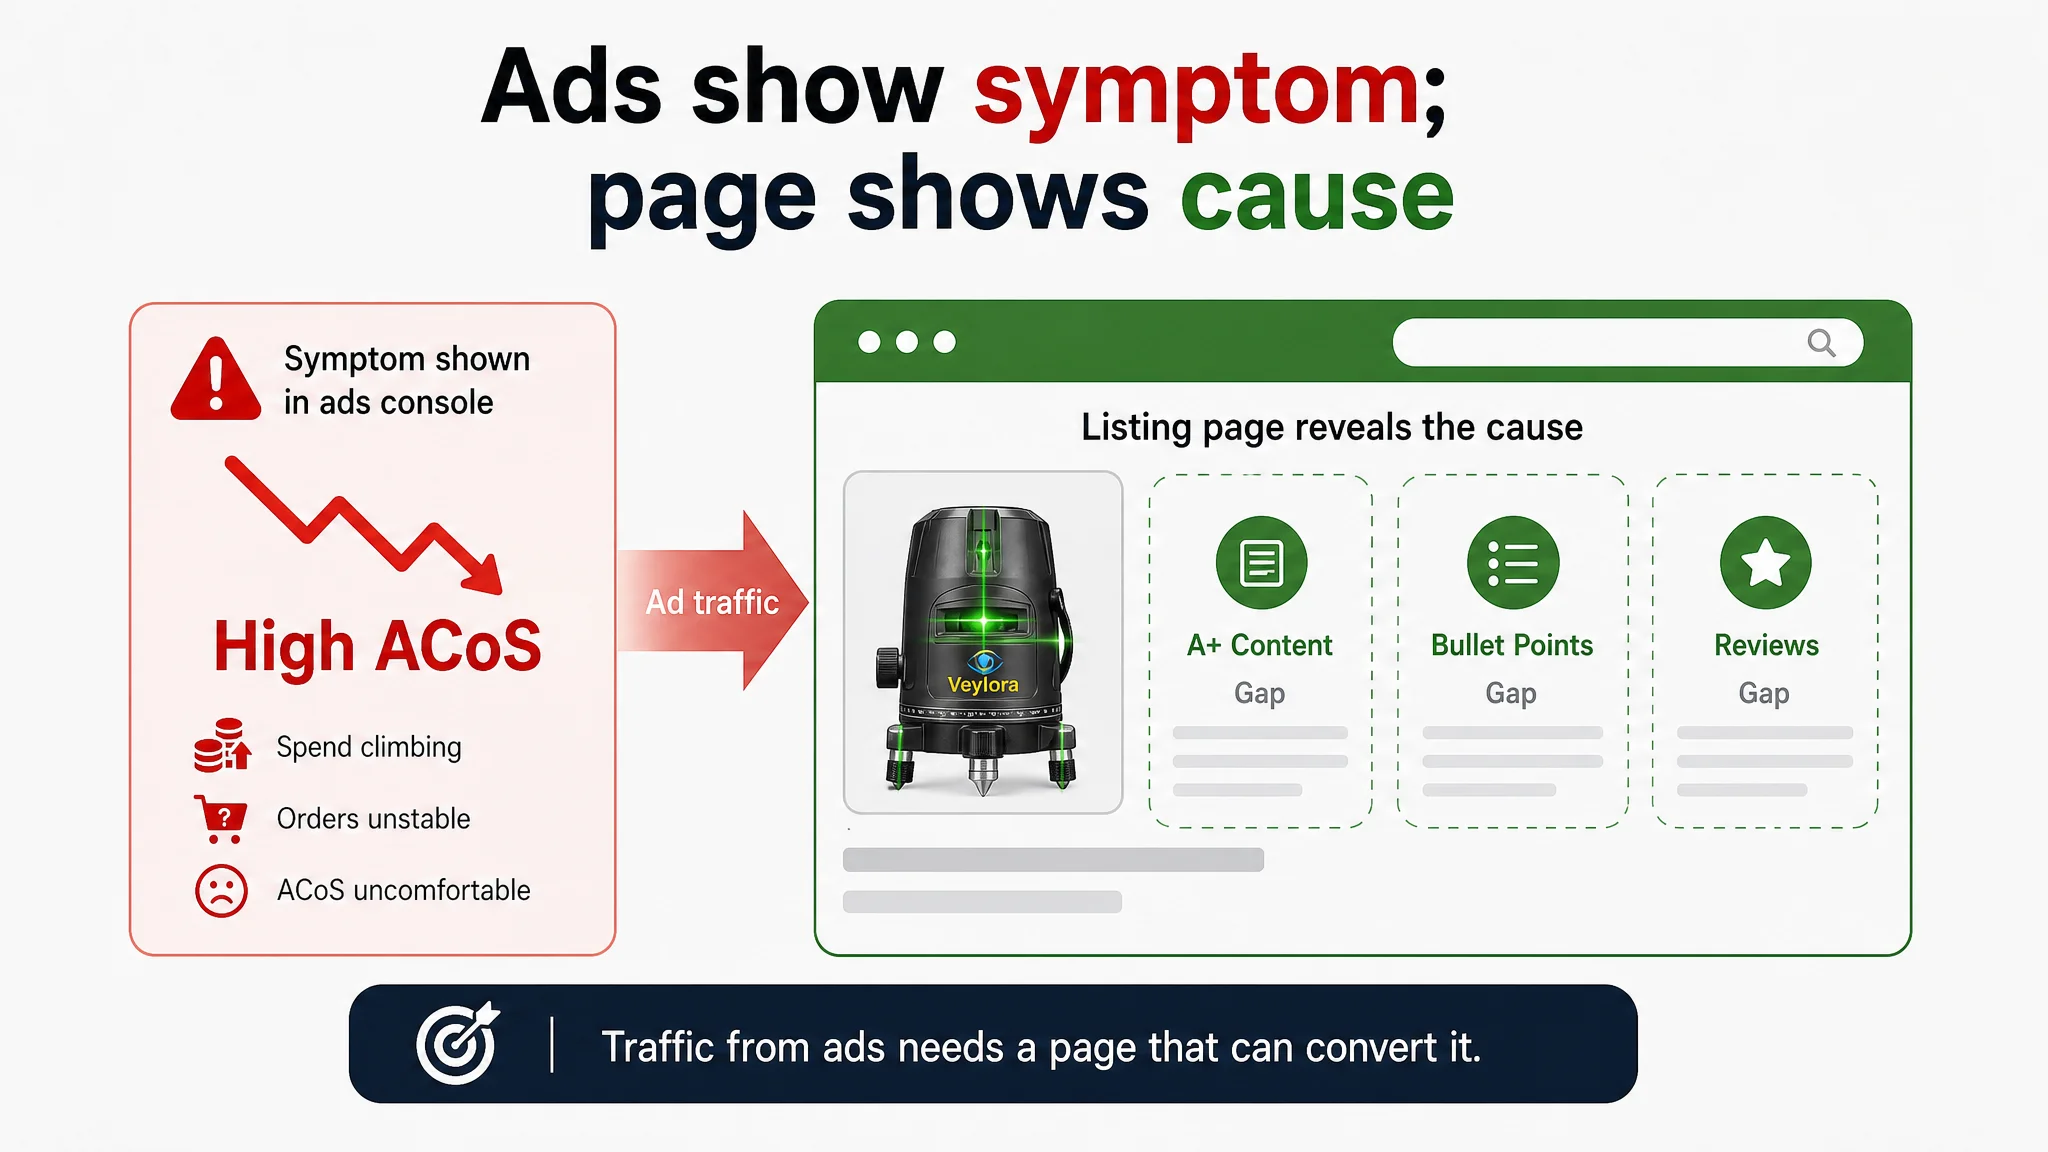
That problem is not theoretical. In a construction-tools project, a seller of a new green laser level was reviewing a Sponsored Products account where spend was climbing, orders were unstable, and ACoS looked increasingly uncomfortable. Internally, the issue was framed as an ad problem—keyword sets were rebalanced, inefficient terms were trimmed, bids were adjusted, budgets and placements were tested. The ad console could show the symptom, but it could not show the cause, because it did not sit next to the listing's conversion capacity. Once the page was benchmarked against a category-leading competitor, the dominant gap appeared in A+ content (0/25 vs. 24/25), bullet points (4/10 vs. 8/10), title (7/20 vs. 15/20), and reviews (one review vs. 2,295). The reporting layer was measuring the ad entry point while the decision depended on the page that had to receive it. Without a data layer that can join ad metrics to listing and conversion signals, the same numbers can keep pointing the team back into the ads console.
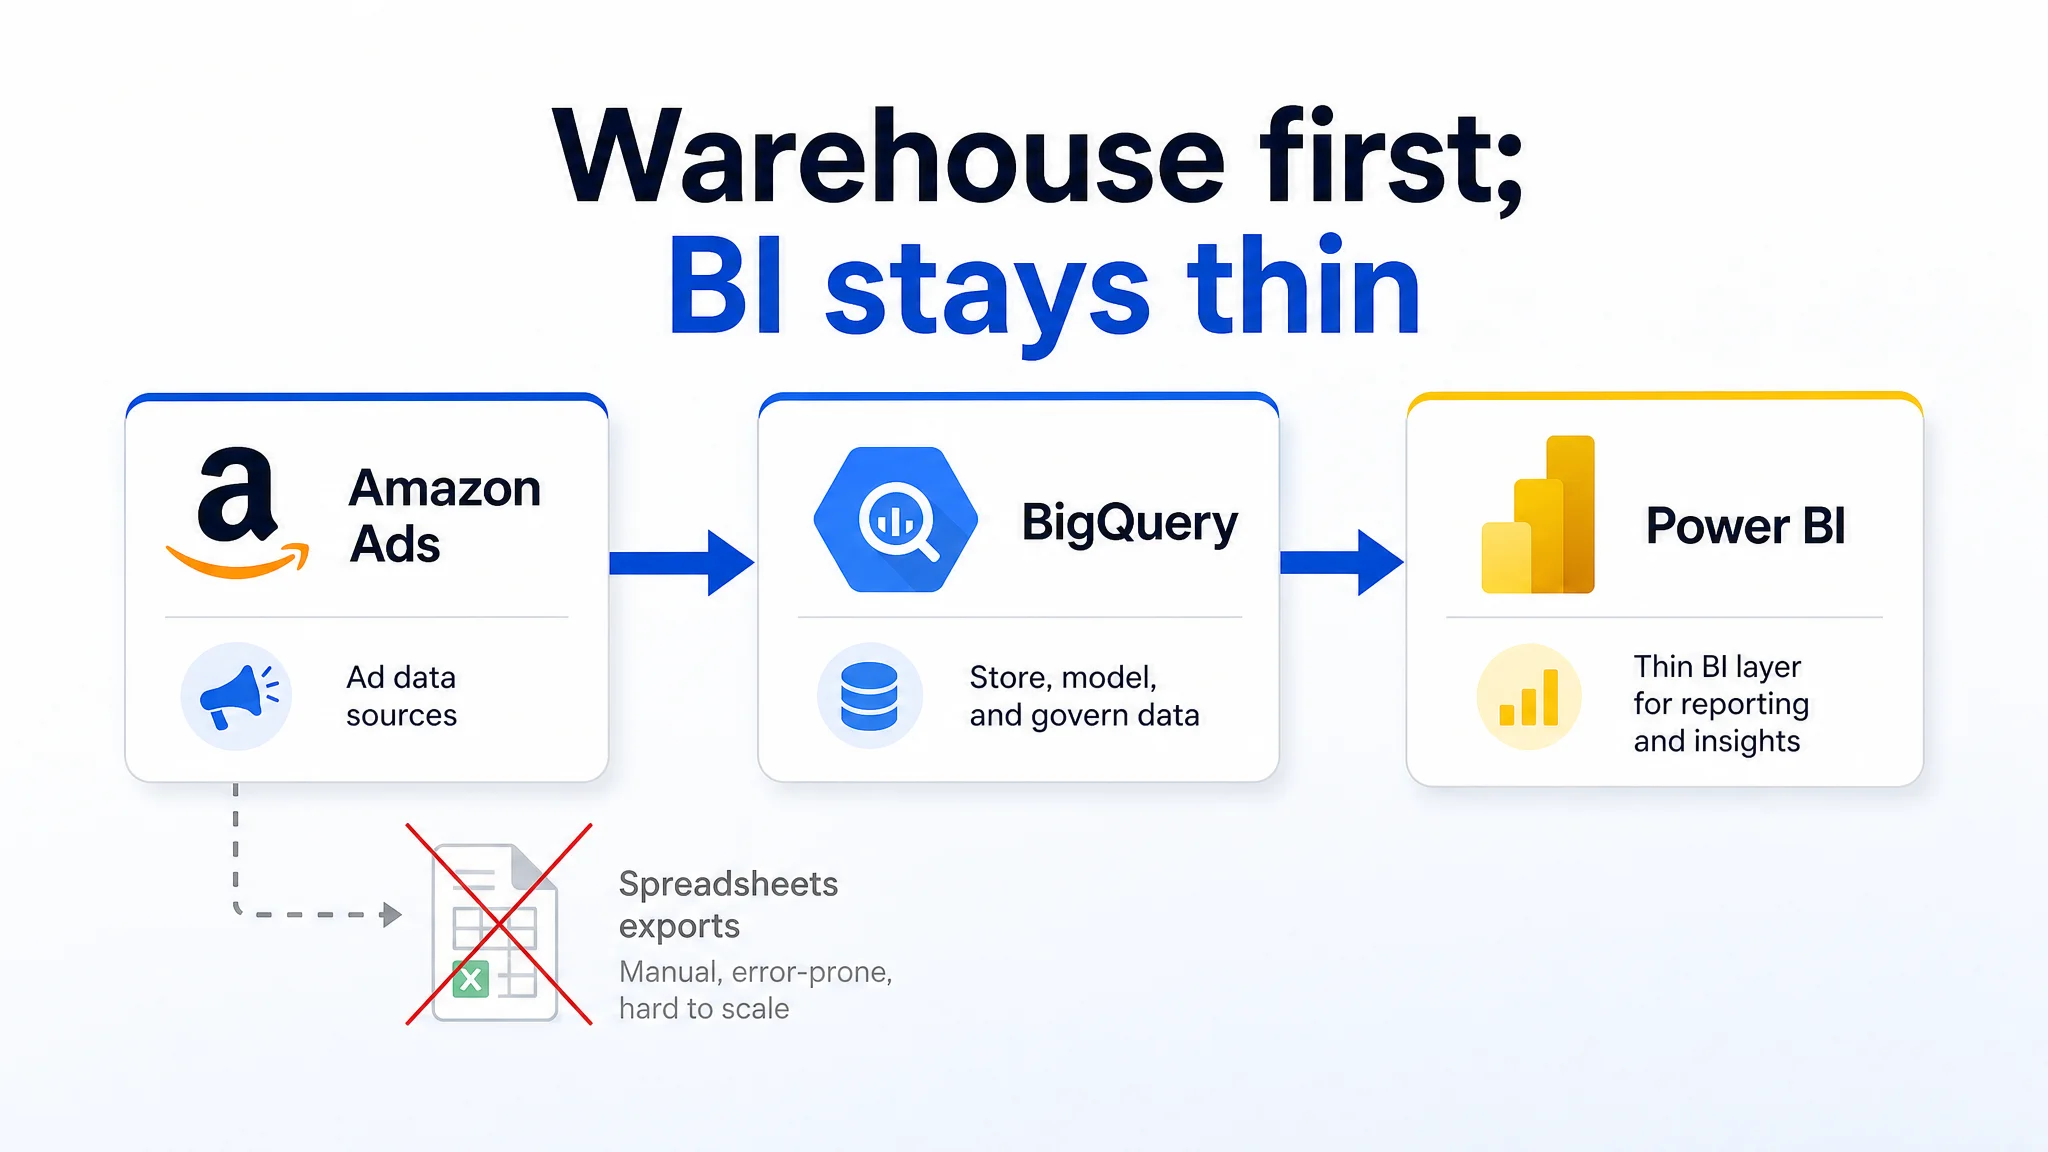
The remedy is structural: an Amazon Ads → warehouse → Power BI chain. Ad data lands in a governed table, joins cleanly to cost, inventory, and catalog data, and Power BI reads from that joined layer rather than from a fresh export each time. Metric definitions live in one place, so every chart uses the same ACoS.
State this plainly: this is a reporting architecture choice, not a tool purchase. Naming the tool first inverts the order and produces dashboards nobody trusts.
DeepBI's ad quantification adjusts bids and budgets daily using the prior 7 days of clicks, conversions, spend, and ACoS, so the cycle that acts on Amazon Ads data and the cycle that reports on it can share one metric vocabulary.
Why Sync Amazon Ads to BigQuery First
Amazon Ads does not provide a native Power BI connector. That constraint makes an intermediary mandatory: either a warehouse or exported files sit between ad data and the BI layer. Exported spreadsheets can support a one-off review, but recurring reporting turns refresh schedules, backfills, and metric definitions into manual work. A warehouse-first hop makes the pipeline explicit and repeatable.
BigQuery stores raw and modeled ad data; Power BI reads it through a BI connector. This separation keeps the BI layer thin. Storage, history, and transformation are handled once, instead of being rebuilt inside every report. BigQuery is not a universal performance guarantee: performance on very large datasets depends on partitioning, clustering, query design, and available resources. The responsible claim is conditional—well-modeled tables can perform at scale—not a promise of instant results at any volume. Named features are checkable: partitioning and clustering for query pruning, BigQuery ML for warehouse-native modeling, and BI connectors for downstream access.
Comprehensive Performance Analysis Across Campaigns and ASINs
Once data lands, the first payoff is a stable metric set: impressions, clicks, CTR, conversions, CPC, spend, ACoS, and TACoS. Join campaign → ad group → keyword/ASIN, then compare windows on the same definitions. Console date pickers can show a range; they are poor at consistent period-over-period analysis when exports and definitions vary. A warehouse preserves the history and lets you isolate structural shifts from daily noise. Daily tuning on a 7-day window is useful here: the trend line becomes interpretable instead of reacting to every spike. DeepBI's four-layer funnel—explore, filter, precision, scale—offers a segmentation logic that a Power BI model can mirror, so each campaign and ASIN sits in the right performance context.
Campaign and ASIN analysis is most useful when it can separate a traffic problem from a page problem. In the laser level project, the campaign view alone showed high ACoS and unstable orders, which naturally pointed toward bids and targeting. The analysis became decisive only when those same ASIN-level metrics were read beside a benchmarked listing score: 38/100 for the target listing against 87/100 for the category competitor. That comparison did not replace the ad data; it gave the ad data a business context. Without it, a team can keep isolating structural page weakness as if it were daily noise.
Predictive Insights With Built-in ML
BigQuery ML allows budget and demand scenarios inside the warehouse, without exporting ad data to a separate modeling tool. Treat predictions as hypotheses to test, not verdicts. Validate them against sales, search demand, and margin before acting on a budget shift. Ad-side signals can lead consumer behavior, but they cannot prove a durable trend alone. The useful pattern is claim, then condition: a forecast is only as good as the business data used to confirm it.
Unified Data for Smarter Decisions
Join ad spend to margin, inventory, and returns in one model. A shared metric definition ends reconciliation meetings and gives every team the same ACoS, TACoS, and contribution view. Ad-side optimization and business-side margin analysis answer different questions, and both are needed. DeepBI's ad efficiency metrics—ACoS, ROI, and effective spend share—become more actionable when they sit beside margin data in the same model.
The laser level project shows the same logic at the listing level: ad spend, ACoS, title score, bullet score, A+ score, and review structure had to be read in one frame. Separately, the ad report said “spend is rising” and the listing review said “the page is not persuasive.” Together, they said something more useful: paid traffic was being sent to a page that could not explain the product. That is the difference between unified data and a larger pile of exports.
Amazon Ads to BigQuery: How to Sync Ad Data in Real Time (2 Easy Methods)
There are exactly two practical routes for moving Amazon Ads data into BigQuery: an automated incremental pipeline or a manual export/import routine. One builds a repeatable reporting asset; the other is a low-frequency extract. That tradeoff determines whether CTR, CVR, ACoS, and BSR analysis stays sustainable or turns into spreadsheet maintenance.
Method 1 - Automated, Incremental Sync Through a Managed Pipeline
- Configure source credentials and select the Amazon Ads profile tied to your marketplace group.
- Select the correct region, not just the profile name. A wrong region returns no data, so the pipeline can look connected while writing empty tables.
- Set a start date that fits the report type and analysis need. Avoid assuming a fixed historical lookback; availability varies by report type and interface.
- Choose the destination BigQuery dataset and table naming convention before the first run. Keep raw report fields so CTR, CVR, ACoS, and spend can be recalculated downstream.
- Schedule the sync as incremental sync of new or updated report data. Amazon Ads is a reporting API; it exposes report output, not transactional row-level change logs.
- Treat it as low-latency, near-real-time sync subject to Amazon Ads API report generation, polling intervals, and connector schedule, not as instant data.
Method 2 - Manual Export and Import of Amazon Ads Reports
- Pull the required report using the same profile, region, and report scope you would use in the automated method.
- Export CSV or JSON, load it into the BigQuery destination dataset, and name files by report type, marketplace, and date range.
- Verify row counts and date coverage before analysis; missing dates or a row-count mismatch usually mean a partial pull or wrong region.
- Accept the recurring manual cost: download, rename, load, and validate on every refresh. This works for ad hoc reviews but slows CTR/CVR/ACoS checks and daily optimization.
Prerequisites and Permissions You Must Get Right First
Use one canonical permission list for both methods; do not create a second variant:
- Account access: the Amazon Ads account and user can reach the required profiles. Verify current permission names in Amazon Ads account settings before connecting.
- Marketplace group and region access: the user can view the marketplace group and region intended for the sync.
- Report scope access: the user can pull the required report type, metrics, and date range.
- Destination dataset access: the user can create or write to the target BigQuery dataset.
- Timezone: Amazon Ads reporting is returned in UTC; teams often review in local time. Store timestamps in UTC and translate in the BI layer; do not mix UTC and local dates in one comparison.
- Console versus API: expect small differences between advertising console and API-based reports; escalate only when the discrepancy is large and persistent, without inventing a universal numeric threshold.
Connecting Power BI to BigQuery: Import Mode, DirectQuery, and Refresh Limits
The connection you choose between Power BI and BigQuery sets a freshness ceiling that no amount of report design can raise afterward. Decide it before you build a single visual, because it determines how your CTR, CVR, and ACoS views behave when someone asks a pointed question during a Monday performance review.
Import mode copies the queried data into Power BI's in-memory model. Queries against that model return quickly, which matters when a report blends Sponsored Products spend with search term performance across several months of history. The trade-off is structural rather than cosmetic: the numbers are only as current as the last scheduled refresh. Between refreshes, your ACoS view is a snapshot, not a live reading, and anyone comparing it against the Ads console will see a gap.
DirectQuery flips that trade. Each visual queries BigQuery at the moment the report renders, so there is no duplicate copy and no refresh schedule to wait on. The cost is speed—visuals can feel noticeably slower, and heavy report pages push more load onto the warehouse. DirectQuery also does not deliver true real-time data; it reflects what has already landed in BigQuery, which itself depends on how your ad data pipeline runs.
Refresh frequency is capped by license, not by intent:
- Power BI Pro allows up to 8 scheduled refreshes per day.
- Power BI Premium allows up to 48 per day.
- Hourly refresh requires Premium or Fabric capacity.
Treat those figures as ceilings attached to a specific license condition, and verify the current terms directly with Microsoft rather than relying on quoted numbers or prices. Licensing terms change, and an assumption baked into your refresh schedule is expensive to unwind later.
Freshness, however, is not diagnosis. A more frequent refresh of the laser level seller's ACoS view would still have shown the same uncomfortable number; it would not have revealed that A+ content was absent (0/25 vs. 24/25) and reviews were one versus 2,295. Refresh cadence determines how current the view is; the data model determines whether the view can explain the decision.
If scheduled refresh routes through a gateway, that gateway becomes part of your reporting pipeline's reliability. A gateway outage rarely throws a visible error in the finished report. It quietly leaves yesterday's numbers on the page while operators make decisions as though they were current.
Designing the Dashboard: Metrics That Change Decisions
Most ad dashboards fail before the first chart loads. They answer “what happened?” with twenty-five tabs, then leave the operator to guess which number deserves a decision. A better design constraint is five to seven core visuals, each tied to an action.
Start with a five-view operating set:
- ACoS by campaign, sized by spend.
- TACoS trend over rolling windows.
- A spend-to-margin waterfall.
- A keyword diagnostic table showing CTR, CVR, and order value.
- A rolling seven-day performance view against the prior window.
Add organic order share as the sixth view when the organic bridge matters. Every other chart is a drill-down, not a headline.
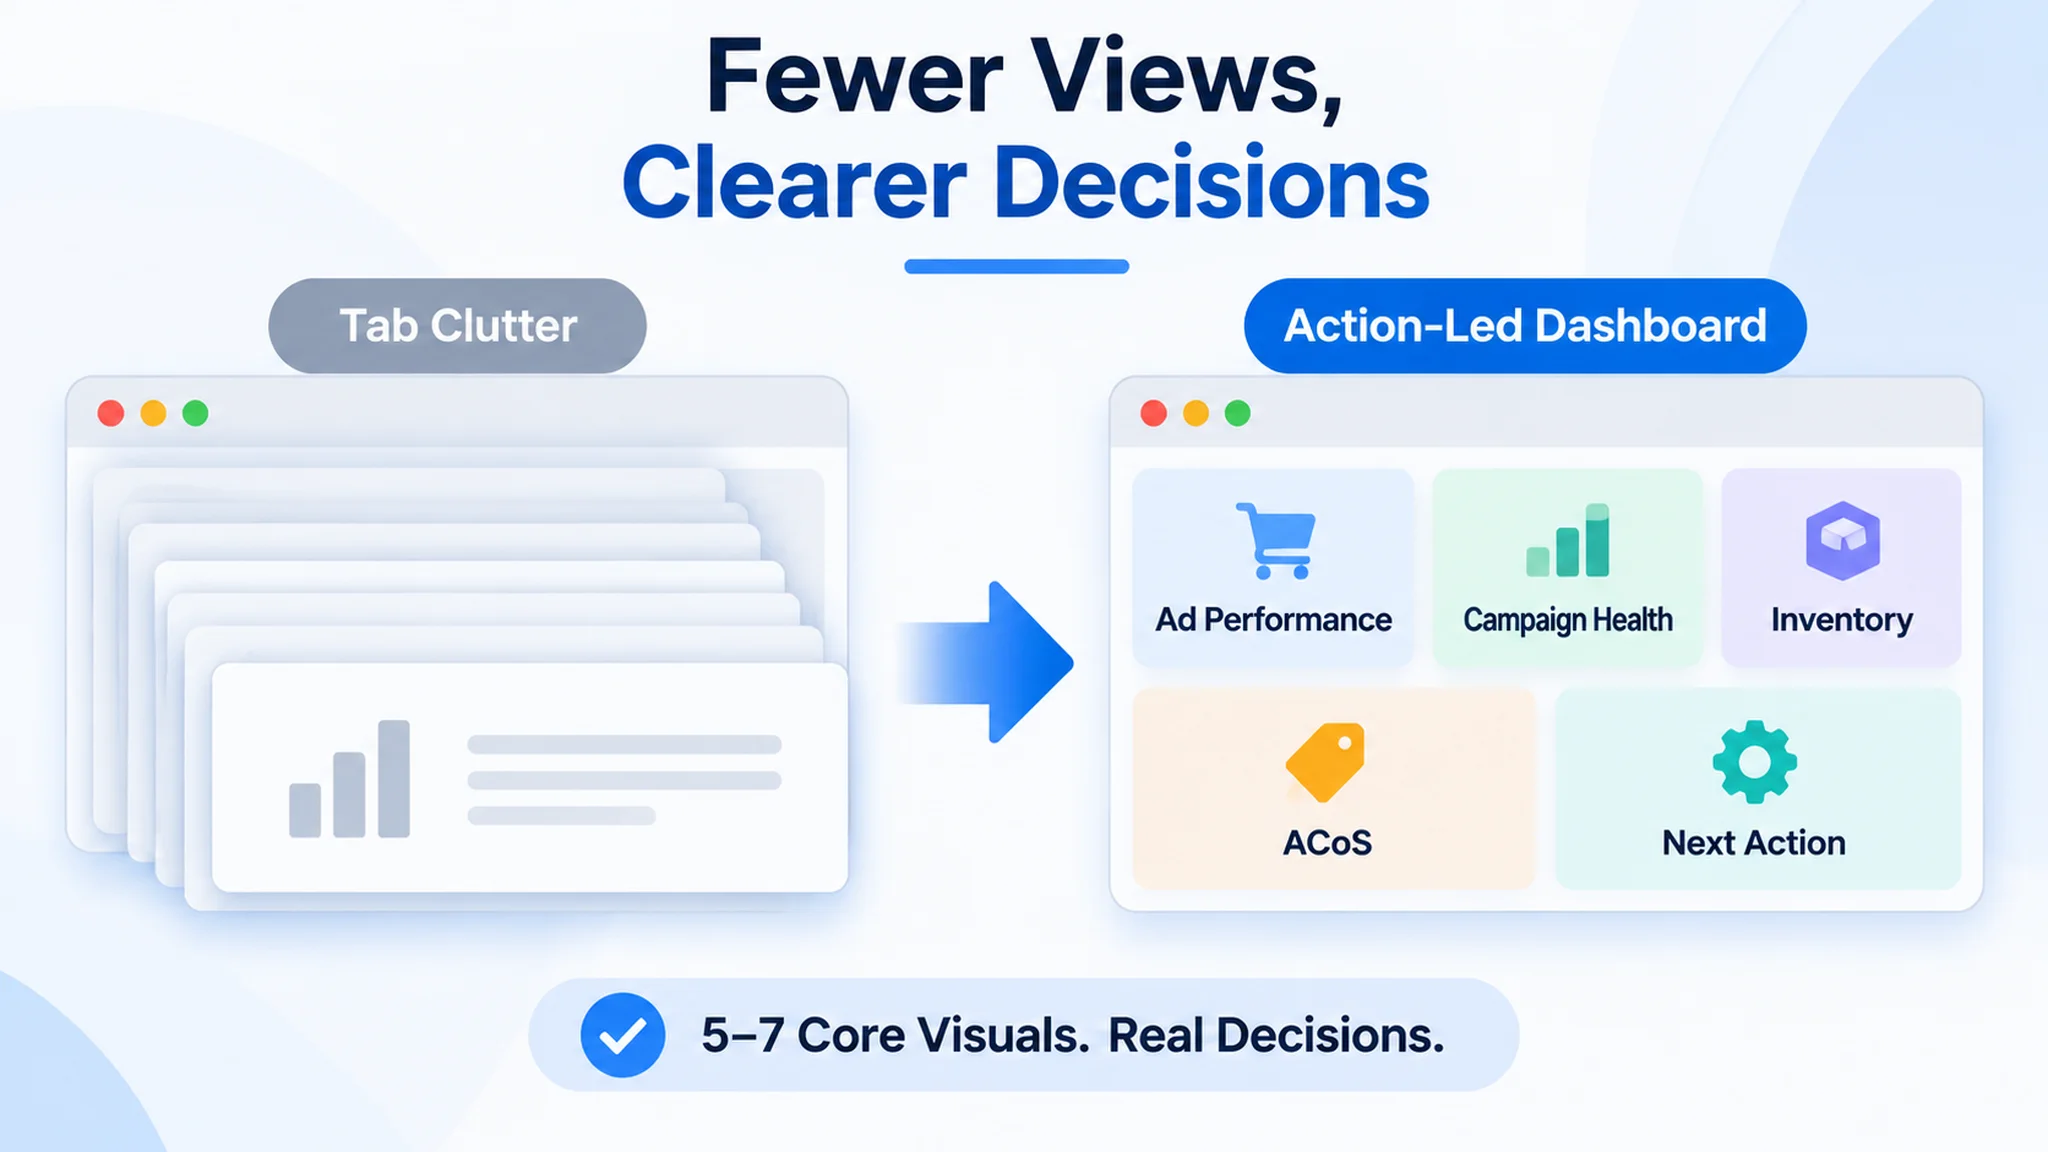
Define TACoS precisely: ad spend ÷ total sales, organic included. It measures ad dependence and sustainability; it is not CAC, and treating it as a customer-acquisition cost corrupts the decision. The campaign view tells you where paid efficiency is leaking. The spend-to-margin waterfall tells you whether the leak is affordable. The keyword table routes diagnosis: low CTR points to the main image or headline; low CVR points to A+ content, proof, and offer fit; high order value with high CTR/CVR marks a keyword worth defending.
A laser level project is a useful test of whether a dashboard routes decisions or only describes symptoms. The account had the familiar ad views: spend by campaign, ACoS trend, keyword performance. But the decisive view was a listing-conversion view placed next to those metrics. The target listing scored 38/100 against a benchmark at 87/100, with the largest gaps in A+ content (0/25 vs. 24/25), reviews (4/15 vs. 13/15), title (7/20 vs. 15/20), and bullets (4/10 vs. 8/10). On that page, low CVR did not point to a bid tweak; it pointed to missing proof and missing explanation. A dashboard that stops at ACoS would have sent the operator back into the ads console.
Targets come from contribution margin, not from a copied screenshot. Work backward from order-level contribution margin to the maximum ad spend that keeps the order profitable, then use that break-even ad spend as the campaign ceiling. If you color-code bands, label them as illustrative examples tied to your margin and break-even math. Never present green, yellow, and red cutoffs as universal benchmarks.
DeepBI's tuning context matters here: daily adjustments based on seven-day windows mean day-to-day swings are partly strategy and partly noise. Show rolling windows and event annotations so a single-day ACoS spike does not trigger a premature rewrite.
From Ad Spend to Organic Rank: The Natural Traffic Bridge
The bridge runs in one direction: ads inform organic, not the reverse. Ad data surfaces high-CTR, high-CVR, high-order-value keywords; those are the terms that justify focused organic pushes. Track TACoS and organic order share, not ranking anecdotes. The intended causal chain is: ads identify winners, organic rank compounds, blended TACoS falls. DeepBI's fifth-layer natural traffic strategy—keyword screening from ad data, Top of Search emphasis, and dual growth of paid scale and organic position—is the execution side of that bridge. It improves the odds; it does not guarantee ranking outcomes.
The laser level seller is a reminder that the bridge starts with a page that can convert the traffic it receives. Ads can surface high-CTR, high-CVR, high-order-value keywords, but if the listing has no A+ content, thin bullets, and a single review, the organic bridge has nothing stable to build on. Paid traffic may identify the terms; the listing still has to defend them.
Competitor Layout Gap: Benchmarking Creative and Listing Signals Next to Ad Data
A soft CTR is usually met with a guess: swap the main image, rewrite the title, see what happens. That guess is expensive because it is untargeted. The disciplined alternative is to segment CTR by ASIN and by creative first, so the weak child and the weak asset surface before anyone touches a design file.
Once CTR trails comparable competitors, two hypotheses deserve testing rather than one. The first is targeting mismatch: the ad is reaching shoppers whose search intent does not match the product form. The second is listing or creative weakness: the right buyer sees the ad and the thumbnail simply does not earn the click. Ad data alone cannot separate them, which is why the layout review has to sit next to the campaign report.
A construction-tools seller in the laser level category is a clear example. The team arrived with spend climbing, orders unstable, and ACoS that would not come down. Their working explanation was an ads problem: rebalance keywords, trim inefficient terms, adjust bids, test budgets and placements. DeepBI's listing diagnosis against a category-leading benchmark reframed the issue. The target listing scored 38/100; the benchmark scored 87/100. The gap was not one weak asset; it was a page that could not tell the product's story.
- Title: Target Listing: 7, Benchmark Listing: 15, Max: 20, Gap: -8
- Main images: Target Listing: 23, Benchmark Listing: 27, Max: 30, Gap: -4
- Bullet points: Target Listing: 4, Benchmark Listing: 8, Max: 10, Gap: -4
- A+ / Detail page: Target Listing: 0, Benchmark Listing: 24, Max: 25, Gap: -24
- Reviews: Target Listing: 4, Benchmark Listing: 13, Max: 15, Gap: -9
The two red flags were A+ / detail page at 0 vs. 24, and reviews at one review vs. 2,295 for the benchmark. The target had no A+ content at all, bullets were effectively missing as a decision path, and the title leaned on vague phrases such as “Outdoor Lasers 5 Lines” and “Super Bright” rather than product type, technical spec, application scenes, and accessories. The benchmark used a hardened title formula—brand, product type, 3x360° green laser, self-leveling, construction and picture hanging, magnetic bracket and hard case—and its A+ page did the work of proving professional fit: hero coverage, mode grid, self-leveling in a home scenario, manual tilt on stairs, pulse mode outdoors, battery runtime, and IP54 durability. That is why the review has to sit next to the campaign report: the campaign data says the click is not landing; the listing review says why the page cannot hold the shopper after the click.
The inputs for that review are concrete: main image visual, title structure and keyword weight, bullet hierarchy, A+ module richness, and review structure. Review structure is a scoring input only—a signal of how the listing is perceived relative to the benchmark, not an operating lever.
The output should be a prioritized fix list ranked by expected impact, not a total score. A number tells you that you are behind; it does not tell you where the loss occurred. Good diagnosis attributes score loss to a specific visual module or text logic and converts each key gap into a downstream instruction. The difference matters: “improve the texture” is not executable, while an instruction specifying composition, camera angle, light distribution, scene elements, and color tone is.
In the laser level project, the main-image guidance was not “make it prettier”; it was a role-based set: a primary image with industrial styling, 45° perspective, and a clear professional 5-line laser tag; an assurance frame with “2-Year Quality Assurance”; a multi-scene grid for tiling, picture hanging, ceilings, and vanity installation; a close-up on battery and Type-C charging; and a clear split between self-leveling and manual/tilt use on stairs and irregular surfaces. Each image carried a distinct piece of the conversion story. That is the difference between a generic creative refresh and a fix list that a designer can execute.
Verification then happens in the ad data. Low CTR paired with a weak main-image score points to a missing visual hook; low CVR paired with lagging A+ and review scores points to a trust or continuation problem. When a new image goes live, it is marked as a visual iteration event point in the ad report so the CTR slope over the following 7-14 days can be observed. That is a signal, not proof that one asset caused the shift.
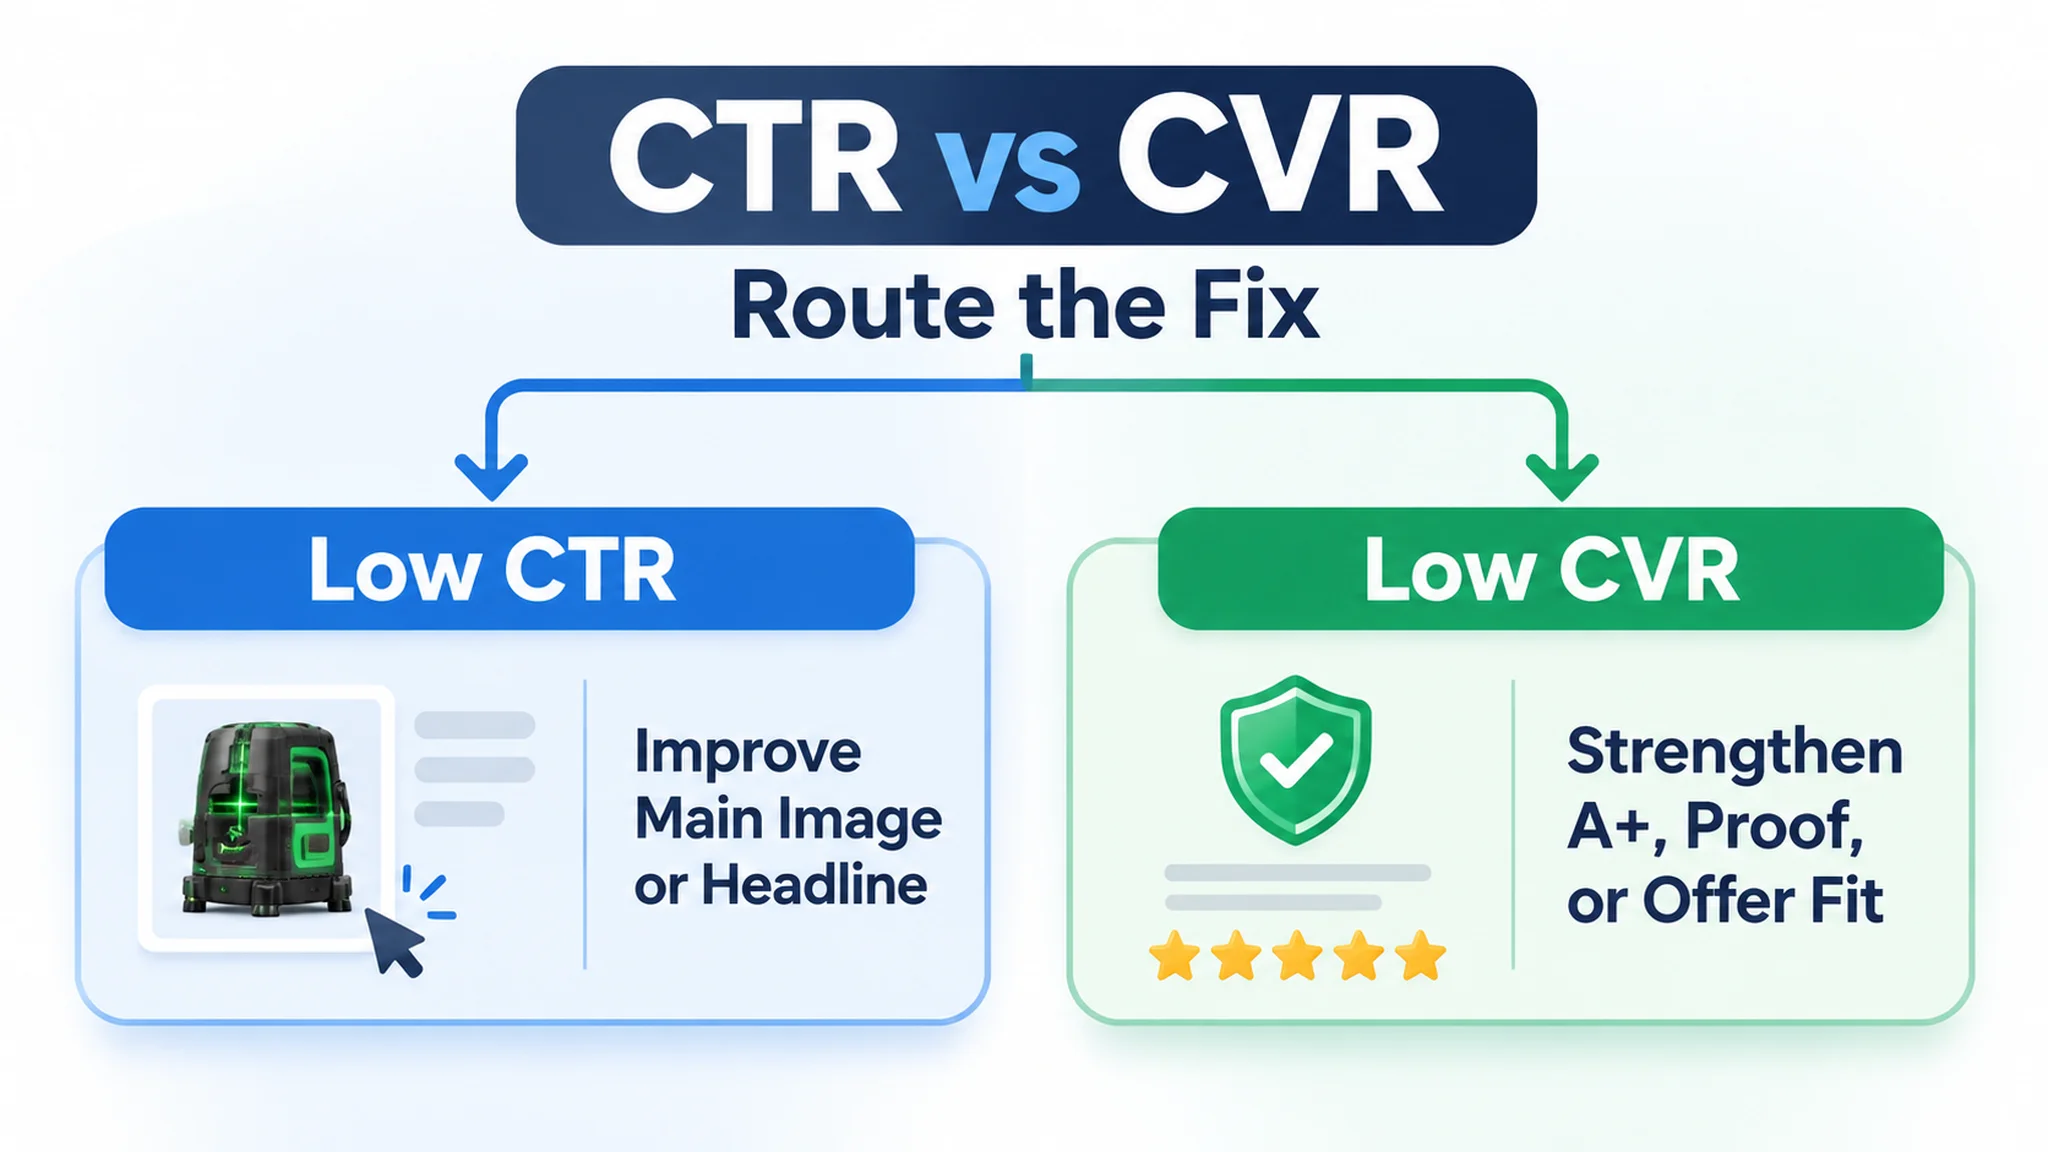
DeepBI's competitor benchmark and multi-dimensional diagnosis generate that prioritized list, filtering candidates by product form, price band, and audience instead of benchmarking against Bestseller #1 by reflex.
Where DeepBI Fits in an Amazon Ads + Power BI Workflow
Power BI is the reporting and visualization layer that sits across systems—ad consoles, sales, inventory, finance. It answers what happened and how performance compares across sources. It does not fix anything. The decisions that move ACoS, CTR, or BSR happen inside Amazon, one iteration at a time.
The laser level project shows the boundary clearly. Power BI can show that ACoS is high and spend is rising; it cannot decide that the listing has no A+ content and only one review. DeepBI's diagnostic judgment was that ads were not the core constraint. Continuing to tune bids first would have raised spend on a structurally weak listing and produced noisy data, because ad experiments would be blurred with page-level problems. The priority was to rebuild the listing around title, bullets, main images, and A+ content before expecting ad data to reflect keyword fit or creative strength.
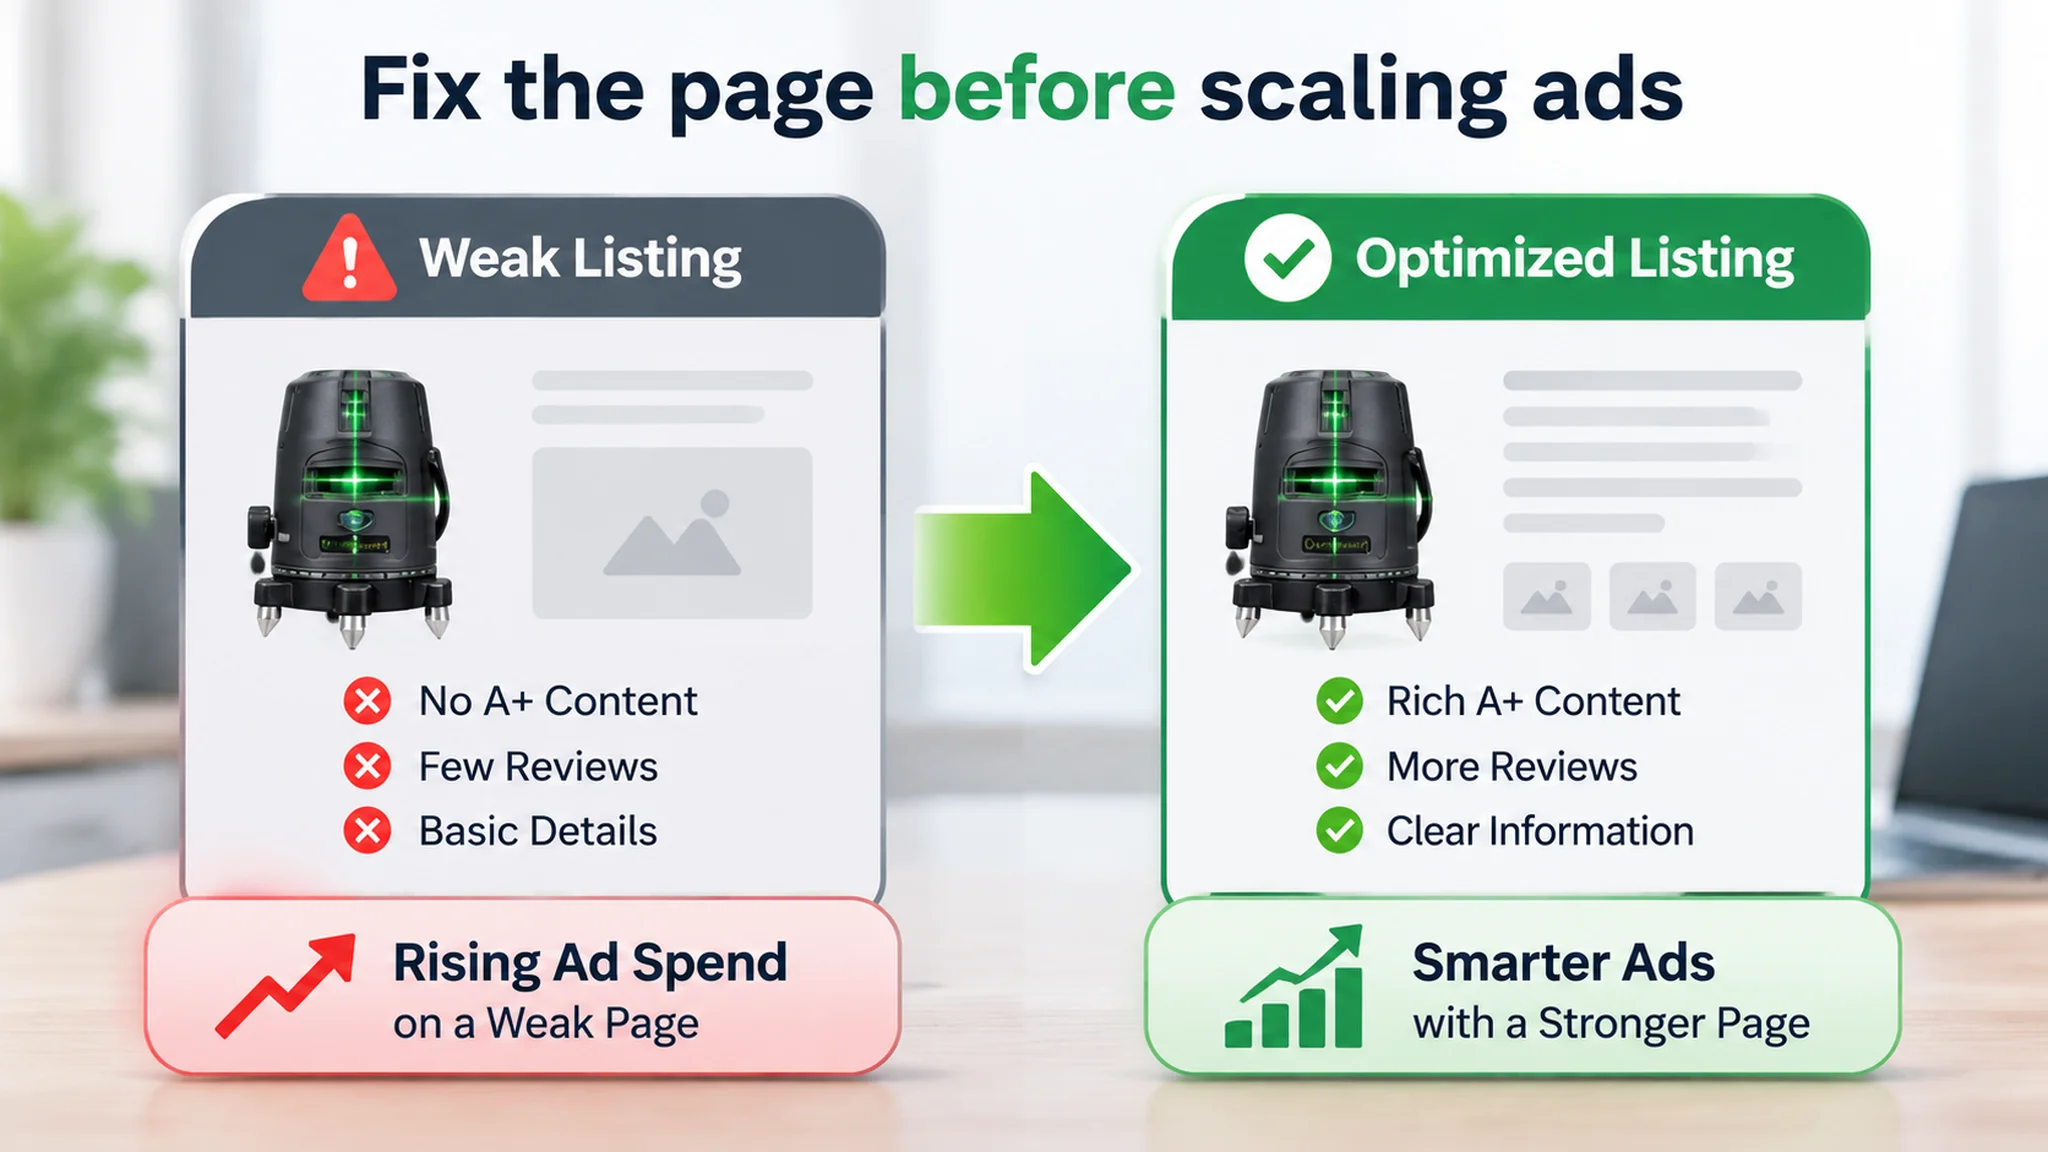
DeepBI is that Amazon-side operating cycle. It runs a four-layer ad funnel diagnosis—impressions, clicks, sessions, orders—so a weak CTR gets attributed to a specific cause, such as main-image competitiveness, instead of a vague “performance is down.” From there it tunes bids and budgets on a 7-day window, links ad data back to listing optimization, and connects ad performance to natural traffic strategy. It is positioned as an executor, not a creator or a decision-maker.
Humans still set the goal: protect ACoS on a mature SKU, scale a product that is converting, hold the line during a launch. The system executes and iterates against that goal, and every strategy change stays explainable and reviewable—one suggestion maps to one clear output, with the old-versus-new comparison visible before anything is applied.
The dashboard's job is to observe and validate. When a bid change lands, Power BI should show whether ACoS improved, whether CTR on the affected SKU moved, and whether the better placement actually converted. DeepBI acts, Power BI measures, and the human reads both.
What you should stop doing manually is rebuilding the same export-and-paste routine every morning—pulling ad reports into a spreadsheet, editing bids by feel, then screenshotting the console to see whether it worked. That routine is how a 7-day window turns into seven days of guessing, and how precision targeting slides back into guesswork.
Common Pitfalls and a 7-Day Rollout Plan
Most Amazon Ads to Power BI projects do not fail at the chart. They fail in the layer underneath it, and the same handful of mistakes repeats across accounts.
- Latency promises. A stated sync cadence is not a delivery guarantee. Treat any setup-time or near-real-time claim as a hypothesis to verify against your own account before you design reporting around it.
- Permission-list drift. Ad API scopes get tightened and widened over time. A permission you depended on in week one can quietly vanish in month three. Apply least privilege as a rule: request only what the reporting pipeline actually consumes, and audit that list on a schedule rather than once.
- Refresh-limit surprises. Dataset size and refresh capacity are constraints you plan around up front, not obstacles you discover mid-quarter when a stakeholder is waiting on a Monday morning view.
- Copied benchmark thresholds. Another seller's ACoS target or CTR floor is context, not a metric definition. Import thresholds as comparison, never as the definition of good.
- Calling incremental sync "CDC." A watermark-based incremental load is not change data capture. Expecting CDC behavior from an incremental job is how updated and deleted rows silently disappear from your ACoS and CVR trends.
- Manual export schema drift. CSV column order and naming change without warning, and the model breaks quietly. The official API connection removes this failure mode instead of monitoring it.
One more pitfall sits underneath the usual data-pipeline list: treating a page-level conversion failure as an ad-level reporting failure. In the laser level project, the ad report was not “wrong”; it was incomplete for the decision. The team could keep validating row counts, date coverage, and console totals while still missing that the listing had no A+ content and a single review. Validation has to include the business layer the dashboard is meant to explain.
The rollout that survives these pitfalls is validation-first: prove the data before you trust the chart.
- Days 1–2 — warehouse and sync. Stand up the warehouse tables and connect the sync. Build nothing downstream yet.
- Day 3 — validation. Check row counts, date coverage, and reconcile console totals against warehouse totals. Escalate and re-sync when a discrepancy is large and persistent; do not paper over it with a filter.
- Day 4 — data model and metric definitions. Define ACoS, CTR, and CVR once, in one place, so every report speaks the same language.
- Day 5 — first dashboards. Publish the smallest set that answers real questions.
- Day 6 — layout gap review. Compare against the console and against competing internal reports, then cut what nobody uses.
- Day 7 — report cadence agreement. Fix who reads what, how often, and what action each view is meant to trigger.
FAQ
Is there a direct Power BI connector for Amazon Ads?
No. Power BI does not connect natively to Amazon Ads as a first-party source. In practice, you land Amazon Ads data in a warehouse such as BigQuery, then connect Power BI to that warehouse, or you import scheduled file exports. The connector question matters because it determines whether you own a repeatable pipeline or a recurring manual task.
How real-time can the sync be?
Near-real-time, not true streaming. Sync latency depends on when Amazon Ads generates the report and how often your pipeline polls for new files. If the dashboard is used for daily spend control and ACoS review, that cadence is usually enough. If you expect second-by-second bid visibility, adjust the expectation before you design the dashboard.
Should we use Import mode or DirectQuery?
Use Import mode when you want stable dashboard performance and scheduled refreshes; Power BI holds a copy of the modeled data. Use DirectQuery when the dashboard must query the source directly and you accept that source performance and load shape the experience. For most Amazon Ads reporting, Import is the simpler operational choice; DirectQuery is a deliberate trade-off, not a default.
How often can Power BI refresh?
Refresh frequency depends on your Power BI license and capacity, so confirm the schedule your workspace supports before promising a reporting cadence. The practical rule is to match refresh to the decision cycle: spend and ACoS checks can follow the ad report cadence, while executive views can refresh less often. Do not assume the license permits the same schedule for every dataset.