


What Is Amazon Listing Conversion Rate?
Amazon listing conversion rate is units ordered divided by sessions. Sessions count the visits a listing's detail page receives; units ordered count the products sold in the same period. A listing that records 12 units ordered across 100 sessions is converting at 12%. That is the entire calculation — numerator, denominator, and a ratio expressed as a percentage.
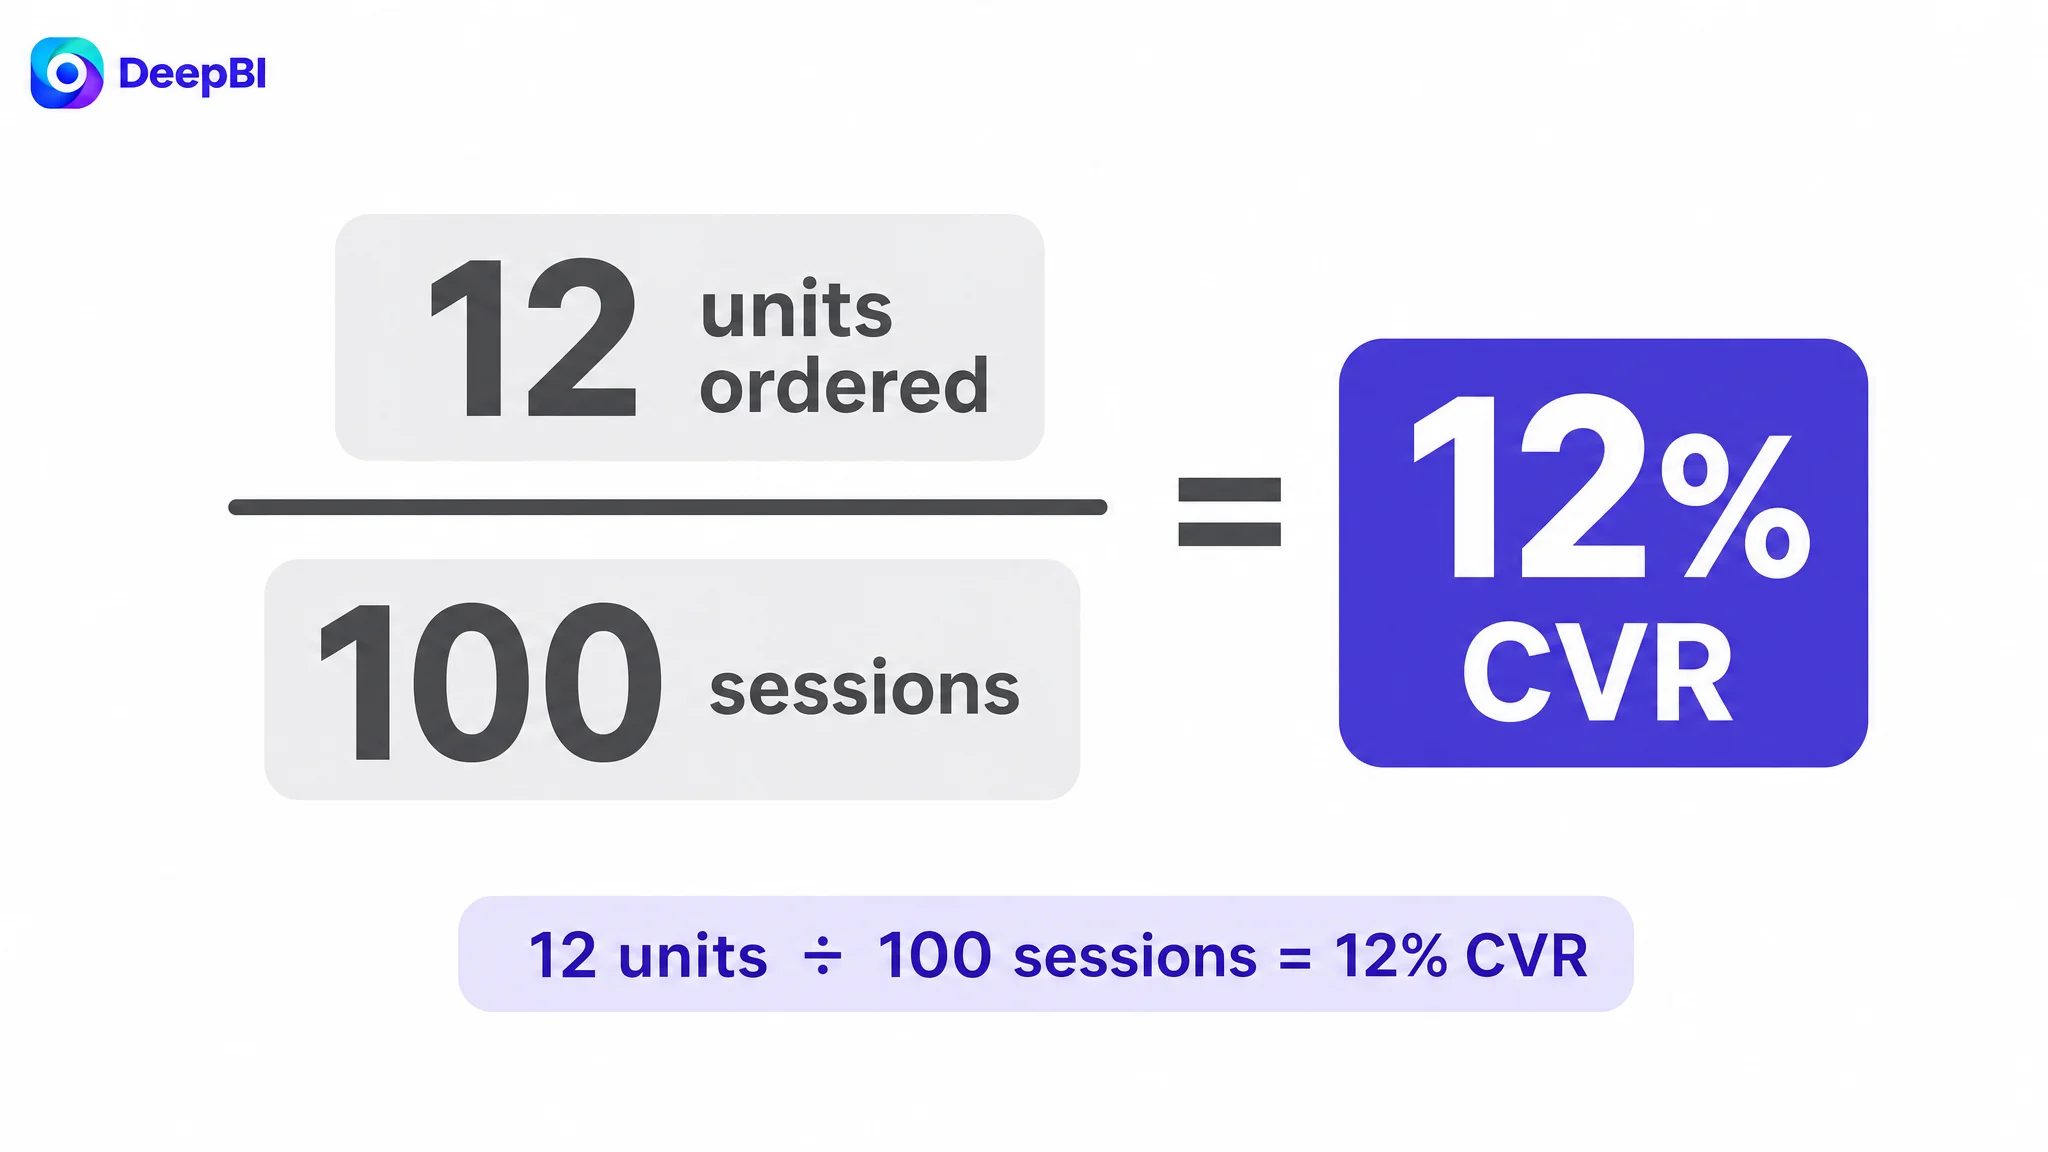
Sessions are the denominator because they represent the traffic the listing actually had to work with. Every session is a chance to convert, whether it comes from a first-time visitor or a returning shopper still comparing options. Anchoring the ratio to sessions keeps it tied to the traffic Amazon delivers — the same traffic paid campaigns buy. Dividing by anything else would measure a different question.
This is not a unique-buyer purchase rate, and the distinction matters:
- The numerator counts units, not people, so one shopper buying a three-pack contributes three units.
- A single shopper can generate multiple sessions before ordering, so sessions are not visitors either.
Reading 12 units over 100 sessions as "12 people bought" collapses two separate questions into one misleading number.
CVR is also a distinct backend indicator from CTR and order volume. CTR tells you whether the main image earns the click; CVR tells you whether the detail page, price, and offer carry that click through to an order. Confusing the two sends optimization budget to the wrong asset. CVR also drives advertising efficiency: weak conversion inflates ACoS because paid clicks keep buying sessions that never become orders. An accurate denominator is what keeps that diagnosis honest.
That distinction is not academic. In one grip-socks listing, the team read climbing ACOS as evidence that the campaign needed another round of bid and keyword work. But the page those ads were buying traffic for had essentially no visual proof layer in its A+ content. The advertising was not the source of the problem; it was reporting the page's inability to carry a click through to an order. Reading CVR correctly — units ordered over sessions — keeps the diagnosis anchored to the page's ability to convert, rather than to the campaign dashboard alone.
How Does Your Amazon Listing Conversion Rate Compare to Benchmarks?
A single conversion average cannot tell you whether your listing is healthy. CVR benchmarks shift by category, price band, traffic source, organic versus paid mix, seasonality, variation structure, and purchase model. A 10–15% figure sometimes circulates as a rough cross-category reference; treat it as directional context only, not a universal target or a “good” threshold.
Use your own historical baseline as the primary reference: match impressions, clicks, orders, CTR, and CVR to listing changes, and judge a new main image or A+ asset by the CTR slope over the following 7–14 days. Then add a similarity-constrained peer set—not the #1 Bestseller by default. Start from core search terms and leaf node, filter by product form, price band, and audience, and remove extreme prices and thin-review products. Keep comparisons within one marketplace and review module-level gaps across main image, title, bullets, A+, and VoC feedback. That turns benchmark context into diagnosis rather than absolutism.
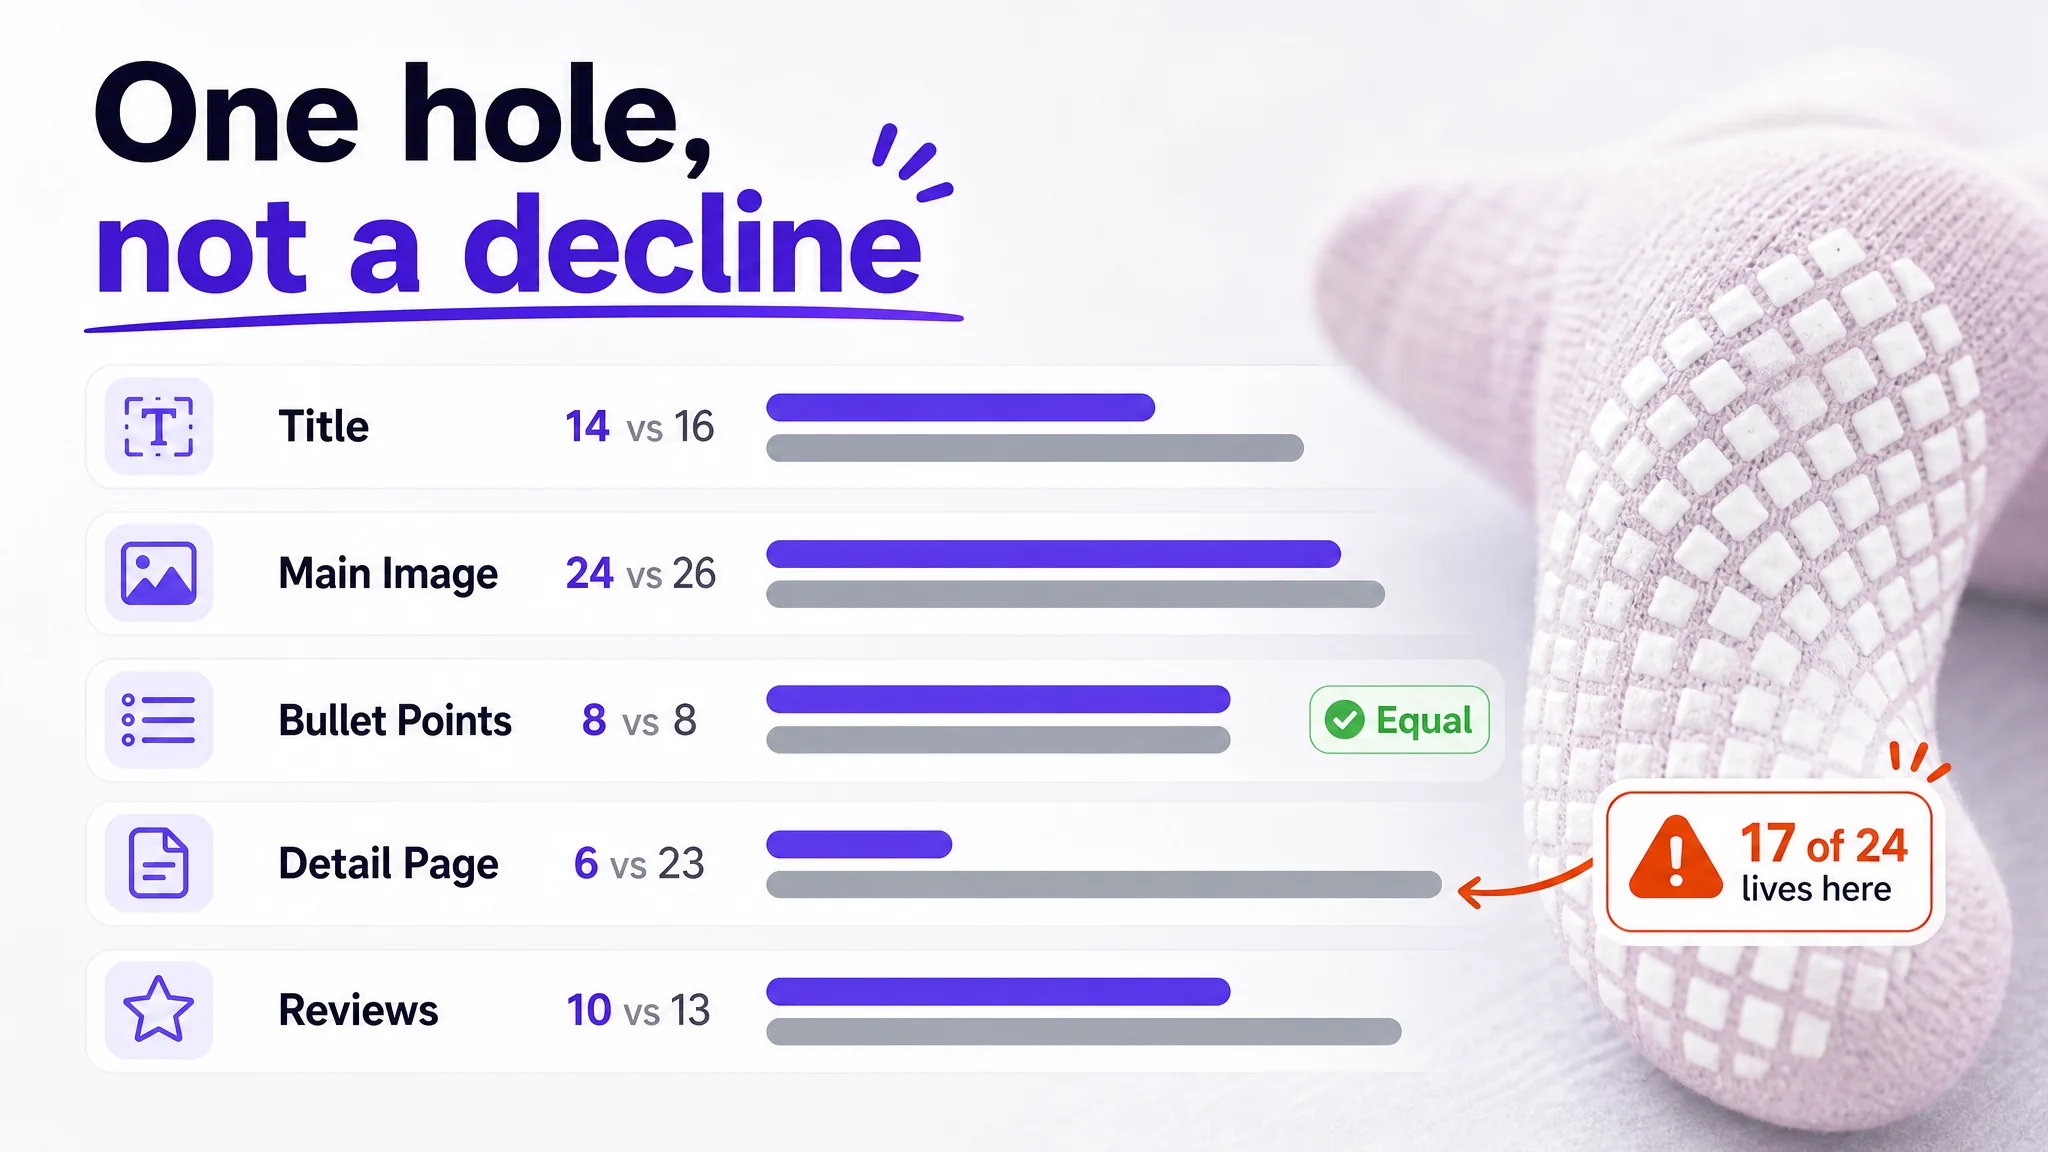
The grip-socks listing shows why that constraint matters. The useful comparison was not the category leader by review count; it was a benchmark chosen within the same product form, use case, and price band. Against that peer, the target listing scored 62 out of 100 versus 86. The 24-point gap did not become useful as a general verdict that the page was "bad." It became diagnostic only after the comparison was narrowed and the gap was broken into modules. A broad benchmark can tell you that something is behind; a similarity-constrained benchmark can tell you where the lost points actually sit.
Is Your Amazon Conversion Rate Good or Bad?
A single conversion rate figure is a weak verdict. The same CVR can be healthy on high-intent branded traffic and poor on broad, low-intent traffic. Before labeling a listing good or bad, diagnose the conditions behind the number.
- Traffic quality: Separate branded, category, competitor, and broad-match traffic. Low-intent traffic can depress CVR without proving the listing is weak.
- Listing-audience fit: Check whether positioning, target audience, and selling-point priority match the searcher’s intent.
- Price and reviews: Compare within the same price band and review base; both shape trust and conversion.
- Stock and seasonality: Stockouts, delivery risk, and seasonal demand shifts distort CVR. Treat these as external checks, not automatic scores.
- Internal trend: Judge against the listing’s own baseline and recent slope, not a fixed benchmark.
Competitor context is useful only when the benchmark shares product form, price band, audience, and use case. Bestseller-only comparisons often mislead.
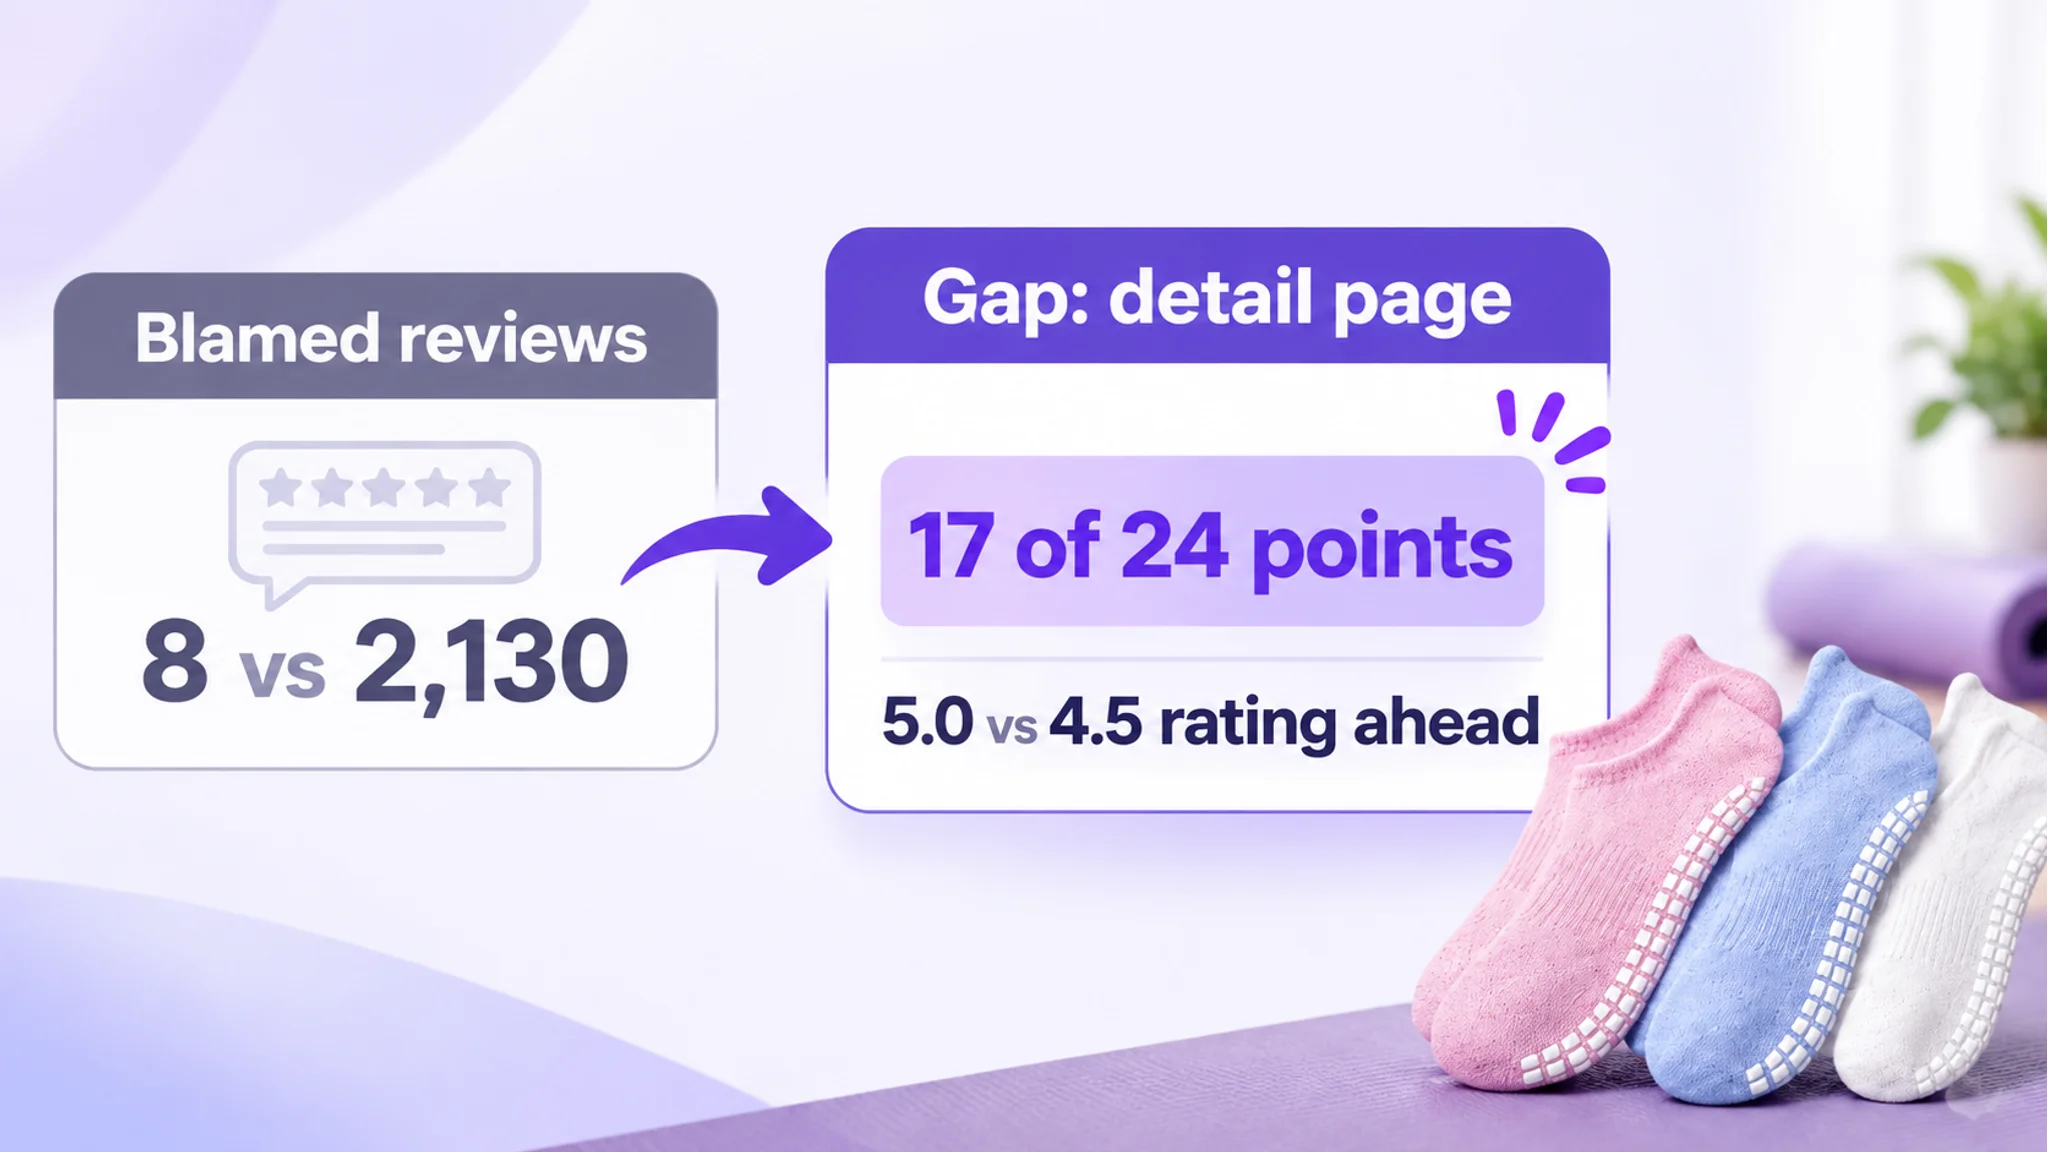
The grip-socks team arrived with a verdict already written: the listing had eight reviews, a category-leading competitor had more than two thousand, and the weekly review count barely moved while the advertising bill did. The conclusion inside the team was that the page was not trusted enough, so ads were doing work that reviews should have been doing. Fix credibility, and conversion would follow.
The rating told a different story. The target listing held a 5.0 star rating with no three-star-or-below reviews on the first page. The benchmark listing sat at 4.5 with a visible low-star review in the same position. On the dimension the team thought was broken, the target listing was ahead. It lacked scale and texture — verified-purchase reviews, photo and video content, helpfulness votes — but those are slow variables. Nothing on the product page accelerates them in a meaningful window. The urgent constraint was elsewhere: the detail page alone accounted for 17 of the 24-point gap. That is the difference between a condition check and a verdict. Review scale was a real liability, but it was not the thing this month's page work could move.
Treat conversion as an ongoing learning metric: after listing changes, watch the slope in CTR, CVR, and order volume. Conversion can support visibility, but ranking remains multi-factor; do not attribute ranking movement to CVR alone.
DeepBI multi-dimensional scoring and diagnosis audits main image, title, bullets, A+ content, and voice-of-customer feedback against similar benchmarks. It attributes score gaps to specific visual or text modules and cross-checks them with impressions, clicks, orders, CTR, and CVR. Use it to identify weak points and prioritize fixes, not as a ranking guarantee.
10 Amazon Listing Conversion Best Practices
Ten listing conversion practices converge on one principle: remove the friction a shopper meets between a search result and a confident add-to-cart. Competitor layout gaps tell you where the friction is worst; your own internal baseline — CTR, CVR, ACoS, and listing cycle time — tells you whether a fix worked.
The order matters. In the grip-socks listing, the page had a 17-point detail-page hole while the bullet points were already level with the benchmark. The work was not a burst of fixes across every module. It was a sequence built around where the score gap was concentrated.
#1 Optimize Your Listing UX (the Amazon Equivalent of Website UX Design)
Treat the listing as a page with layout, hierarchy, and information flow, not a stack of fields. A diagnostic score report should attribute each lost point to a specific visual module or a broken text logic, so the fix is a named element rather than a general instruction to "make it better." Benchmark against competitors filtered by similar product form, price band, audience, and use scenario, and use DeepBI layout-gap diagnosis to rank which gap to close first — copying a bestseller outside your comparison set usually misallocates effort.
The grip-socks score report was uncomfortably specific: title 14 vs 16, main image set 24 vs 26, bullet points 8 vs 8, detail page 6 vs 23, and reviews 10 vs 13. A 24-point gap sounds like a page that is broadly behind. It was not. It was one 17-point hole and a handful of small ones. That concentration changed the work order. The detail page moved first; the title needed correction second; the bullet points were already competitive and rewriting them would have consumed a week while moving nothing. A diagnostic report that only says "improve the listing" hides exactly this distinction. The named module is what makes the fix operational.
#2 Streamline the Purchase Path (Checkout Flow on Amazon)
What you control is the listing-side path: variation clarity, price and promotion transparency, and no dead ends where a shopper has to guess which configuration applies. Every ambiguous variant label or unexplained bundle is a decision the shopper must resolve alone, which is friction right before add-to-cart. Review it by tracking CVR by child ASIN against your baseline rather than by changing layout on instinct.
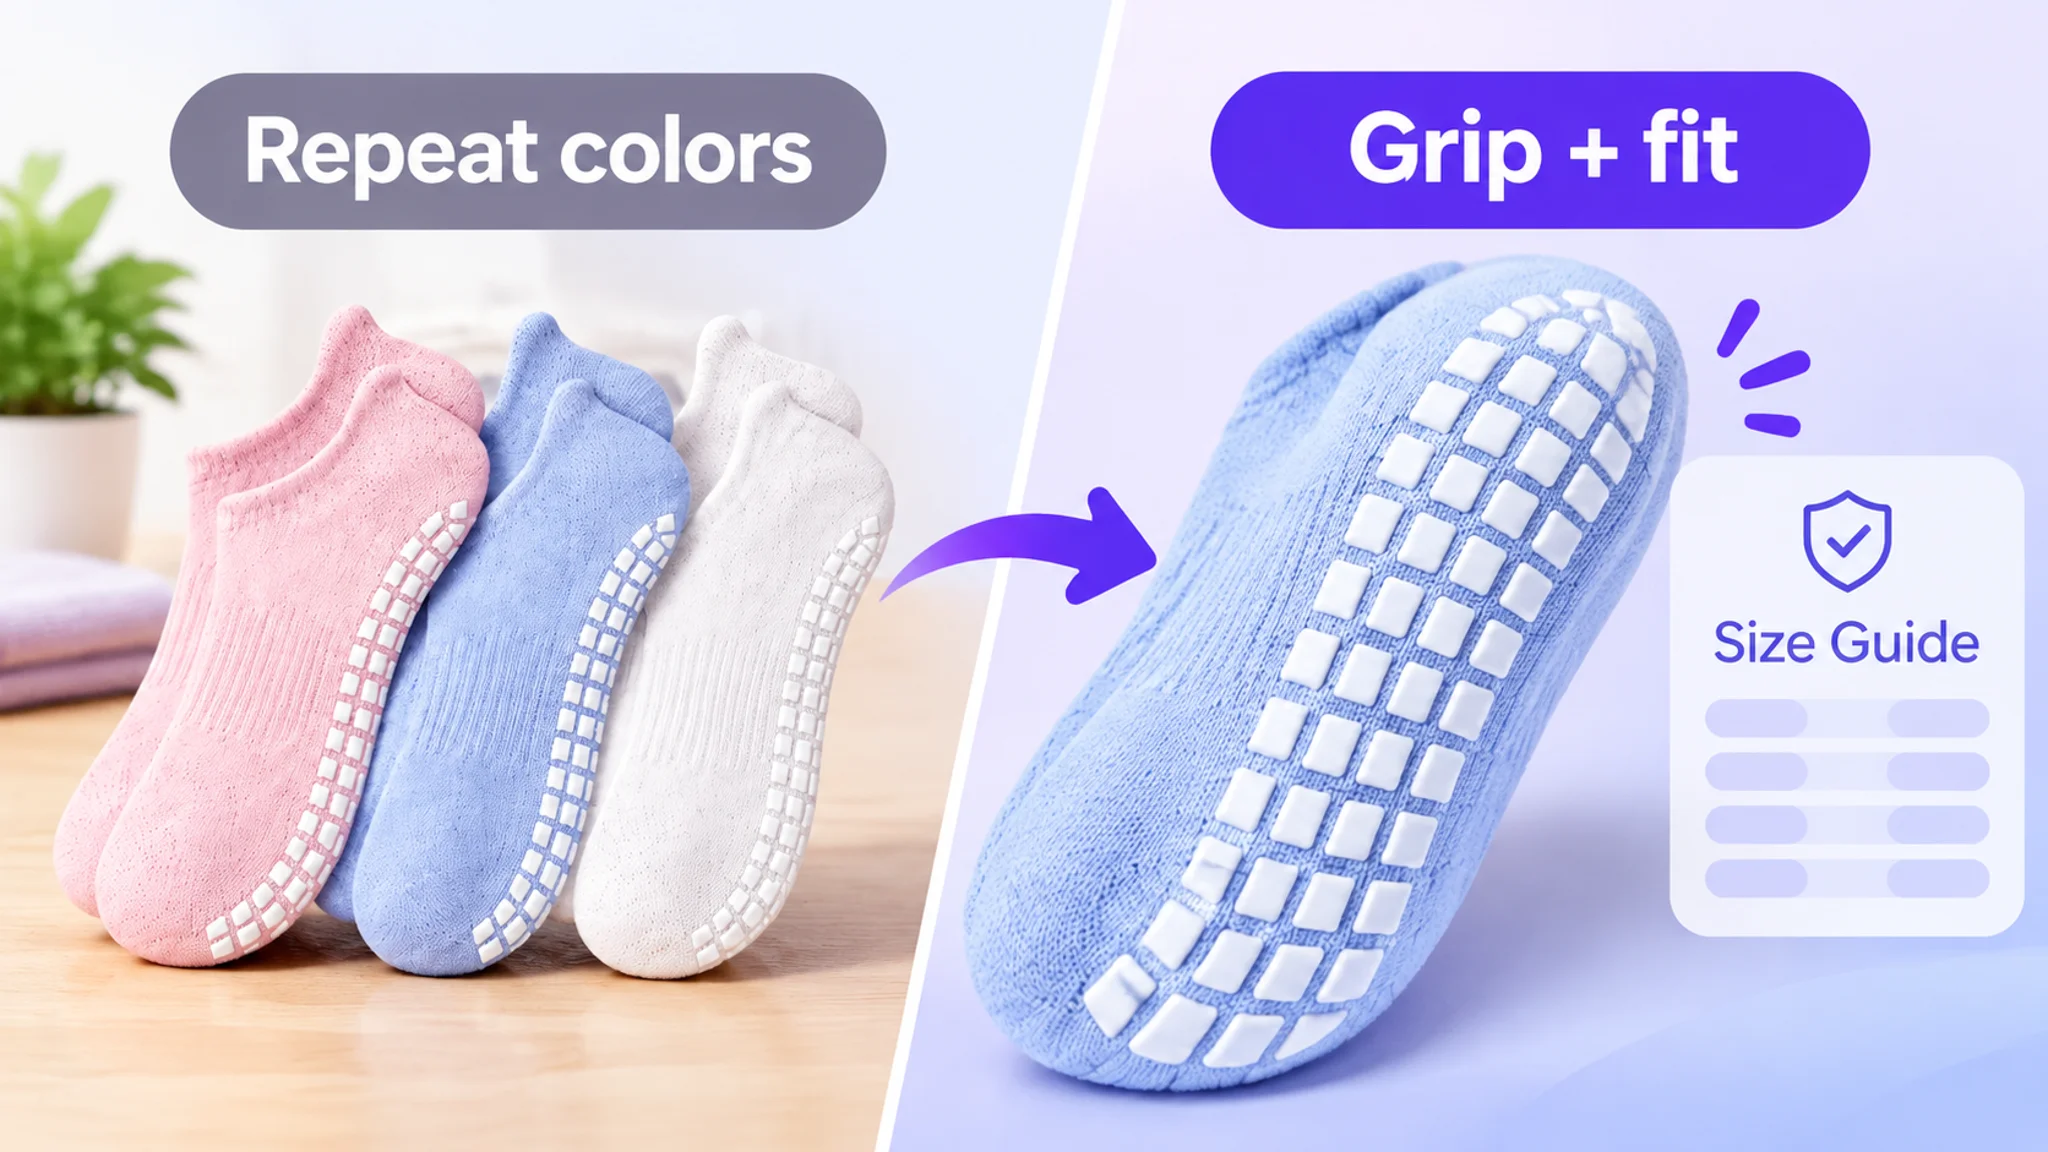
In the grip-socks listing, the final hesitation was fit. The main image sequence spent its last slot on color options rather than sizing. The benchmark listing used its later image slots for a structural close-up and a size chart. That is purchase-path friction in its practical form: the buyer has to resolve a fit question elsewhere, at exactly the moment the listing should be closing it.
#3 Use High-Quality Product Images
Generate images under a locked Product DNA map so composition, lighting, scene, mood, and visual hierarchy can change while product geometry, material, logo, and functional structure stay true. This matters because a drifting image creates product-image mismatch, which surfaces later as negative reviews and refunds — a post-sale cost, not a creative preference. Benchmark competitor imagery as a visual ceiling for mood and composition only, never for their product details or patented structure, and check the set for image-type diversity and visual quality.
The grip-socks main image gap looked small on paper — two points. The behavior behind it was more serious. Two of the five image slots returned to the same subject: quantity and color. The third slot used a meditation scene, which asks almost nothing of a grip product's performance. The final slot, where a buyer in this category typically resolves the last objection, was spent on color options rather than sizing. Meanwhile the benchmark listing used its later slots for a structural close-up and a size chart. The issue was not that the images were ugly. It was that the image sequence had not been designed as an objection-clearing chain. The buyer's two real questions — will these grip on the surface I use, and will they fit — were left for the copy to answer.
#4 Improve Product Descriptions, Titles, and Bullets
Restructure titles to brand + core selling point or result promise + product form + modifiers, strip repeated modifiers, and absorb high-click competitor terms within the character limit. Rebuild bullets as pain-point/solution loops: category concern, then how the benchmark expresses it, then your structure — replacing bare specifications with a named selling point, its data support, and the problem it removes. Judge the rewrite on CTR movement in search and CVR on the detail page, not on how complete the copy looks.
The grip-socks case is a useful warning against rewriting by instinct. The bullet points were level with the benchmark at 8 vs 8. They were already competitive on information coverage and readability. Rewriting them would have produced the feeling of progress without the substance of it. The title was a different matter: the brand term was missing, the core phrase was not held together contiguously, and the quantity signal sat at three pairs against the benchmark's six — a difference that changes the value read before a click even happens. The point gap was only two, but the cost was durable. That is why title work matters even when it does not look like the loudest problem on the page.
#5 Use Reviews as Social Proof and Listing Inputs
Review language is the cheapest evidence of where the listing fails to answer a real question. Feed review data into the listing score as an input, then move the recurring objection into the bullet or image where the shopper first meets it. The measure is whether CVR rises on the pages where you relocated that objection, checked against the same internal baseline.
The grip-socks listing had eight reviews against the benchmark's 2,130. That gap was real and uncomfortable. But the target listing's 5.0 rating was stronger than the benchmark's 4.5, and it had no three-star-or-below reviews on the first page. The weakness was scale and texture — verified-purchase reviews, photo and video content, helpfulness votes — not the rating itself. Those are slow variables. The team could not compress them inside the current optimization window. So the sequencing decision was to leave review scale where it was and stop asking the page copy to compensate for a problem the page could not solve. Review scale is a genuine asset or liability, but it should not automatically set the priority order for this month's work.
#6 Design for Mobile Shopping
Design the first screen for the smallest viewport: one dominant image, a title that survives truncation with its promise intact, and bullets whose first words carry the point. Friction on mobile is usually density — text that is technically present but unreadable at thumb scale. Compare mobile-weighted CTR and CVR against your baseline before and after the change.
#7 Reduce Friction and Content Weight
Replace vague direction such as "improve the texture" with parameterized instructions covering composition, camera angle, light distribution, scene elements, and color tone. Ambiguity is friction inside your own workflow as much as on the page: vague briefs produce rework and stretch listing cycle time, while parameterized briefs convert strategy into executable design specifications. Trim redundant modifiers and low-value content that dilute the shopper's scan path.
The grip-socks detail page is what content weight looks like when it sits in the wrong place. The A+ area was text-only: no module imagery, no material close-up, no size or care reference, no scenario validation. The customer's claims about 67% cotton speckled yarn, custom matrix silicone grips, arch compression, and a cushioned terry sole were accurate — and all unverifiable at a glance. A detail page with no visual layer is not a short page. It is an unfinished one. It removes the only part of the page where an already-interested buyer can stop reading and start believing. The benchmark listing ran nine full-width modules: brand visual, multi-color display, size and care reference, material close-up, and a chain of use scenarios spanning studio work, recovery, pregnancy, and home. Whatever a skeptical buyer wanted to check, there was a picture for it. The target listing asked the same buyer to take the copy's word for it.

#8 Set Clear Delivery, Returns, and Availability Expectations
State fulfillment method, delivery window, return terms, and stock status in plain terms on the listing itself. A shopper who discovers a mismatch after purchase does not churn quietly — they leave the review or request the refund, and both register on the listing. Track whether CVR holds while return and negative-review indicators stay flat.
#9 Test Changes Sequentially Without Overclaiming A/B Testing
Change one measurable listing element at a time, apply it through DeepBI one-click SP-API sync, and compare versions against your stored baseline. This is sequential change with version comparison, not A/B testing — claiming split-test certainty from a single replacement overstates what the data supports. The operational gain is concrete: an upload routine that once meant downloading, renaming, and uploading assets one by one is reduced to seconds.
The grip-socks team's default move when conversion softened was always the same: tighten campaign structure, retune bids, prune search terms, push more budget at the best-performing keywords. That work is legitimate. It is also neutral against a page that cannot close. The recommendation was not "stop advertising." It was a sequencing decision: fix the page's ability to convert first, correct the title's weighting second, leave the bullet points mostly alone, and keep review scale out of this cycle. Every point of conversion capacity added to the page raises the return on ad spend that already exists. Every dollar of ad spend added to a page without that capacity raises the cost of learning nothing new.
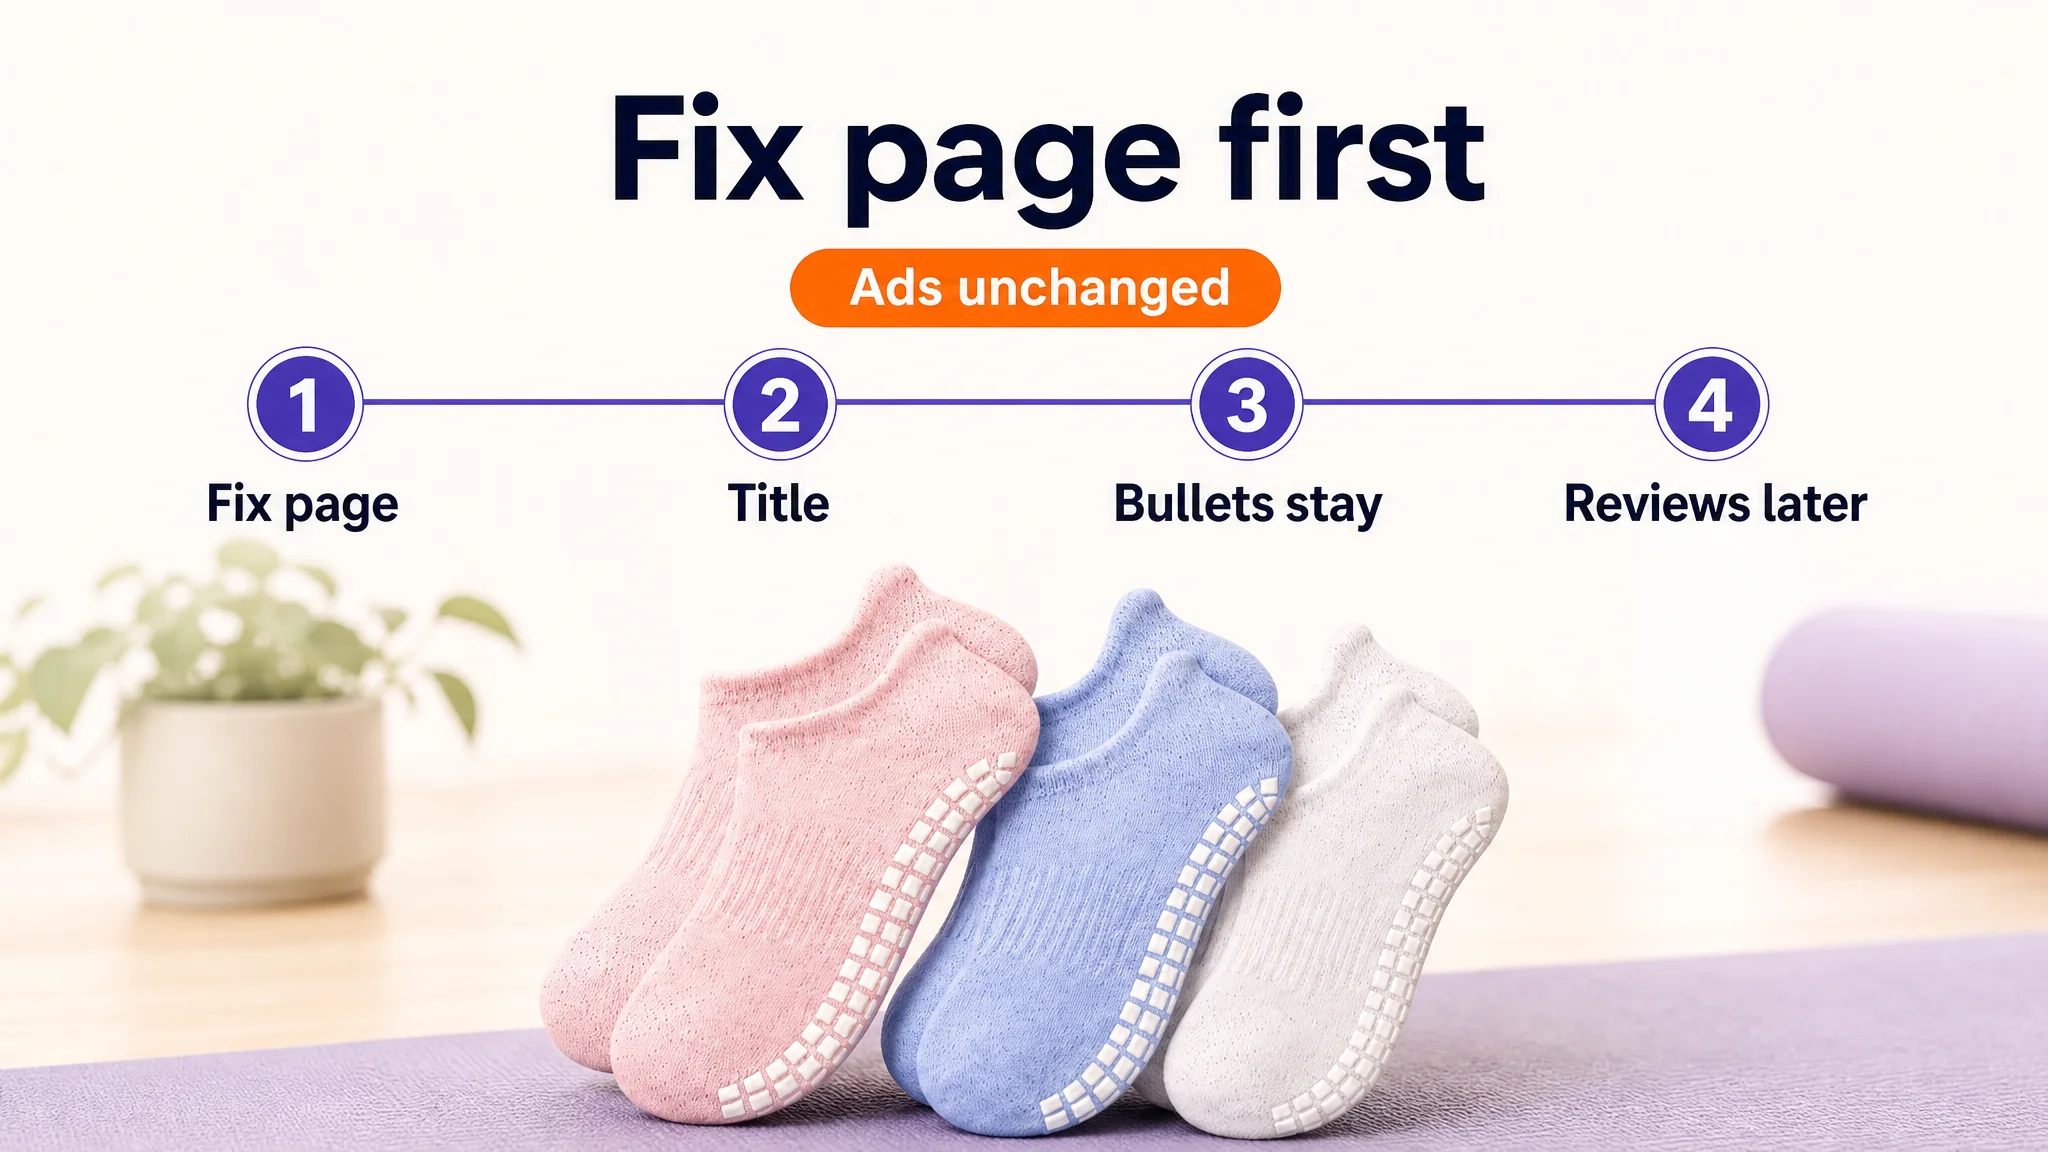
There was a second reason for that sequence, and it was about risk rather than efficiency. At the point of diagnosis, the store's traffic structure was leaning hard on paid. Paid traffic was arriving at a page that could not build trust quickly, which meant the paid share had to keep growing just to hold order volume flat. That structure gets more fragile the longer it runs — cost per order climbs, organic share erodes, and operating margin gets thinner while the dashboard still looks busy. Repairing the page was the only move available that could reduce dependence on that structure instead of deepening it.
#10 Offer Responsive Pre-Purchase Support
Every pre-purchase question a shopper has to send is friction you failed to remove on the page. Answer the recurring questions in the bullets, comparison content, and image set, and keep a human response process for the rest so unanswered threads do not become abandoned carts. Watch the question volume and the CVR of the pages where those answers were added.
For the grip-socks listing, the recurring pre-purchase question was fit. Moving size verification into the image chain and A+ content was not a cosmetic edit; it was a way to answer the question before it became a message to support. The non-sporting scenarios — recovery, pregnancy, household surfaces — did similar work by widening the buyer's sense of where the product belonged. The page stopped waiting for the shopper to ask and started answering at the point of hesitation.
Conversion Optimization Guardrails: What Not to Overclaim
Conversion optimization rewards discipline more than confident claims. Each shortcut below feels useful in a report, yet it distorts the decision it is meant to support.
- Benchmark absolutism. A CTR or CVR threshold is a context-bound diagnostic trigger, not a target. Treating it as a universal pass mark pushes teams to chase a number instead of a cause.
- Sessions versus unique buyers. Orders divided by sessions is a session-level ratio; it does not describe per-person behavior. Reading it as buyer-level conversion overstates precision.
- Conversion as a ranking guarantee. Ranking is a system outcome shaped by many inputs. Frame listing changes as hypotheses and judge them by measured movement in CVR, ACoS, and BSR.
- Checkout and page speed. Image-asset sync and compliance checks do not extend to Amazon checkout or site performance. Claim credit only for the elements you actually change.
- A universal middle price. Filtering extreme-price outliers when selecting benchmarks is supported; prescribing one price band for every catalog is not.
- Review automation and A/B testing. Neither the platform nor the tools described here provide automatic review replies or split-test infrastructure. Promising them sets expectations that cannot be met.
The grip-socks diagnosis is a guardrail example in itself. A 24-point gap sounded like broad failure, but it was one 17-point hole and a handful of small ones. Equal scores are a decision, not a footnote: the bullet points matched the benchmark, and that single line saved a week of copy work and kept attention on the detail page. Knowing what not to touch is as valuable as knowing what to fix. Review scale was another guardrail. A 5.0 rating against a competitor's 4.5 was a genuine asset; eight reviews against two thousand was a genuine liability. Neither fact told the team what to do this month.
What to do instead: name your comparison set, state the metric you intend to move, and report the measured effect after publishing. Tagging the publish event in ad reports lets you tie a visual change to CTR movement rather than assert it.
A Practical Priority Order for Listing Conversion Work
Optimization works better as a sequence than as a burst of fixes. Define the metric first—CTR, CVR, or listing cycle time—and record a baseline before changing assets. DeepBI diagnosis can audit the main image, title weight, five-bullet logic, A+ fullness, and voice of customer, then show where the score gap sits rather than only a total score.
The grip-socks listing shows why the order matters. The detail page was a 17-point hole. The bullet points were level. The title had a small but durable gap. Review scale could not be compressed. The work order followed that concentration, not the loudest symptom. The team did not start with ads, and it did not start with a full rewrite. It started with the module that was actually dragging the listing down.
- Run a competitor layout gap review: use DeepBI competitor benchmark to find a stronger similar ASIN, then compare visible title keyword layout, bullet pain-point coverage, image count and type mix, A+ modules, and review trust signals.
- Fix above-the-fold clarity and images before deeper copy: check composition, information density, scene emotion, and missing image types.
- Tighten the title with brand + core selling point + product form + modifier, and make each bullet close a pain-point-to-solution loop.
- Improve A+ content and mobile scanability with modular sections; address purchase-path anxiety with visible trust signals and clear answers.
- Use DeepBI strategy generation and AI image-text generation to turn findings into specific changes, then one-click sync them to the listing.
- Test one layer at a time and review the same baseline metrics before moving on.
Conclusion: Build a Listing That Earns the Click and the Conversion
A listing that converts is rarely the busiest one on the search results page. It is the one that answers a shopper's question fastest and leaves the fewest reasons to hesitate.
- Define before you act: confirm what Amazon listing conversion actually measures — units ordered divided by sessions — so every later change is judged against a real number rather than a feeling.
- Set context: compare against your own historical baseline and a comparable peer set before borrowing any external average.
- Diagnose with evidence: trace a CTR or CVR gap to a specific module — main image, title, bullets, A+ content, or review themes — instead of patching everything at once.
- Reduce friction: tighten above-the-fold clarity, simplify the hierarchy, and cut content weight that competes with the purchase decision.
- Learn sequentially: change one variable at a time, record the date, and hold the result against a stable baseline through seasonality and traffic shifts.
The grip-socks listing did not leave the team with a growth number to announce. It left them with a cleaner read on where the store's constraint actually lived — and a page that no longer asked advertising to compensate for an argument it had never finished. That is the practical value of the loop: definition, context, diagnosis, friction reduction, and sequential learning. It separates a decorated page from a decisive one. The best listing is not the most decorated; it is the clearest path to purchase, where the visual hook earns the click and the information carries the shopper to checkout. Diagnosis and execution are most valuable when they serve this loop, converting visible gaps into prioritized, one-at-a-time changes.