


What Is Your Amazon Listing Conversion Rate?
Amazon’s unit session percentage is a native conversion metric: units sold divided by sessions, multiplied by 100. Both inputs come from seller-side business reports, so the number is auditable rather than inferred from ads or search results.
Units and orders are not interchangeable. If a shopper buys three units in one order, the unit session percentage counts three in the numerator while an order-based conversion rate counts one. Same traffic, different verdict. That is why conversion can look weak under one definition and acceptable under another.
Keep the formula direction explicit: conversions go in the numerator; sessions, visitors, or impressions go in the denominator; multiply by 100. Reversing it—impressions divided by purchases—produces a cost-like ratio, not a percentage, and should not be read as conversion.
A hypothetical arithmetic illustration: 1,000 sessions producing 120 units equals 12% unit session percentage. This is arithmetic only, not a benchmark.
Multiple conversion definitions can legitimately coexist when each is tied to a stated business goal—unit session percentage for listing productivity, order-based conversion for basket behavior, or CVR for ad diagnostics. The denominator must match the decision being made. DeepBI's listing scoring and diagnosis connects this metric to the specific listing inputs that move it — main image, title, bullets, A+, and rating structure treated purely as a scoring input.
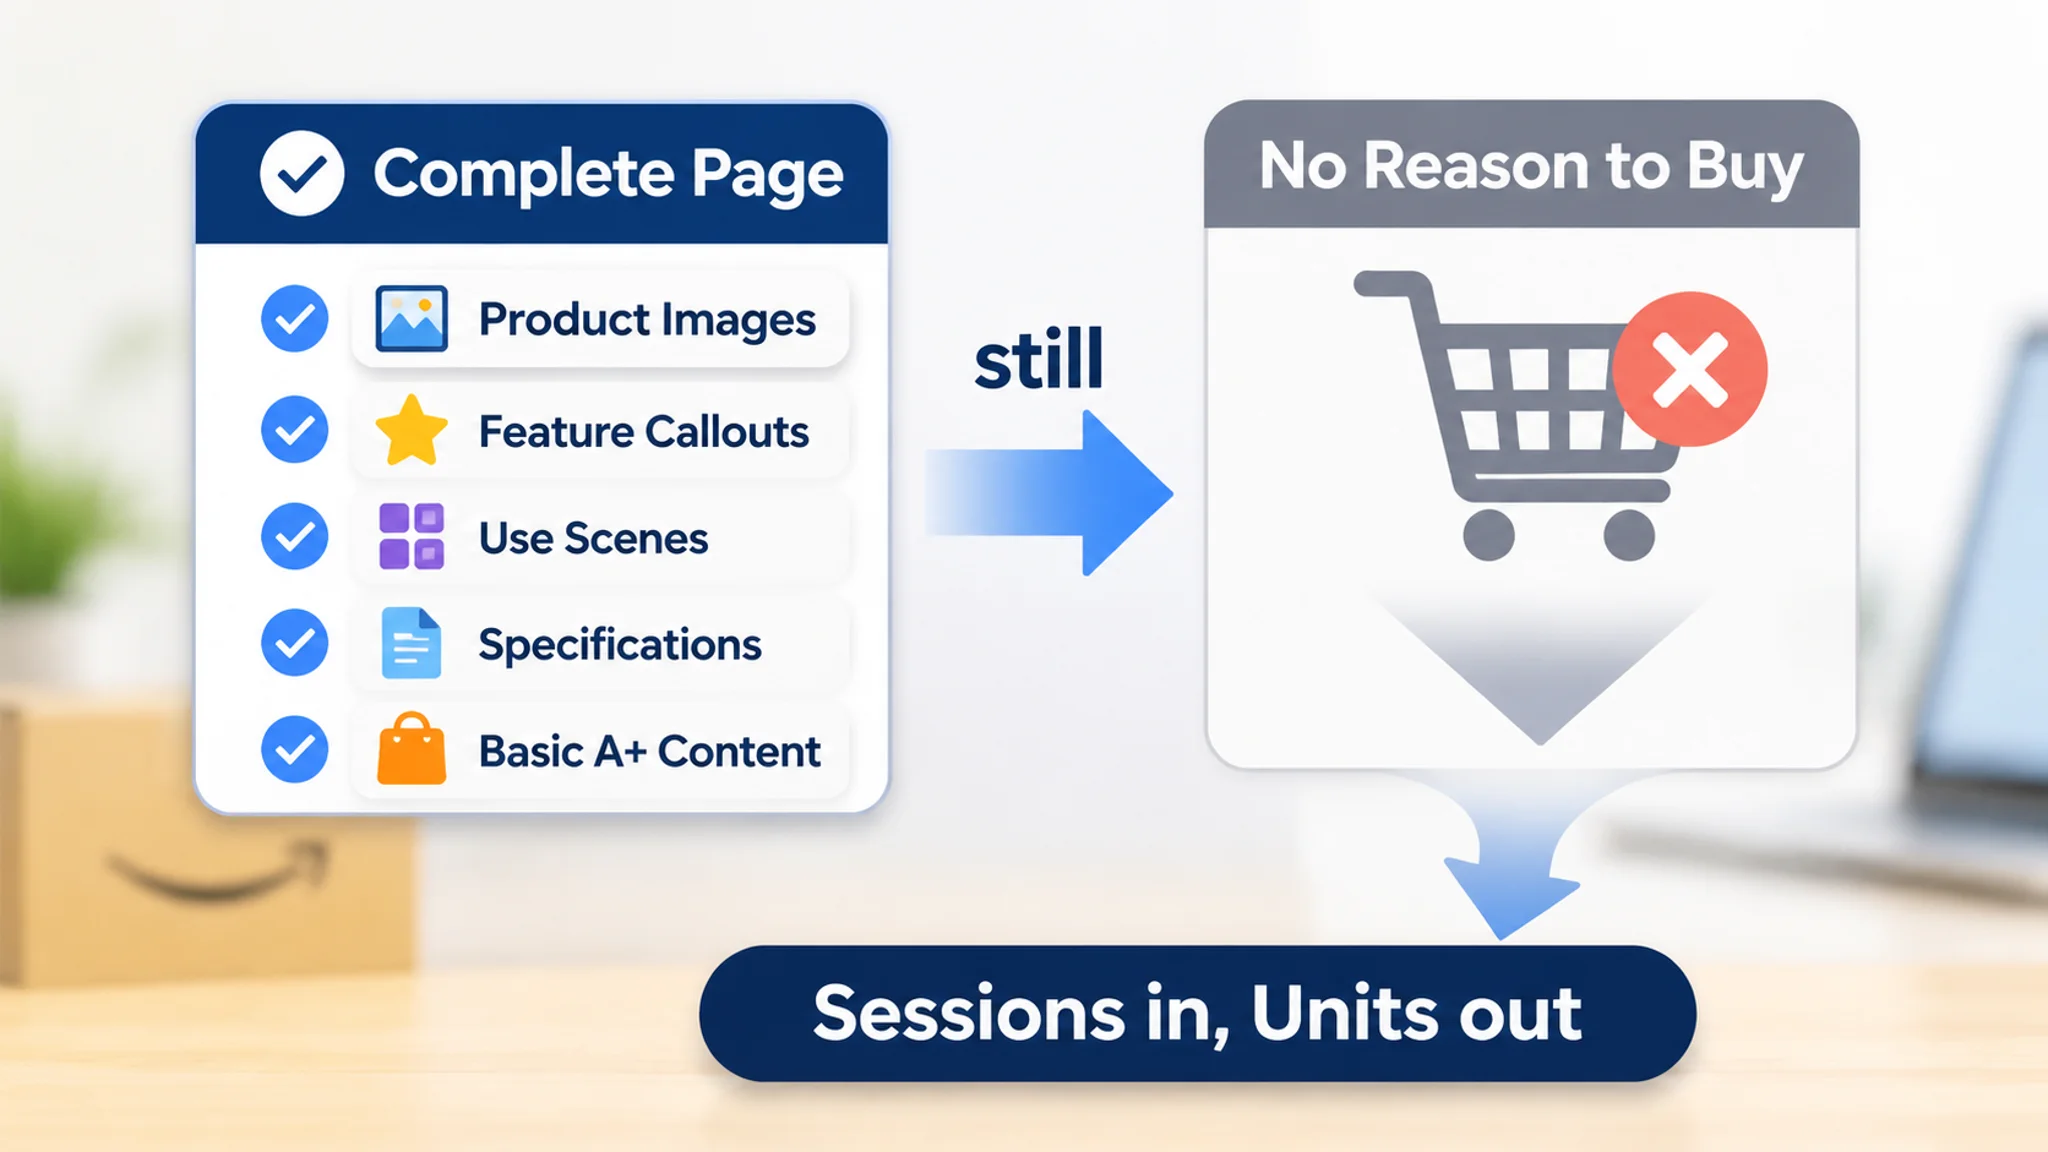
One school and craft supplies listing is a useful reminder that the metric is an output, not an inventory of content. The page had packaging images, feature callouts, classroom, home, and office scenes, specifications, and basic A+ content, so it looked complete on the surface. The seller’s first instinct was to add more information, repeat the purple-color feature more clearly, and expand usage scenarios. DeepBI’s diagnosis instead found a weak conversion path: the title did not establish enough relevance or trust, the image sequence repeated rather than progressed, A+ lacked persuasive depth, and the listing had no meaningful review-based social proof. In metric terms, sessions were not being converted into units because the page had not earned the buyer’s confidence. That is why the unit session percentage should be read as a result to diagnose, not as a content checklist.
How Does Your Conversion Rate Compare to the Average?
No universal conversion benchmark applies to every seller. Sector-level context can still be useful, but only when read alongside traffic mix, pricing, and purchase type. A listing that looks weak against a broad number may be normal for its price band or purchase cycle; a listing that looks strong may be benefiting from unusually warm traffic.
Third-party panel estimates of Amazon unit session percentage commonly land in a rough 10–15% band, but that range is an estimate shaped by category, price, traffic source, and marketplace — it is not a target. The frequently cited 2.5–3% general e-commerce figure is rough context only. Methodology and category change the comparison so much that it cannot settle whether your CVR is healthy, and it should not be read as proof that Amazon automatically outperforms other channels. These figures come from aggregated seller-level panel data whose panel composition, attribution rules, and cleaning choices the reader cannot audit.
A relevant peer comparison is more actionable than a marketplace-wide average. In the same school glue stick category, DeepBI’s benchmark comparison scored the seller’s listing 62/100 against a close competitor’s 89/100. The gaps were not uniform: title 13/20 vs 17/20, main image 24/30 vs 27/30, bullets 6/10 vs 7/10, detail page and A+ 17/25 vs 24/25, and reviews 2/15 vs 14/15. The exercise did not prove a marketplace-average verdict. It showed where a close peer was winning the decision: trust depth, A+ persuasion, and review evidence. That is the right use of a benchmark—to frame the next diagnosis, not to declare a universal target.
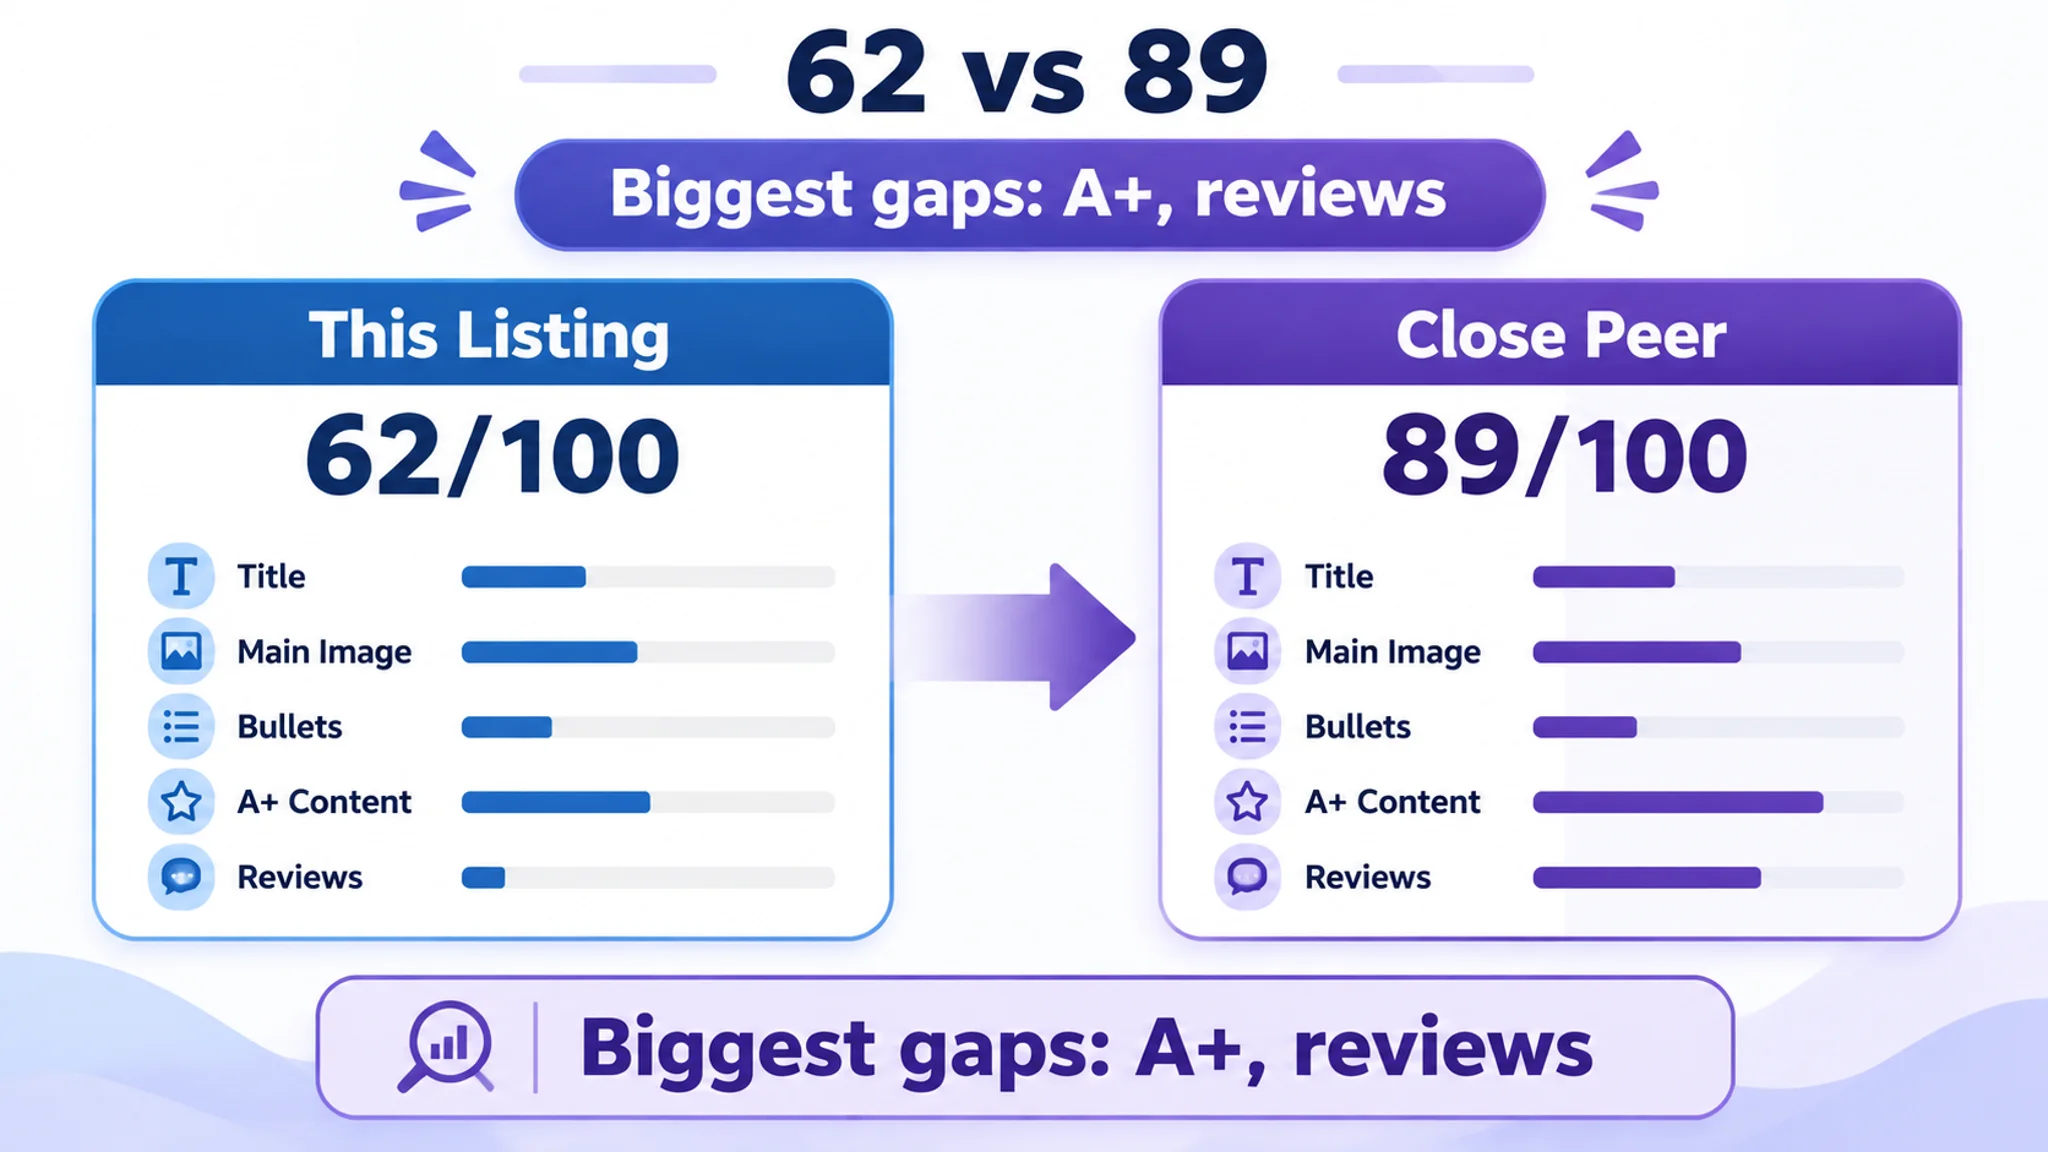
Use benchmarks to frame a question, not to deliver a verdict. Because conversion can differ by traffic source, split paid and organic sessions before concluding anything; DeepBI’s ad quant layer exists to evaluate paid traffic separately from organic.
Is My Conversion Rate "Good" or "Bad"?
A conversion rate cannot be judged in isolation. A global verdict — "good" or "bad" against a marketplace average — hides the variables that actually explain CVR. A defensible answer comes from applying four filters one by one.
- Product category. CVR baselines differ by category, so the relevant comparison starts inside the product's own category, not across the whole marketplace.
- Price band and consideration level. Within one category, a low-price impulse item may convert at a higher rate than a higher-price considered purchase. Treat that as a directional contrast, not a precise percentage benchmark, and do not compare across extreme price bands.
- Traffic source. Organic search, paid, deal, and external traffic should be read separately. A gap between organic and paid conversion is a hypothesis to test in first-party data, not proof that one traffic type is more trustworthy.
- Purchase commitment. A repeat or consumable product can show different CVR behavior from a one-off high-ticket purchase; the verdict must reflect which buying pattern the listing serves.
The four filters also protect against a common misdiagnosis. A listing can look complete and still be weak at the decision point. In the school glue stick case, the seller initially treated the problem as an information-quantity issue: add more specifications, repeat the purple-color feature, and show more scenarios. But the competitive gap was concentrated in A+ depth and reviews, while the title and image sequence were not moving the shopper through a clear decision order. The four filters do not replace that diagnosis; they tell you which comparison set and funnel signal to inspect before deciding that a CVR number is "bad."
Then compare the result with your own trailing trend and a small set of close competitor ASINs — similar product form, price band, and audience — rather than a marketplace-wide average. DeepBI's competitor benchmark builds a comparison set from competing ASINs so the verdict rests on a relevant peer group instead of a marketplace-wide average.
Finally, keep the claim proportional: do not assume that a one-point conversion gain reliably shifts several ranking positions. Use the four-filter verdict to decide which funnel signal to investigate, not to promise a ranking jump.
Why Amazon Listing CVR Is Not General Ecommerce CVR
A seller who carries a storefront benchmark into Seller Central will misread the number. Amazon traffic is largely purchase-intent traffic: sessions arrive from search results, ads, and recommendation rails with the shopper already narrowing toward a buy. That shortens the funnel — fewer sessions are spent browsing for inspiration — so each session carries more weight, and a conversion rate that looks unremarkable against a general storefront can be a real commercial problem here.
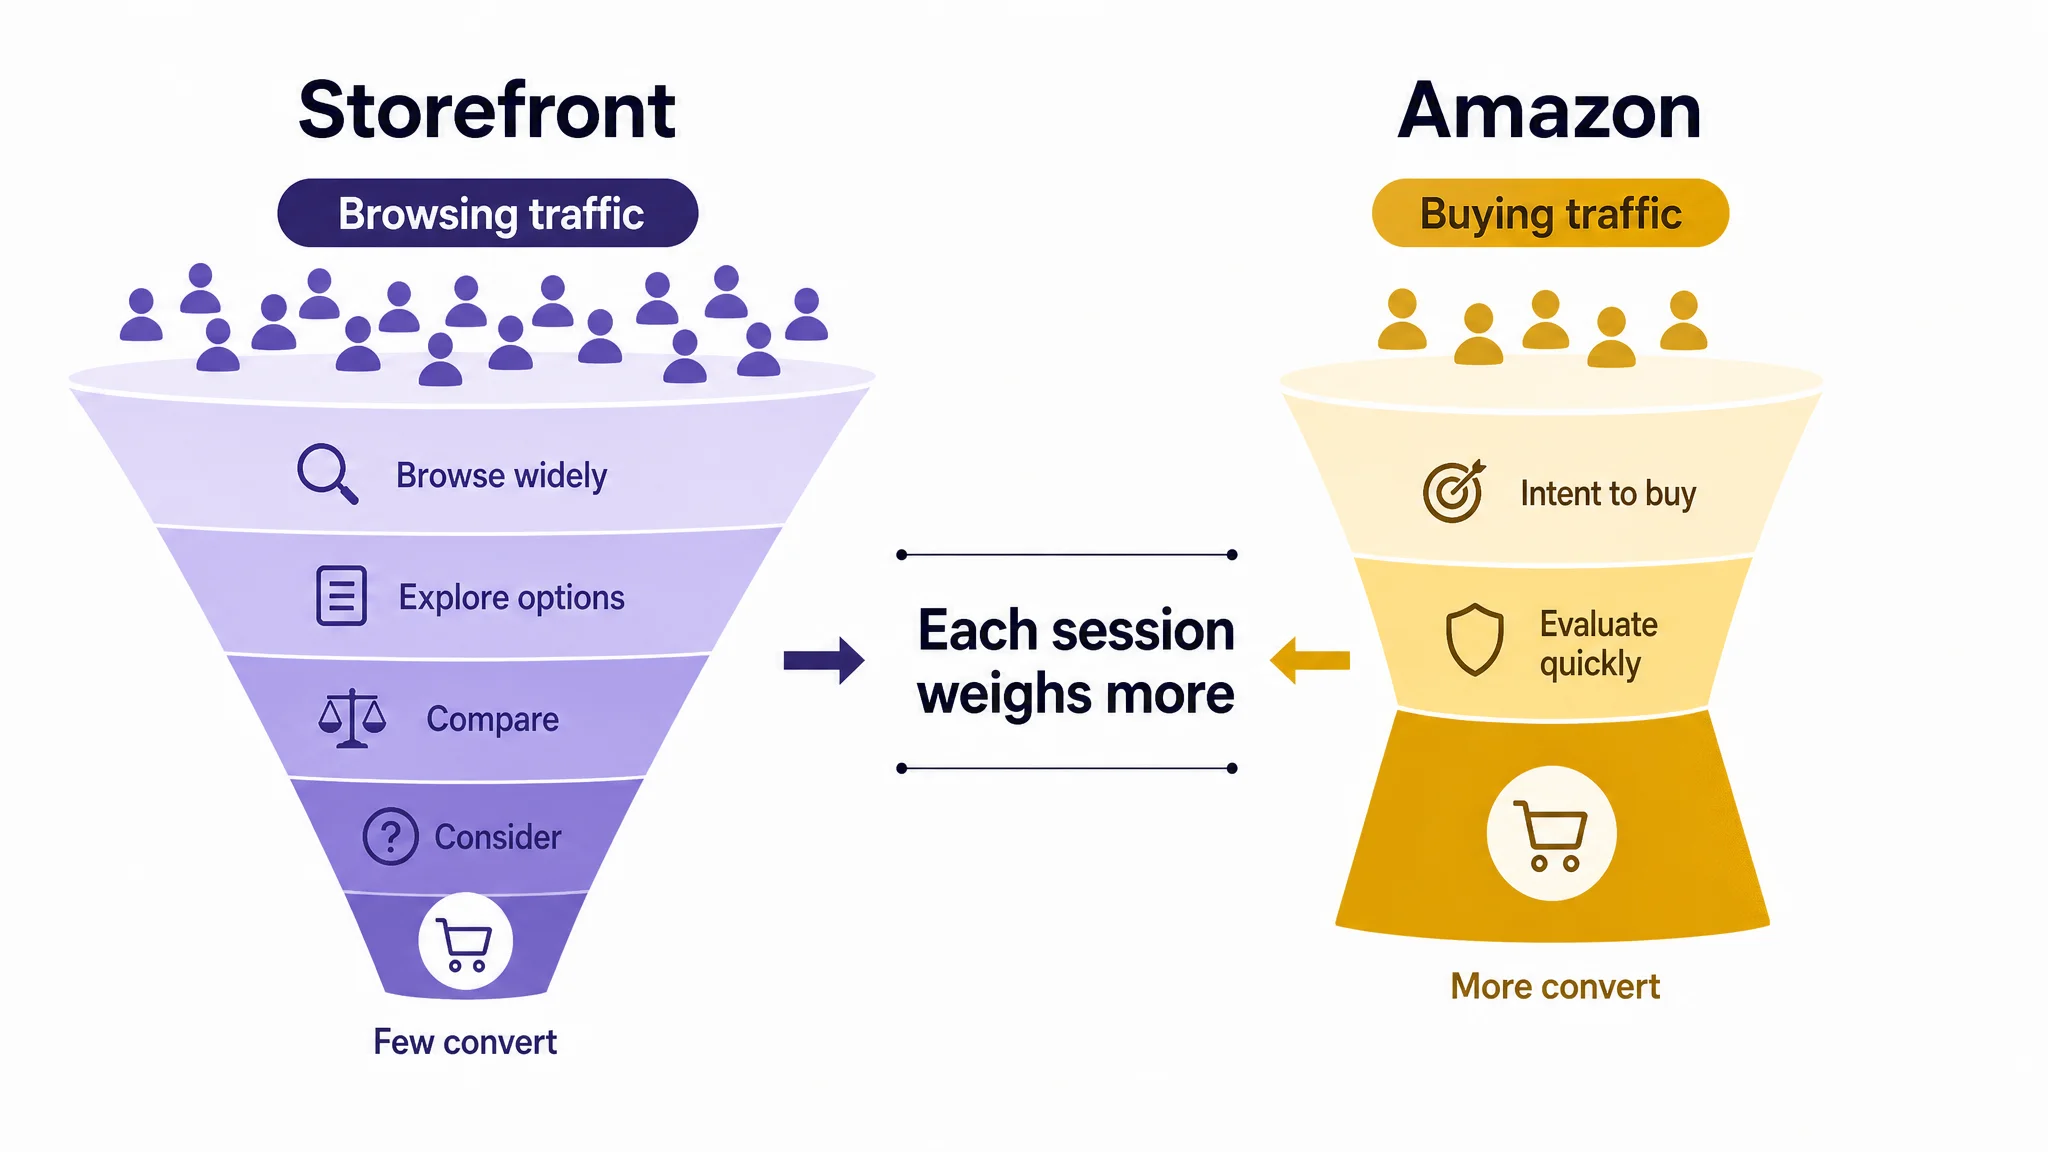
Trust and logistics sit inside the decision rather than around it. Delivery promise, return terms, and price clarity are read in the same glance as the main image and the opening of the title, so a weak promise converts as a lost order, not as a follow-up question.
The school glue stick listing shows why. It had images, feature statements, usage scenes, specifications, and basic A+ modules, yet the page did not consistently move the shopper from recognition to confidence. The title used broad functional language such as "all purpose" and "classroom, home, office" instead of concentrating the core phrase "disappearing purple school glue sticks" near the front. The image sequence repeated the purple-application message instead of assigning each image a new decision job. The A+ content was present but lacked persuasive depth. And there was no rating, review count, or visible customer commentary on the first page, against a benchmark with a 4.8-star average and more than 32,000 reviews. On a purchase-intent marketplace, that is not a minor content gap; it is a trust gap inside the purchase decision.
Attention is also mobile-first. Much of the session happens on a small screen, where image, price, badge, and the first lines of copy compete for a few seconds. Judgement is fast and shallow, and a CTR gain that lands on a page built for desktop reading simply hands the problem to CVR.
Then there is the ranking layer. Conversion is one input among several, and improving it can support visibility indirectly through sales velocity, but the exact effect is not published and cannot be predicted. Best Sellers status and recommendation placements are settled by sales rank against competitors, not by a high conversion rate alone.
This playbook reflects how Amazon shopper behavior and listing conversion levers are evolving right now, so treat it as a working position to re-test against your own CTR, CVR, ACoS, and BSR movement rather than an evergreen rule.
The 10 Best Practices for Improving Amazon Listing Conversion Rate
Shoppers take the path of least friction. Friction can be visual, informational, economic, or psychological, and each practice below reduces one form while moving from page-level experience to post-purchase signals. Read results through CTR, CVR, ACoS, BSR, and listing cycle time.
1. Optimize the Listing Page Experience (UX Design)
Visual clutter and weak hierarchy slow scanning. Audit the main image, title, bullets, and A+ for one clear reading order, then remove competing elements. Compare CVR against a similar benchmark before and after the change.
A school glue stick listing illustrates the difference between module presence and page order. The page had packaging images, feature callouts, classroom, home, and office scenes, specifications, and basic A+ content, so it could pass a completeness check. But the elements answered isolated questions rather than forming a sequence of reasons to continue. The initial plan was to add more information and more scenarios; the diagnosis was that the page needed a clear reading order: earn the click, prove how the product works, clarify size and usage boundaries, establish safety and reliability, then reinforce the reasons to buy. That is UX as decision sequencing, not decoration.
2. Remove Friction at the Decision Point
Decision friction appears when value, variants, delivery, or returns remain unanswered. Put objection-handling copy and proof near the purchase context. Watch CVR and return-related contacts for clearer expectation fit.
Decision friction also appears when a page over-promises use. In the glue stick listing, an image showing the stick used across a large poster created a potential expectation gap: the product may be suitable for poster projects, but an oversized coverage scene can imply a speed or efficiency the product may not deliver in practice. The recommended fix was not a more dramatic image. It was a more controlled use scene on paper, cardstock, poster board, or other verified materials, plus earlier placement of safety and cleanup information. The CVR lesson is that objection handling must sit near the purchase context, and it must match what the product can actually do.
3. Make the Main Image and Visuals Prove the Claim
Skepticism falls when visuals prove the claim. Improve composition, angle, lighting, background, scene, and hierarchy without altering product structure, material, color, or logo. Track CTR for the main image and CVR for supporting visuals.
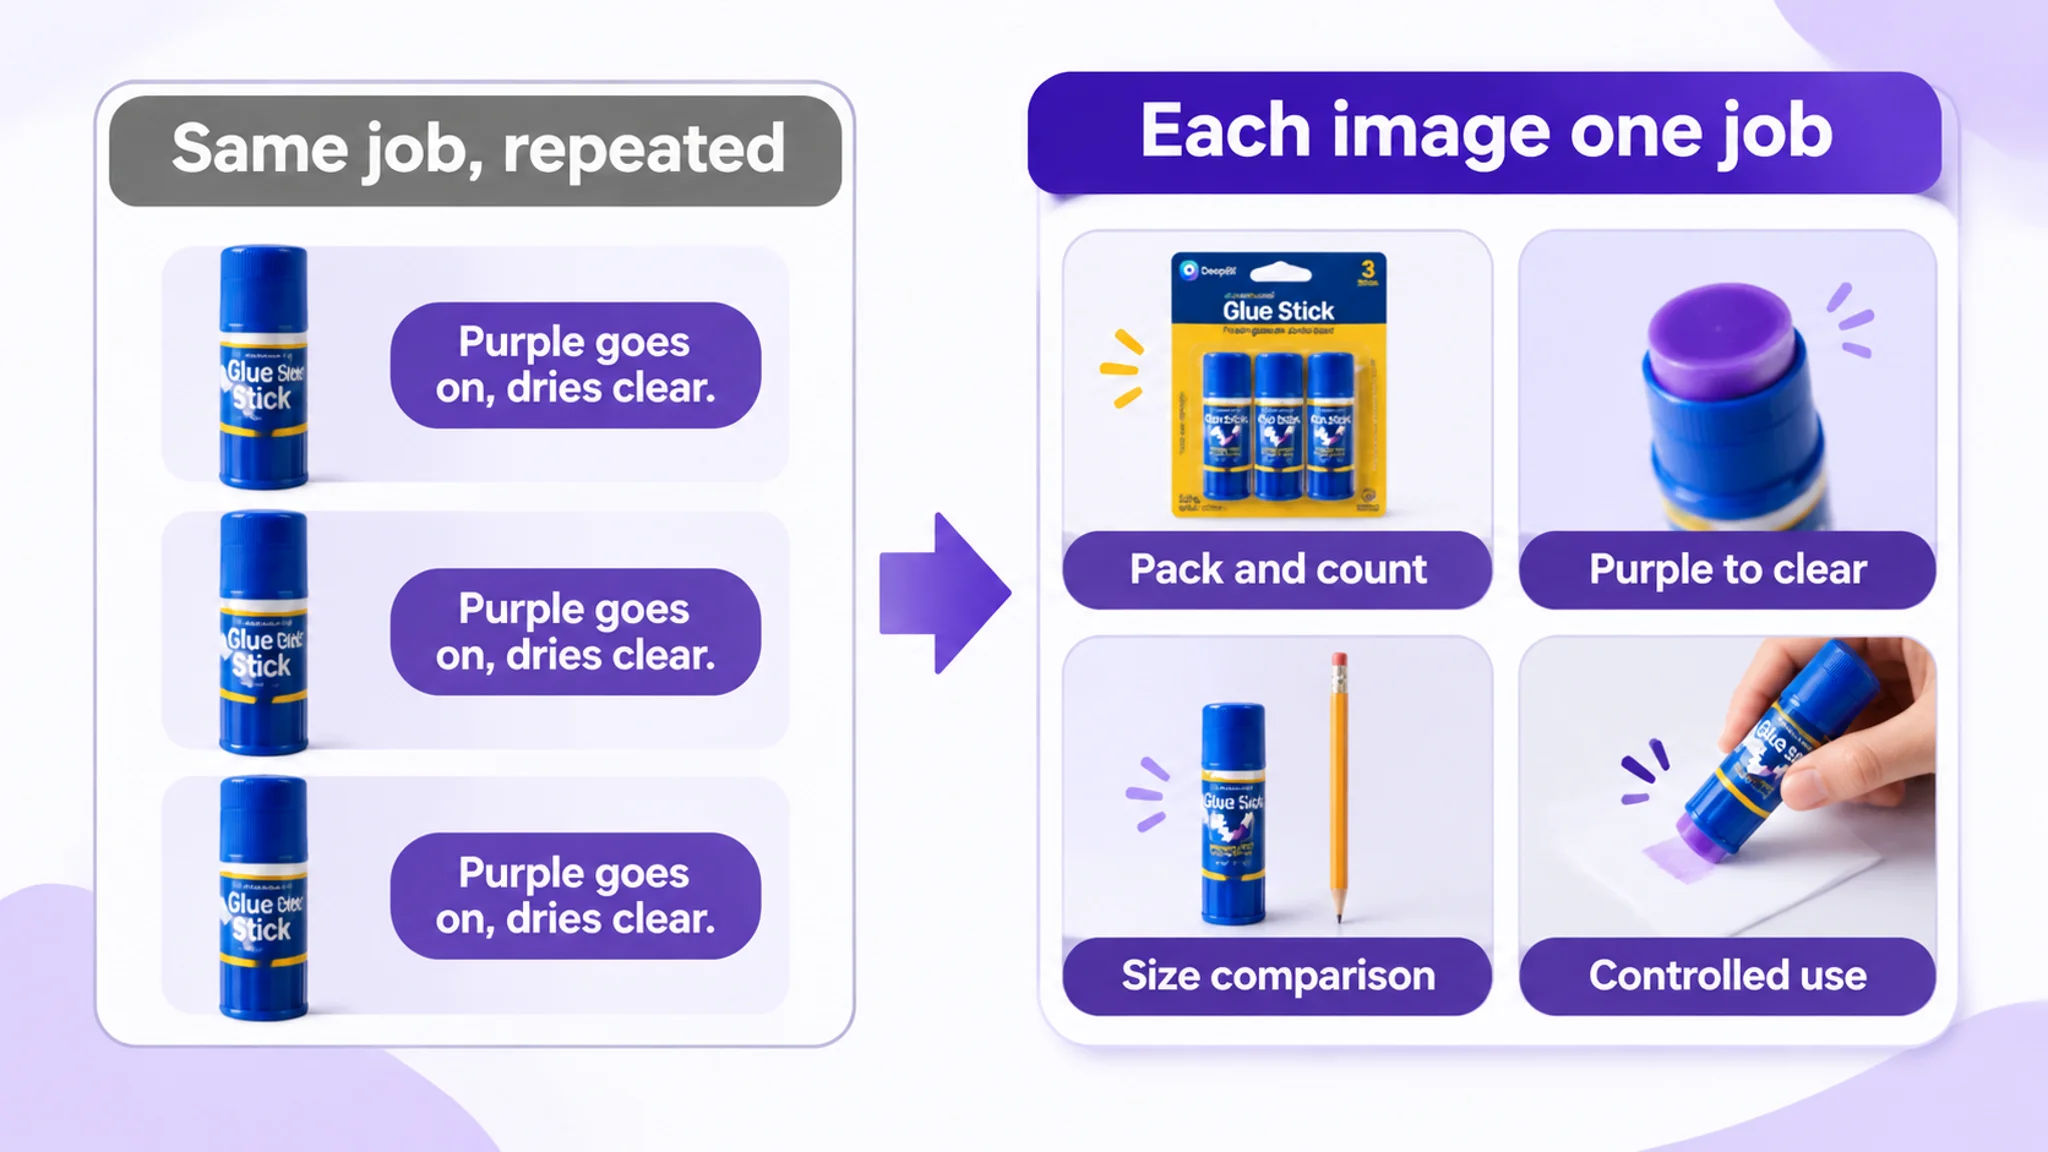
The glue stick case shows how much work a main-image sequence does. The first image needed to confirm the offer immediately: three glue sticks, 22 grams per stick, 66 grams total. The second needed to prove the mechanism—purple application changes to clear after drying. The third needed to reduce size uncertainty with a clear dimensional or weight comparison. Later images needed to show controlled use rather than repeat the same purple-color claim or imply oversized coverage. The original sequence was not failing because it lacked images; it was failing because multiple images had the same job. A stronger sequence turns the main image and supporting visuals into decision tools, not a gallery.
4. Rewrite the Title, Bullets, and A+ as Conversion Copy
Information friction comes from copy that lists features but not outcomes. Build titles as brand, core benefit, product form, and modifier; write bullets as benefit, data or spec support, and pain-point resolution; organize A+ around proof modules. Track CVR and ACoS after edits.
Copy has the same diagnostic logic. In the glue stick case, the title scored 13/20 against a benchmark’s 17/20. The customer title leaned on broad functional wording such as "all purpose" and general location terms, while the benchmark concentrated the core search phrase "disappearing purple school glue sticks" and brought commercially useful attributes forward: color-changing behavior, 22g each, 3 count, washable, non-toxic, and school, craft, and back-to-school contexts. The bullets described functions but did not form a buying logic; the A+ gap was 17/25 vs 24/25. The rewrite direction was to organize the seller’s own verified attributes around benefit, proof, and use—not to copy competitor claims such as acid-free or photo-safe unless the product documentation supported them.
5. Use Rating and Review Structure as a Trust Input
Trust friction is uncertainty about quality and fit. Read star distribution, review volume gaps, and image reviews as inputs, then reflect credible proof in trust modules. Do not manufacture reviews; track CVR alongside trust changes without attributing causation to stars alone.
The review dimension is where the glue stick listing showed its largest gap: 2/15 against 14/15. The customer listing had no rating, no review count, and no customer comments on the first page. The benchmark had a 4.8-star average, more than 32,000 reviews, and visible image and video reviews. That is not a copywriting problem, and page design cannot recreate years of customer evidence. The correct response is a compliant plan to build initial review volume over time while making every controllable trust signal stronger: clear product identity, precise specifications, honest usage boundaries, visible safety information, and proof of the core function. The review gap also explains why weak page logic is more costly for a new listing: every missing trust signal has to be compensated for elsewhere.

6. Design for the Mobile-First Shopper
Small screens amplify visual and informational friction. Check whether the main image, title, price, rating, and first claim are legible and visible on mobile; shorten lines and enlarge proof text. Compare mobile CVR with desktop CVR.
7. Treat Content Weight as a Conversion Variable
Content weight creates cognitive load when every module repeats the same claim. Keep only the modules that answer a distinct question, and cut duplicated specs across bullets and A+. Track CVR and listing cycle time during the revision.
Content weight is not only a matter of length. In the glue stick listing, the image and A+ sequences spent multiple assets repeating the purple-color statement. The revised logic was to introduce the product, prove the mechanism, verify the facts, show the right use, and resolve trust concerns. That can make the page more efficient without adding more modules. If two blocks answer the same question, one of them is consuming attention without advancing the decision.
8. Align Delivery, Returns, and Price Expectations
Economic and psychological friction rise when delivery, returns, or price feel uncertain. State expectations clearly in copy and visuals, then verify the effect on your own listing rather than assuming a fulfillment method will lift conversion. Track CVR and return-related messages.
9. Test One Variable at a Time
Changing several elements at once hides the cause of movement. Change one variable—image, title, bullet, price display, or A+ module—and keep traffic source stable. Log CTR, CVR, and ACoS against the prior baseline.
10. Close the Loop with Post-Purchase Signals
Expectation gaps after purchase feed the next shopper’s friction. Map recurring review and return themes back to claims, images, and instructions, then revise the listing where the mismatch begins. Track CVR and return-related contacts as the loop closes.
Closing the Loop: How to Keep Listing CVR Improving
Keeping listing conversion rate improving is less about finding one better headline than about running a loop that does not quietly stop. The loop is simple: measure the baseline, diagnose the listing element that is creating friction, change one variable, observe the result over an even window, then re-baseline before the next change. Without that last step, teams compare every new result with an old starting point and learn the wrong lesson.
One school glue stick diagnosis changed the seller’s operating question from "does the listing contain enough information?" to "is the listing ready to receive more traffic?" The priorities became: tighten the first-impression logic, remove repeated proof, strengthen the trust layer, and address the review deficit through compliant operations. That is the loop in practice: diagnose the constraint, change one class of variables, observe, and re-baseline. Advertising was not asked to compensate for a page that had not yet earned confidence.
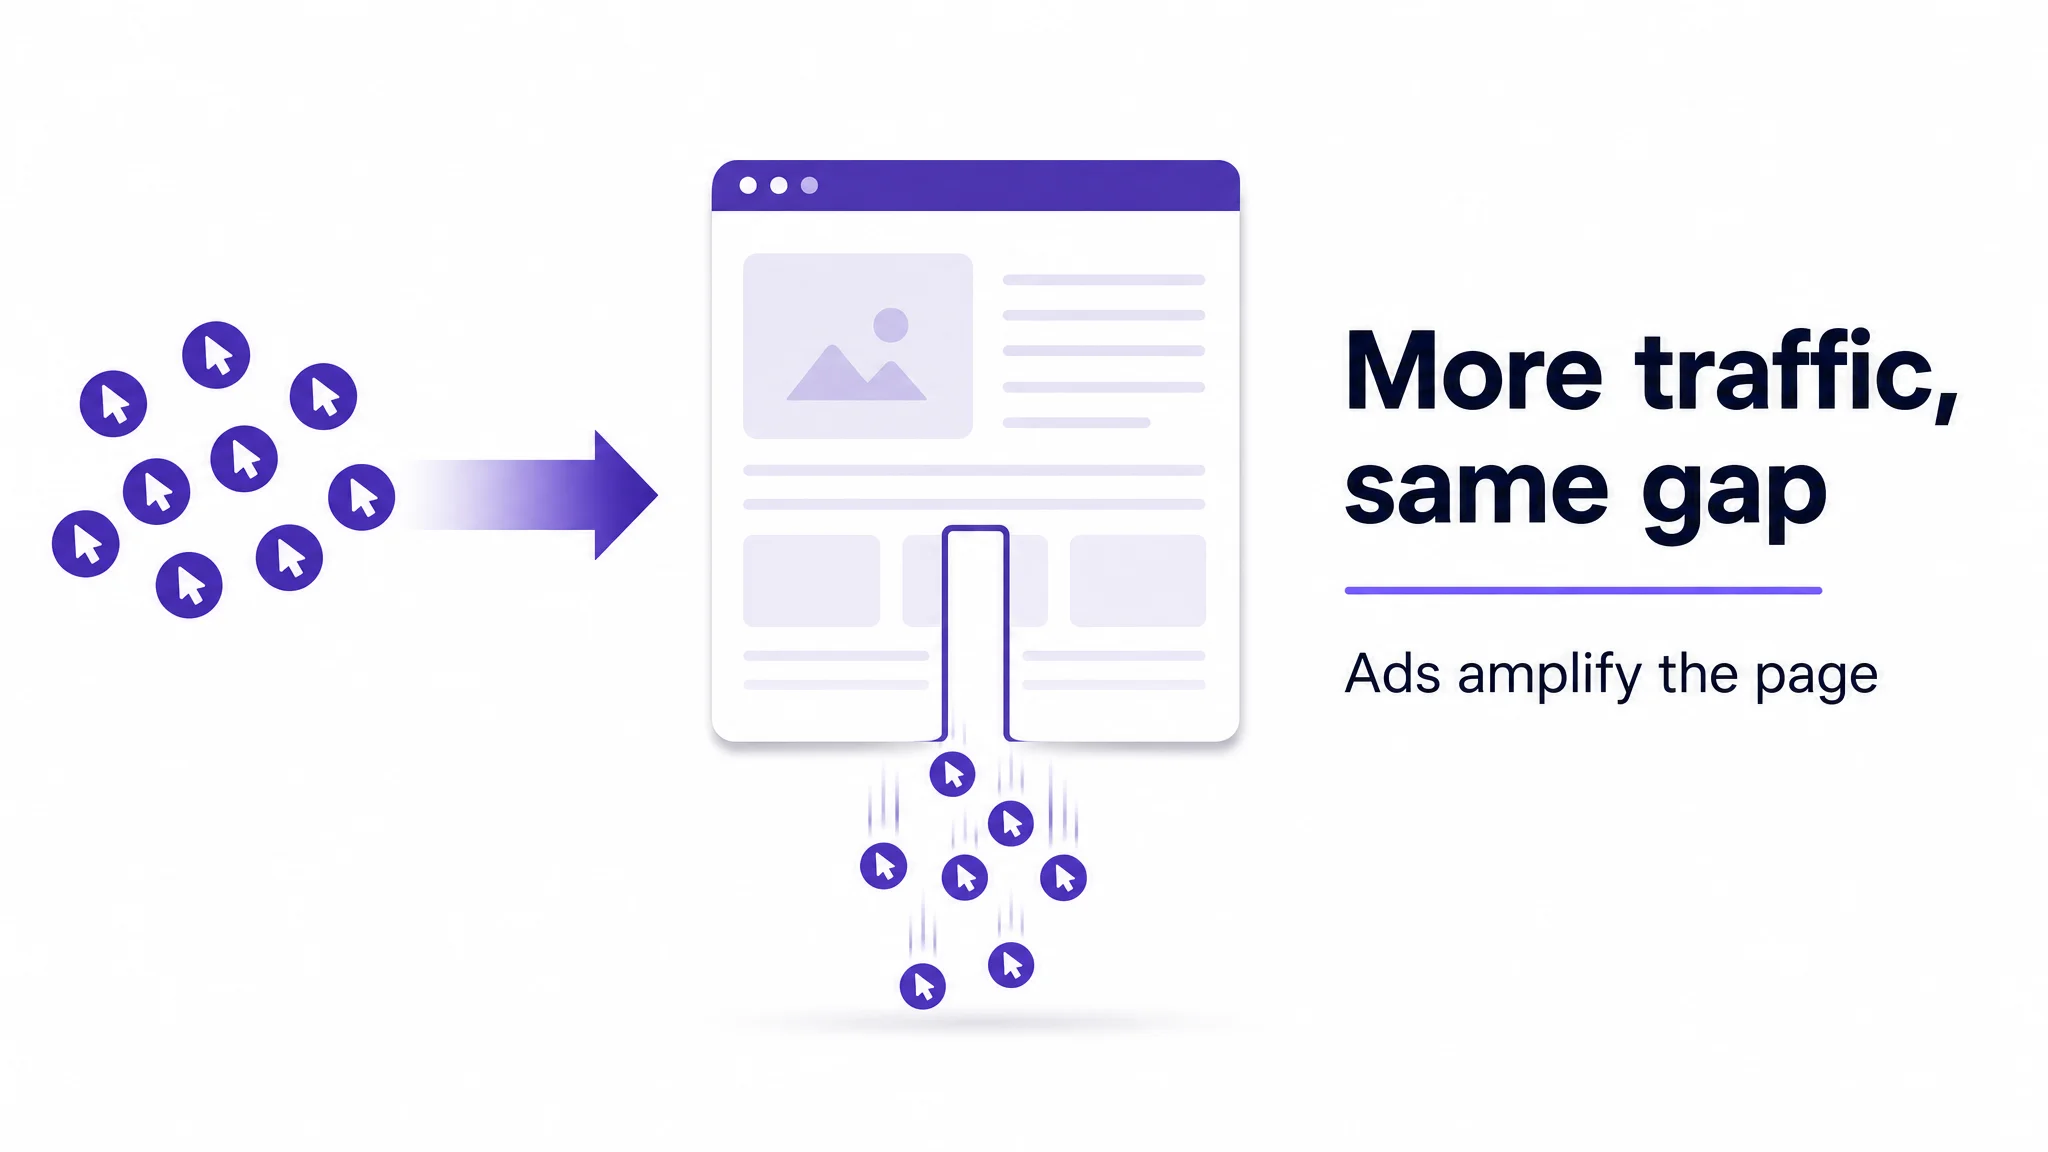
Conversion work pays back twice. The first return is direct: more sessions become orders, so sales rise from the same traffic. The second is in advertising economics: when the listing converts better, the same ad spend produces more orders, which lowers cost per acquisition and relieves pressure on ACoS. That does not make paid traffic free; it makes each click more productive.
Discovery is an indirect mechanism. Better conversion can support sales velocity, and sales velocity can feed Amazon’s ranking and recommendation surfaces, but the ranking effect is not published and not predictable. Treat it as a possible secondary benefit, not a placement promise.
The loop needs an owner. Assign one named operator to pull the baseline, run the diagnosis, propose the single change, approve publishing, hold the observation window, and re-baseline. Otherwise the work becomes a series of disconnected edits.
DeepBI's one-click application pushes generated listing content back into the seller account so the analyze → generate → publish → re-measure cycle does not stall on manual copy-paste, with previous and new versions comparable.