


Understanding Your Cost Levers - ACoS, ROAS, and Break-Even Reality
A seller sees a 20% ACoS and a 25% profit margin, then concludes that the campaign is unprofitable because advertising is consuming most of the margin. That interpretation is incorrect. The relevant comparison is not ACoS against a vague “profit margin,” but against the product’s pre-ad profit margin.
- ACoS (Advertising Cost of Sales) = Ad Spend ÷ Ad Sales × 100
- ROAS (Return on Ad Spend) = Ad Sales ÷ Ad Spend
- TACoS (Total Advertising Cost of Sales) = Ad Spend ÷ Total Sales × 100
Assume a product sells for $100 and costs $75 before advertising. Its pre-ad profit is $25, so its break-even ACoS is calculated as follows:
(Price – Cost) ÷ Price = ($100 – $75) ÷ $100 = 25%
At a 20% ACoS, advertising costs $20 per sale, leaving $5 in profit, or a 5% net margin. The campaign is profitable, not loss-making. An ACoS below the break-even ACoS leaves a positive contribution margin, while an ACoS above it creates an advertising loss, assuming the underlying cost assumptions are complete.
Do not use Profit Margin ÷ Price to calculate break-even ACoS. If “profit margin” refers to a dollar amount, the correct calculation already divides pre-ad profit by price, as shown above.
TACoS provides a broader perspective by measuring advertising cost against paid and organic sales combined. It shows whether ads are supporting total revenue efficiently rather than evaluating campaigns in isolation. Clicks multiplied by conversion rate estimate orders; calculating revenue additionally requires Average Order Value: Revenue = Orders × Average Order Value.
However, profitability calculations only become useful when the page can convert the traffic being purchased. A campaign may have an acceptable ACoS in one period and still conceal a developing conversion problem if clicks continue to rise while orders do not follow at the same rate. In that situation, the issue may not be the break-even formula itself, but the relationship between advertising traffic and the Listing’s ability to turn that traffic into orders.
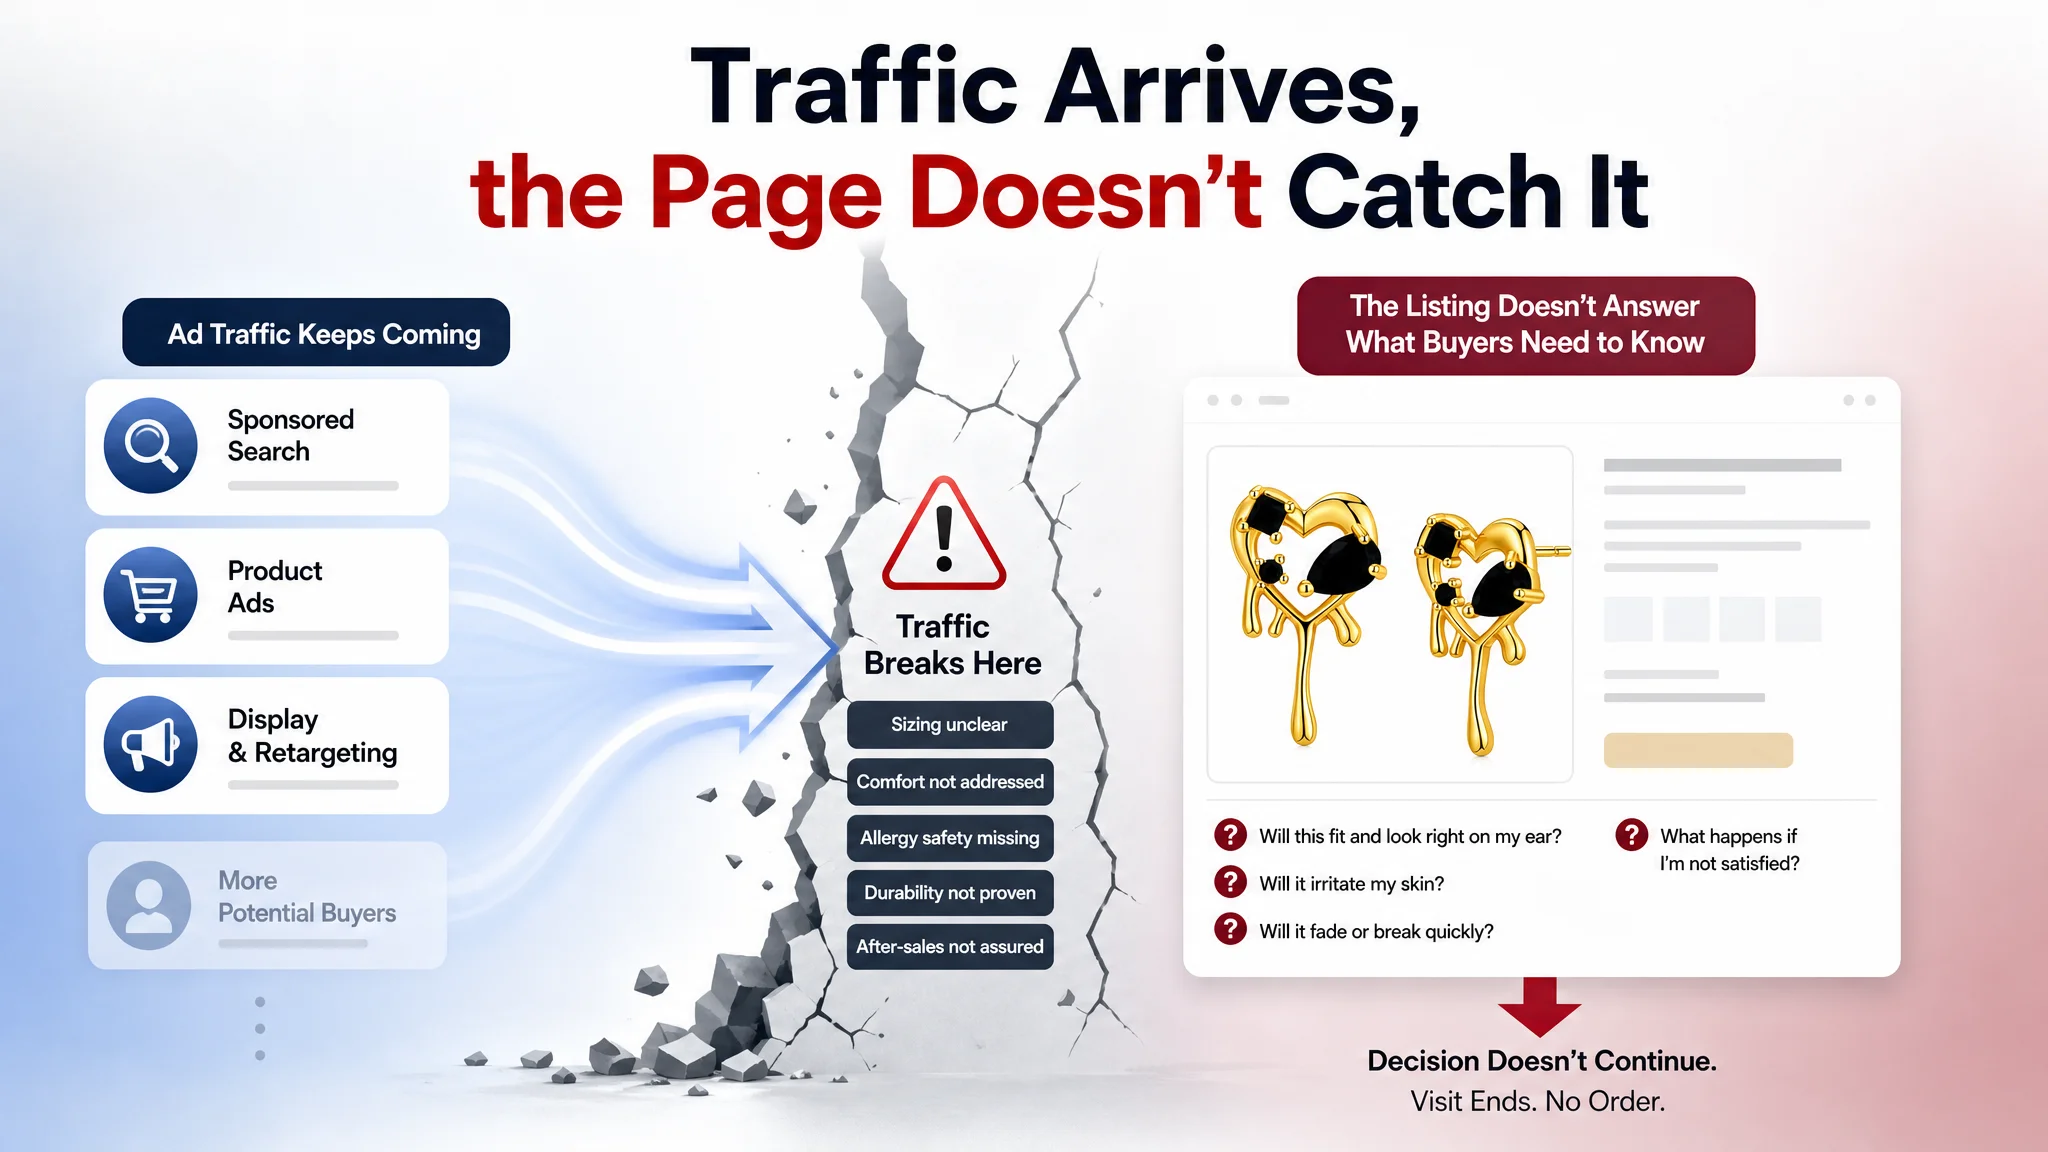
A jewelry seller reviewed by DeepBI illustrated this distinction. The Listing had stronger reviews, a higher overall page score, and more polished A+ content than a closely matched competitor. Yet ad costs remained difficult to control. The team initially assumed that campaign structure, bids, or creative quality needed another round of adjustment. The page looked strong on paper, but the diagnostic review found that it delayed answers to practical buyer concerns such as sizing, comfort, allergy safety, durability, and after-sales protection. Ads were purchasing visits, but the page was not reducing the decision risk those visitors brought with them.
The broader lesson is that ACoS should be read together with CVR and the page’s conversion capacity. Advertising cost can be calculated precisely, but a profitable growth decision also requires understanding whether the product page is helping or limiting the return on that spend.
Budget Architecture - Setting Spend Caps That Respect Profit
A budget is not permission to spend; it is a limit on how much investment a SKU can absorb while remaining profitable. Begin by calculating the break-even ACoS for each SKU or portfolio, then set daily budget thresholds around the spending range that preserves contribution margin. The key question is not, “How much can we spend?” but, “Across what spending range does incremental advertising continue to produce acceptable profit?”
Campaign-level allocation provides tighter control. It is suited to distinct products, match types, or funnel objectives where CTR, CVR, and ACoS vary materially. Portfolio-level allocation is more useful when related campaigns share a profit target and can redistribute demand across a product group. Use portfolios to manage the broader ceiling while retaining campaign-level safeguards where inefficient spend could be concealed by aggregate performance.
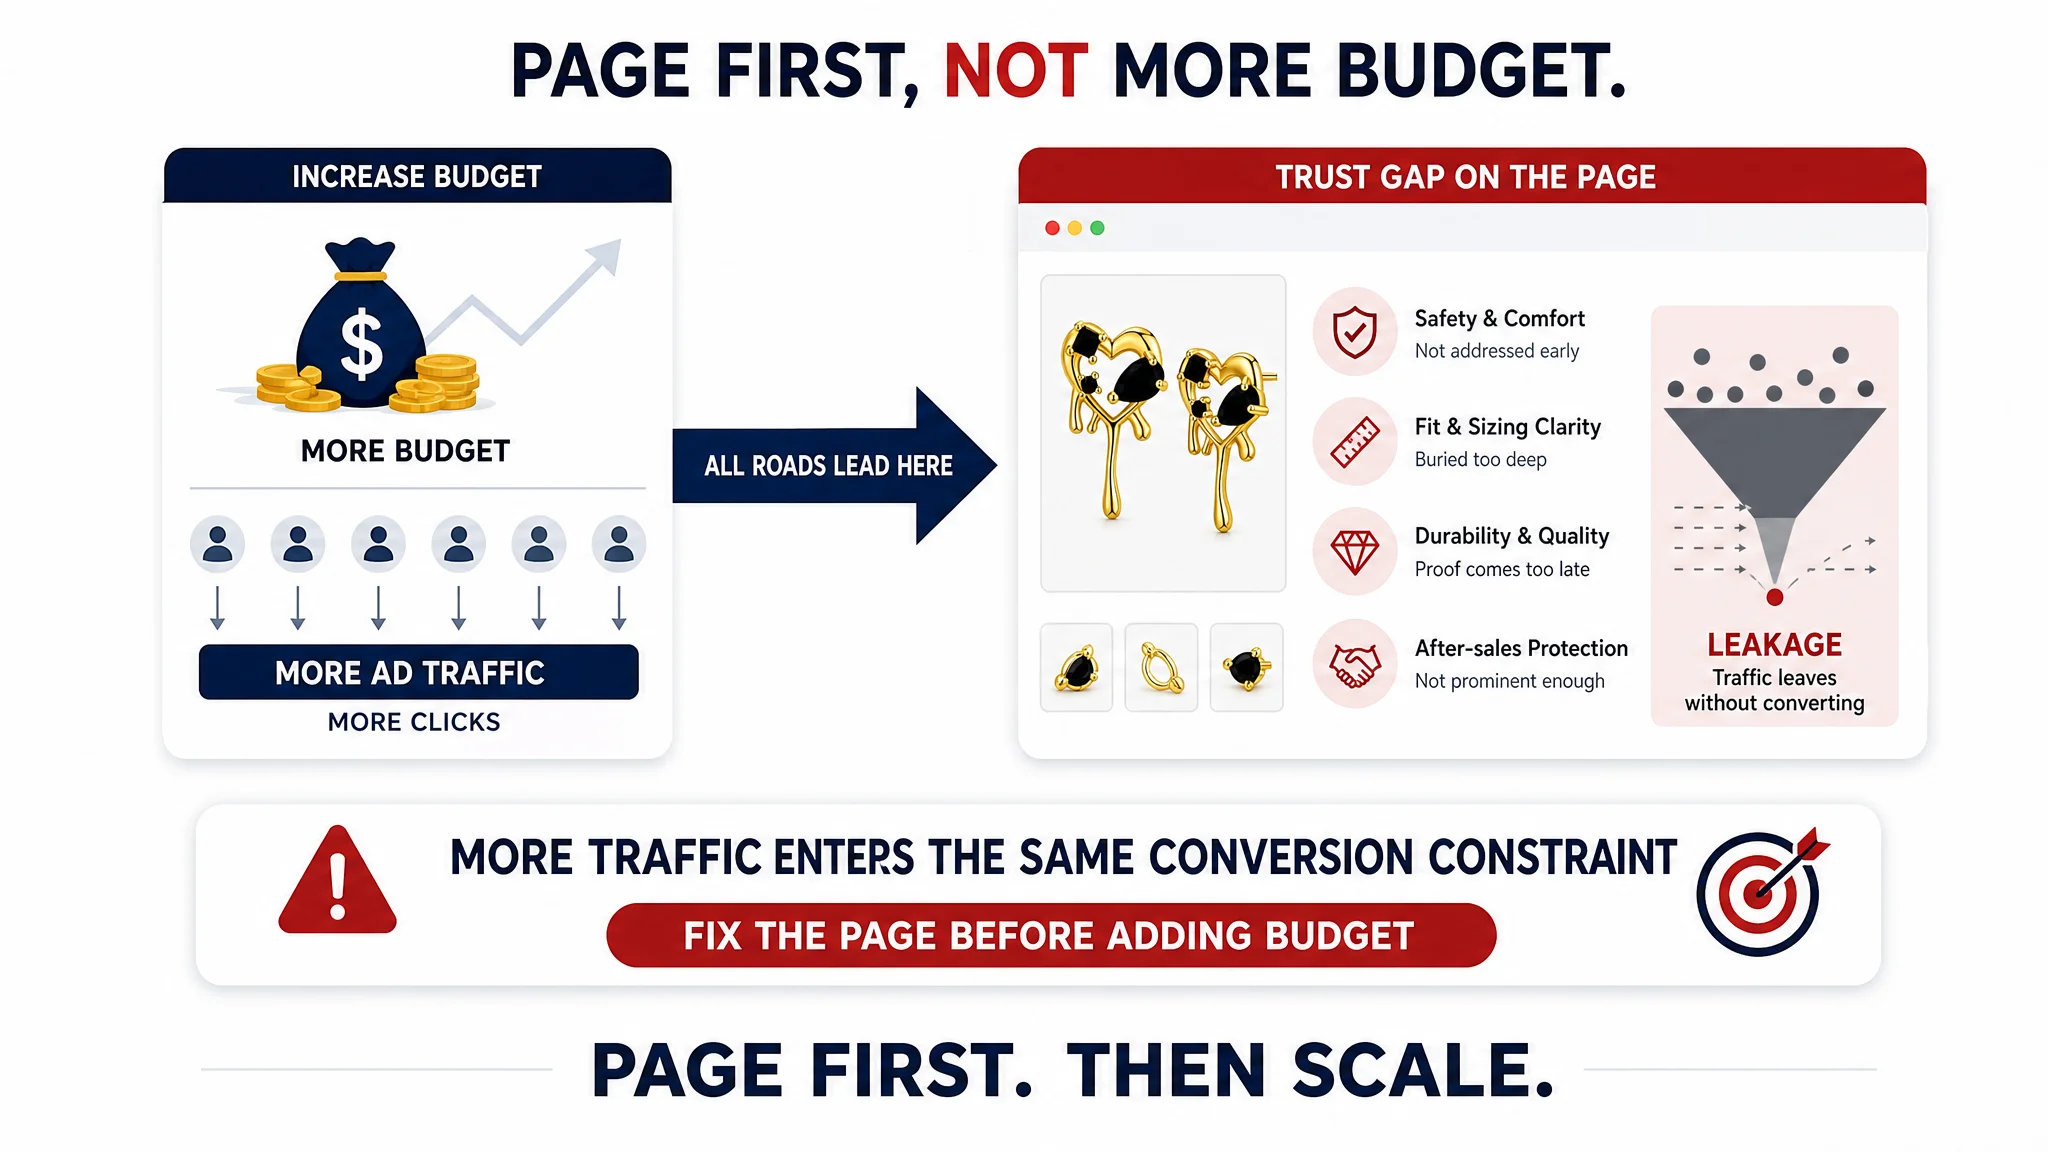
A budget increase should also be evaluated against the page receiving the traffic. In the jewelry case, the seller’s page was not lacking visual polish or basic content coverage. Its problem was that proof was placed in the wrong order: technical details appeared before desire and reassurance, while material safety and after-sales protection were not prominent enough in the early decision path. Increasing budget before resolving that sequence would have sent more clicks into the same conversion constraint.
This is why budget control cannot be separated completely from Listing diagnosis. If traffic quality is weak, budget may be wasted on irrelevant queries. If traffic quality is acceptable but CVR is weak across several sources, increasing spend can simply increase the cost of exposing the page’s unresolved trust gaps. The correct response depends on whether the constraint is targeting, the Listing, or both.
Scale cautiously by increasing a budget by 10–20%, then monitoring performance for at least seven days before reassessing. Review spend, sales, ACoS, CVR, and organic indicators such as BSR instead of reacting to a single day of underdelivery or overspend. The reported Trellis finding that sellers who adjusted ACoS targets by product phase achieved 31% higher profit reinforces the value of phase-based controls.
Native Amazon budget rules can increase budgets, but they cannot decrease them. This asymmetry makes one-directional automation risky when conversion weakens or a product enters a different lifecycle phase. Some third-party tools offer more flexible controls. DeepBI dynamic budget tuning can increase or decrease budgets using seven-day performance windows, supporting continuous adjustment instead of a set-and-forget budget structure.
The practical rule is simple: expand the budget only when the additional traffic has a reasonable chance of producing additional orders. Before scaling, confirm that the Listing answers the questions that matter to the product category. For the pearl earrings page, those questions were not limited to whether the product looked attractive. Buyers also needed to understand whether it would fit, feel comfortable, avoid irritation, remain durable, and be safe to purchase as a gift. A budget cap protects margin, but a coherent decision path protects the efficiency of the spend within that cap.
Precision Targeting - Keywords and ASIN Funnels That Reduce Wasted Spend
Broad targeting is useful for discovery, but leaving it unmanaged can turn impressions and clicks into avoidable ACoS. The control mechanism is a repeatable progression from exploration to precision: analyze search terms, harvest negative keywords, and remove queries that generate clicks without sufficient CVR or commercial relevance.
Filter winning terms by conversion rate, ACoS, and consistency rather than by clicks alone. High-intent terms can receive stronger bids, while low-converting variants should be negated or isolated for controlled testing. Search-term analysis should also guide hour-by-hour bid adjustments, concentrating spend during periods that produce stronger CVR and lower ACoS. An intent score that combines relevance, conversion behavior, and cost can help rank candidates for action.
Competitor ASIN targeting is appropriate when products share a close use case, function, audience, and price band. An ASIN that is materially different, poorly validated, or unlikely to convert should be excluded or negated; competitor traffic is not automatically valuable traffic.
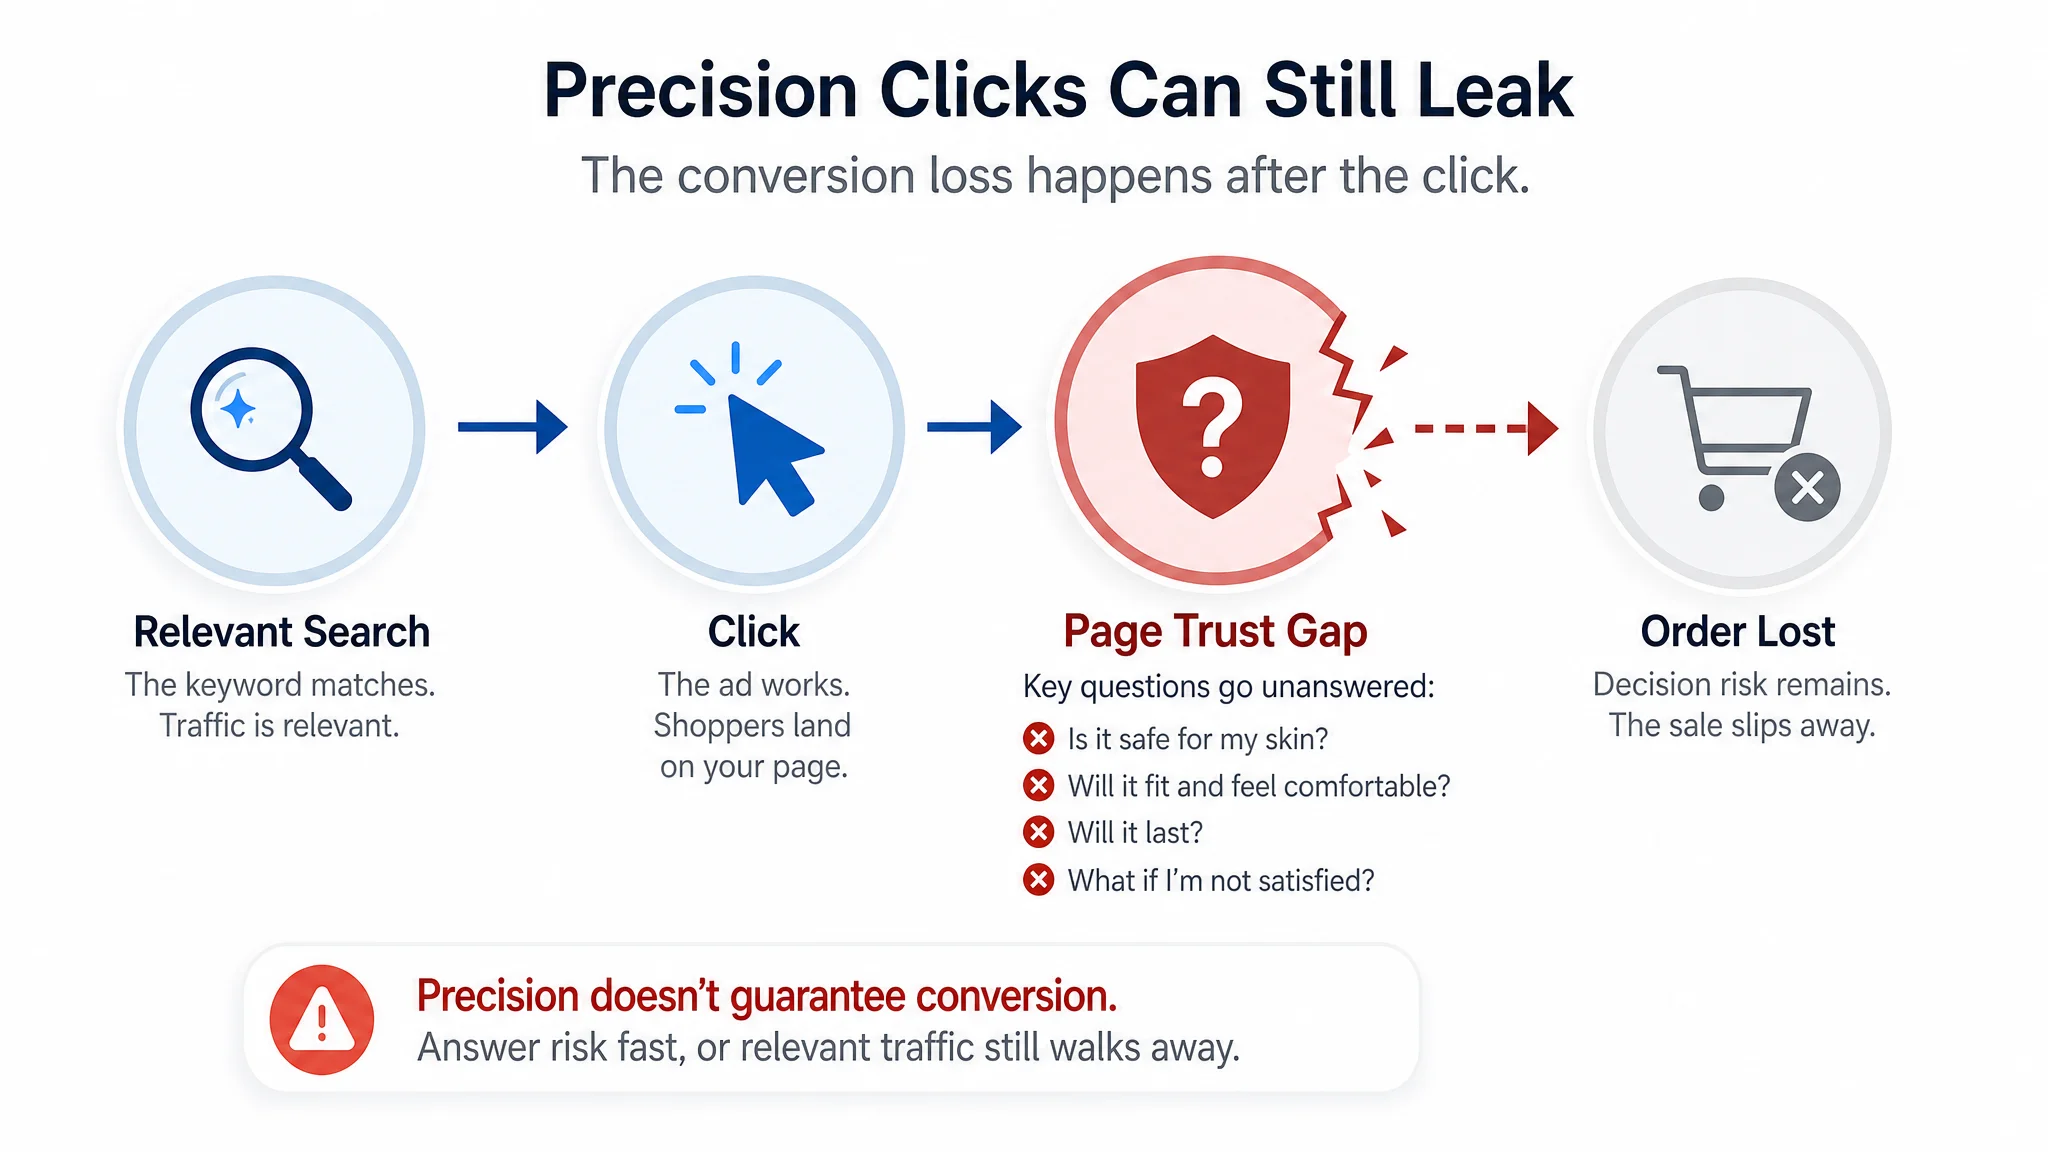
The jewelry Listing comparison shows why relevance should not be judged only at the keyword or ASIN level. The customer’s page scored higher than the competitor’s on several Amazon page dimensions, had stronger reviews, and offered more polished visual content. Yet the competitor addressed material safety, fit, and after-sales reassurance earlier in the page. If the customer’s ad traffic was sufficiently relevant to click but the page did not resolve those concerns, further tightening targeting alone would not remove the conversion constraint.
This distinction matters when interpreting a campaign with normal CTR but difficult ACoS. If the traffic is entering through relevant jewelry searches and the page still converts inefficiently, the problem may not be that the campaign is buying the wrong audience. The audience may be arriving with questions that the Listing answers too late. In that case, lower bids can reduce exposure, but they do not repair the page’s decision path.
A generalized mini-case illustrates the principle: a campaign initially purchased broad clicks across loosely related queries and competitor pages. After negative-term harvesting, conversion-backed keyword filtering, and tighter ASIN selection, the campaign directed spend toward fewer but more qualified opportunities. Wasted clicks declined before budgets were expanded, with the aim of improving CVR and controlling ACoS rather than maximizing traffic volume.
The same progression should be applied after confirming that the destination Listing can support the qualified traffic. A precisely targeted click is not automatically a valuable click if the page fails to explain the product’s safety, fit, durability, use case, or purchase protection. Targeting and Listing quality therefore need to be evaluated as connected parts of the conversion path.
DeepBI can organize this process across four layers:
- Exploration: automated keyword and ASIN discovery.
- Screening: filtering candidates through two months of conversion data.
- Precision: testing qualified terms and ASINs to reduce ACoS.
- Scaling: increasing budgets only after stable CTR, CVR, and ACoS signals support expansion.
Automation That Respects Your Margin - Dynamic Bids and Smart Rules
Manual daily bid changes are often less precise than they appear. Sellers may react to a single weak day, make decisions before conversion data matures, or overcorrect after a sudden CPC increase. Emotion and delayed signals can push bids down just as a keyword begins converting—or keep spend high after efficiency has deteriorated. The result is pressure on ACoS, wasted budget, and missed opportunities to improve CTR, CVR, and BSR.
A margin-aware system should evaluate trends rather than isolated events. DeepBI can use trailing seven-day clicks, conversions, spend, and ACoS to determine daily bid and budget adjustments. When conversion quality supports additional volume, the system can raise exposure within defined limits. When spend continues without proportional incremental sales, it can reduce bids or budgets before campaign saturation consumes more margin.
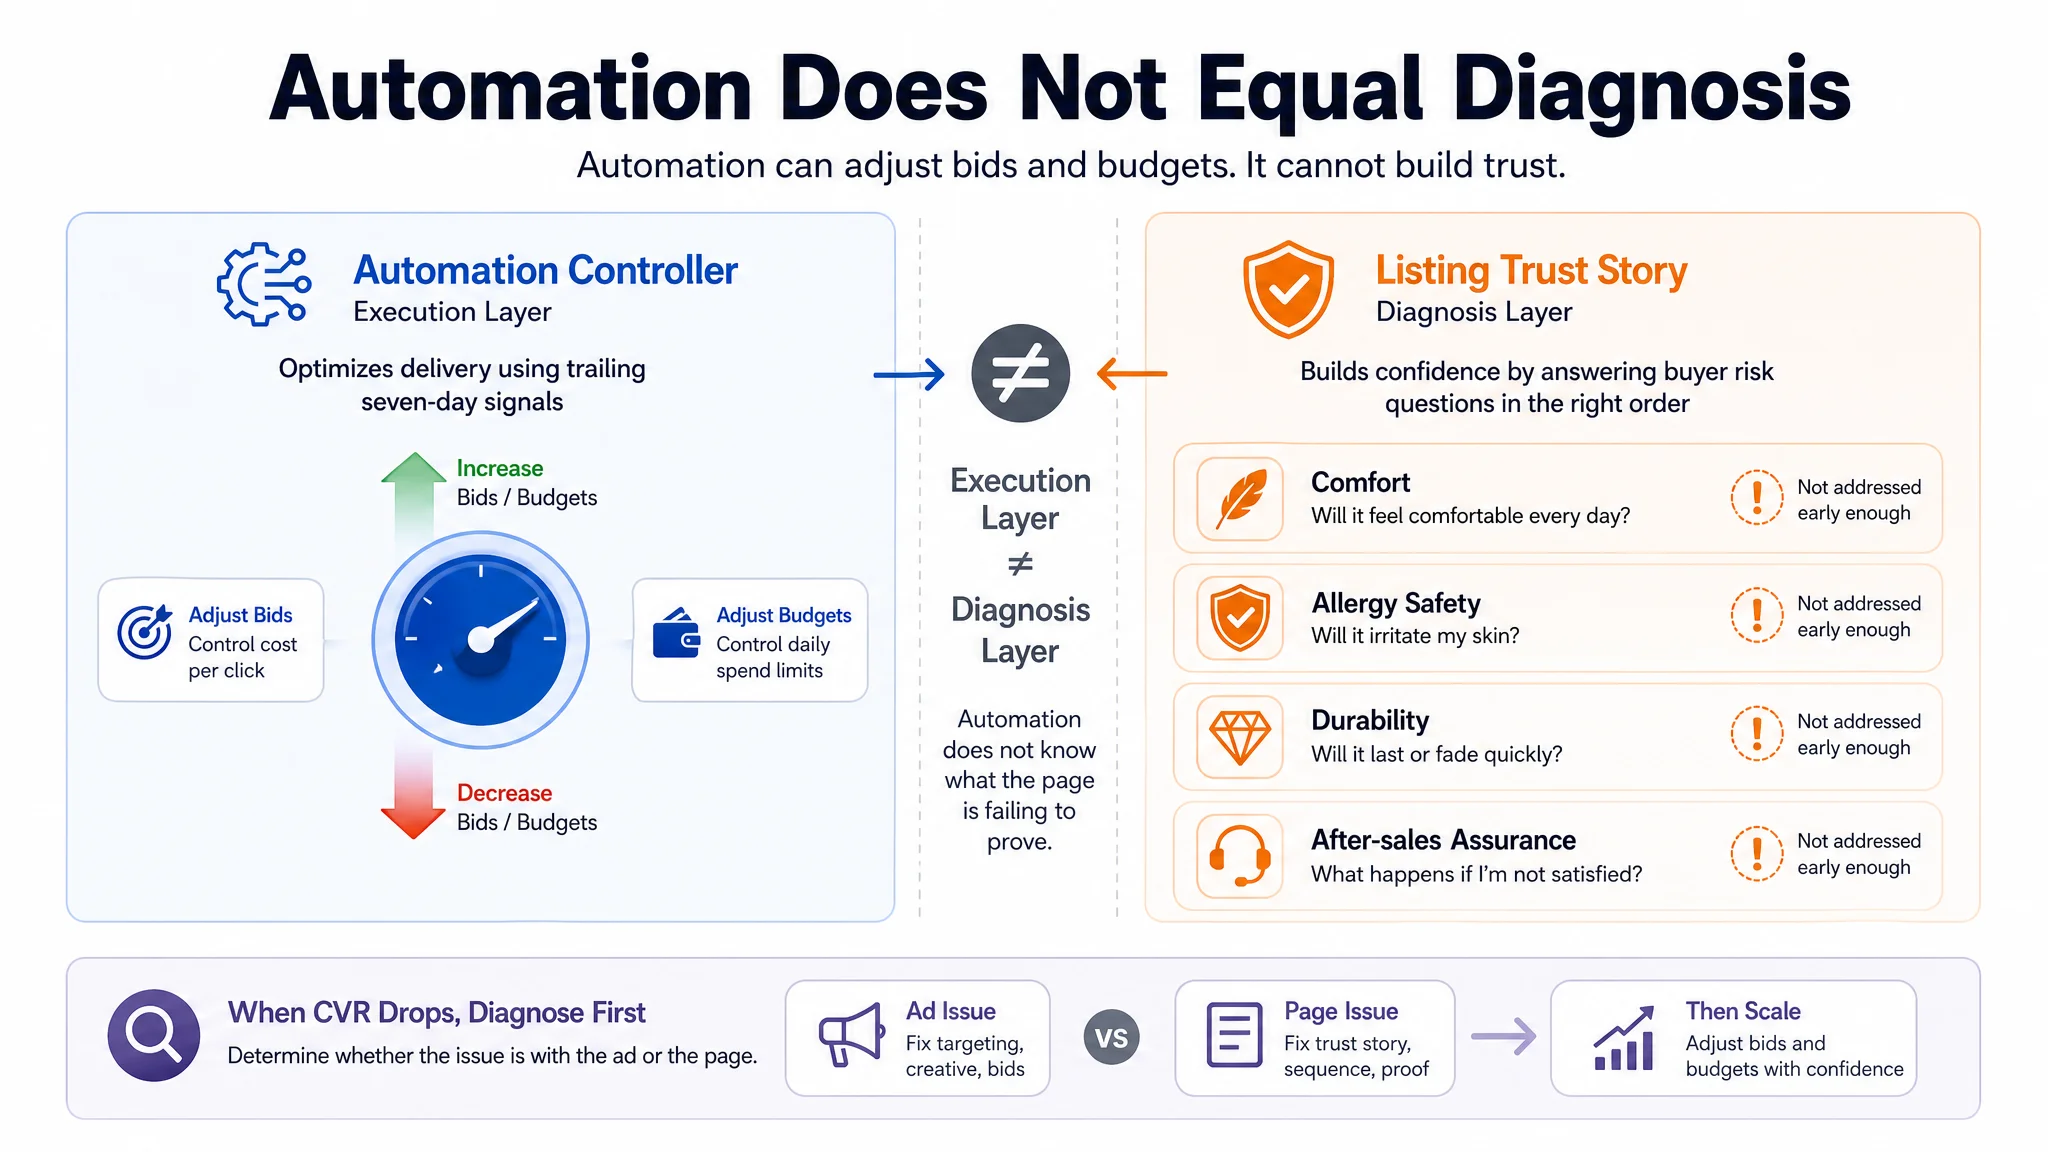
But automation should not be used to avoid diagnosing the destination page. In the pearl earrings case, the seller’s initial instinct was to keep adjusting ads and polishing images because the Listing appeared strong. The deeper review found that the page had a misordered trust story: it led with aesthetic and technical strengths but did not bring comfort, allergy safety, durability, and after-sales reassurance into the early buying process. An automated rule could reduce spend when CVR weakened, but it could not determine by itself that the underlying issue was the sequence of Listing proof.
This is a common source of wasted optimization. A seller may interpret high ACoS as evidence that bids are too high, reduce exposure, observe lower spend, and conclude that the problem is improving. Yet if qualified traffic is also declining and the page remains unresolved, the business has not necessarily become more efficient. It may simply be buying fewer opportunities. Automation should respond to the diagnosed cause rather than treat every conversion decline as a bidding problem.
Static rules typically move in one direction: they increase spend when a threshold is met but offer limited intelligence when performance weakens. An adaptive system can both scale and contract, applying the same transparent logic to protect profitable growth.
The practical advantage is inspectability. Strategy logs record which data signals triggered each adjustment, allowing sellers to verify whether changes align with margin targets instead of treating automation as an opaque decision engine. This supports a disciplined 10–20% weekly scaling process: expand only when trailing performance justifies it, and reduce exposure when the evidence no longer supports additional spend. Automation becomes an execution layer for the strategy, not a substitute for business judgment.
Business judgment includes asking whether the Listing can convert the traffic that the rule is designed to acquire. If the answer is uncertain, the next action may be a page audit rather than another bid adjustment. Automation protects the spending boundary; it does not create customer trust, clarify fit, or explain why a product is safe and suitable.
From Ad Spend Control to Organic Profit Growth - A Cost-Synergy Bridge
Advertising should not be judged solely by immediate attributed sales. A tightly controlled campaign can also generate reliable keyword signals that support organic performance over time. When a keyword produces strong CTR and CVR at an acceptable ACoS, reinforcing it can increase relevant traffic, strengthen listing engagement, and contribute to improved keyword ranking. The effect is indirect: advertising identifies demand, while stronger listing relevance and conversion determine whether that demand develops into durable organic visibility and sales.
A Listing’s ability to convert therefore remains part of the ad-to-organic bridge. In the jewelry case, the page had strong reviews, broad title coverage, refined imagery, and detailed A+ content. Those assets appeared to create a strong foundation, but they were not arranged around the buyer’s actual sequence of questions. The page needed to move from desire to proof to safety more clearly. Until that happened, additional advertising could generate visits without building the conversion signals required for more durable organic performance.
TACoS provides the broader profitability view. If ACoS remains controlled while TACoS gradually declines, paid advertising may be contributing to a larger organic sales mix rather than simply purchasing revenue. Track TACoS alongside CTR, CVR, BSR, keyword position, and total sales. A falling TACoS does not prove causation by itself, but it is a useful signal that paid traffic and Listing performance are working together more efficiently.
Execution should remain selective. From campaigns with stable cost control, identify keywords with both high CTR and high CVR, then place them in a dedicated Top of Search push with a defined budget cap. Review the combined paid and organic results before expanding spend.
A high CTR by itself should not be treated as proof that the full conversion path is working. The pearl earrings page was visually polished and capable of attracting attention, but the audit found that the page did not close key trust gaps early enough. Advertising can identify demand and generate clicks; the Listing must then convert those clicks into orders and reinforce the relevance signals that support organic growth.
DeepBI can serve as this ad-to-organic bridge: its fifth funnel layer uses filtered, high-value advertising keywords to support organic ranking without inflating spend. The objective is gradual improvement through precise advertising control, not a guaranteed page-one outcome or a standalone organic marketing program.
Monitoring, Iteration, and Avoiding the Pitfalls That Inflate Costs
Use a fixed weekly review cadence to compare the same metrics, isolate waste, and adjust campaigns without reacting to isolated swings in revenue.
- Review ACoS against break-even ACoS before making a profitability decision. ACoS is calculated as ad spend ÷ attributed ad sales × 100. Break-even ACoS should reflect the share of sales revenue available to cover advertising after product cost, referral fees, fulfillment, discounts, and other relevant costs. For example, an ACoS of 28% is not automatically profitable or unprofitable. If the campaign’s break-even ACoS is 25%, the campaign is above its allowable advertising cost; if break-even ACoS is 35%, the same campaign may still support a positive contribution. Record both values in the weekly review and judge the gap between actual ACoS and break-even ACoS rather than treating ACoS as a universal profit threshold.
- Check TACoS to understand whether advertising is supporting the whole business, not only attributed sales. TACoS is calculated as ad spend ÷ total sales × 100, using the same sales definition consistently throughout the analysis. A declining TACoS can indicate that organic sales are carrying a larger share of total sales, while a rising TACoS may show increasing dependence on paid traffic. Do not use TACoS to replace ACoS: ACoS evaluates advertising efficiency against attributed ad sales, while TACoS evaluates advertising cost in relation to total sales. Review both metrics together, then investigate whether a change came from ad spend, attributed sales, total sales, or a combination of these factors.
- Track conversion rate with a stable definition and connect it to campaign decisions. Conversion rate should be calculated consistently as orders divided by attributed clicks, expressed as a percentage. A lower CVR can make previously acceptable bids expensive because more clicks are required to generate each order. Review CVR by campaign, ad group, keyword, search term, and ASIN where the available reporting supports that level of detail. When CVR falls, first separate traffic quality from Listing performance: weak search-term relevance can waste clicks, while a Listing issue can reduce conversion across several traffic sources. Use CTR and CVR as diagnostic signals, but do not change their definitions or mix incompatible reporting windows when comparing weeks.
The pearl earrings diagnosis demonstrates why this separation matters. The page had stronger reviews and a higher Listing score than the comparison product, so the initial assumption was that campaigns or creatives were the main weakness. However, the page’s early content did not clearly address comfort, skin safety, fit, durability, and after-sales support. The issue was not simply that the product lacked proof; key proof was placed too late or framed as decoration rather than risk reduction. When CVR is weak despite credible traffic and strong visible assets, the Listing’s decision sequence deserves the same scrutiny as the campaign.
- Count orders separately from revenue when evaluating campaign performance. Revenue alone can hide a decline in demand quality. A campaign may report higher sales because of a small number of high-value orders while producing fewer total orders, or it may generate more orders at a lower average order value. Review order count, attributed sales, average order value, clicks, and CVR together. The correct relationship is orders = clicks × conversion rate, while sales requires Average Order Value: sales = clicks × conversion rate × average order value. Do not use Sales = Clicks × Conversion Rate without Average Order Value. When deciding whether to preserve reach, reduce bids, or move a term into a different campaign, ask whether the campaign is producing sustainable order volume at an ACoS that remains within break-even limits.
- Measure the percentage of spend assigned to low-conversion terms. Define the low-conversion group before reviewing the data, using a consistent rule based on the account’s available click and order volume rather than changing the threshold to fit the outcome. Calculate the share as spend on low-conversion terms ÷ total ad spend × 100. A high percentage identifies where budget is being consumed without sufficient order production. Review these terms for relevance, match type, placement, bid level, and search intent before applying a blanket negative targeting action. A term with few or no orders may have limited data, so distinguish between genuinely weak conversion and insufficient observation. The objective is to reduce unproductive spend while protecting terms that are still gathering meaningful evidence.
- Compare the current week with an appropriate prior period instead of reacting to one daily fluctuation. Use the same attribution window, date range logic, and metric definitions for each comparison. Review changes in ACoS, TACoS, CVR, order count, CTR, spend, clicks, and low-conversion-term spend share. A daily spike may come from reporting delay, auction volatility, or a small number of clicks; a weekly pattern offers a more reliable basis for intervention. At the same time, do not allow a weekly average to conceal a sudden cost anomaly. Flag abrupt changes in spend, clicks, order count, or ACoS for immediate inspection, then confirm whether the change persists across the review window before applying a structural campaign change.
- Record every material campaign, bid, budget, targeting, and Listing change with its date and intended outcome. A change log turns performance review into a controlled feedback loop. Note the adjustment, the affected campaign or ASIN, the reason for the change, and the metric expected to move. After a Listing visual or content change, mark the event in the advertising analysis and observe subsequent CTR and CVR movement over a defined period rather than assigning credit immediately. This approach links a specific action to later market performance. It also prevents sellers from repeatedly changing bids while a Listing conversion issue remains unresolved, or from attributing an ACoS movement to automation without checking the other variables that changed at the same time.
In the jewelry case, the relevant Listing changes were not limited to adding more visual polish. The proposed direction was to reorder the page around a clearer decision path: use the title and bullets to surface product form, material safety, wear scenarios, gifting logic, and protection; use the image set to demonstrate comfort, scale, durability, and giftability; and move technical proof into a sequence that confirms rather than delays desire. Recording these changes alongside advertising data makes it possible to evaluate whether CVR changes follow a page-level intervention rather than incorrectly crediting every movement to bids.
- Account for seasonality before converting a temporary pattern into a permanent rule. Demand, conversion intent, competitive pressure, and available traffic can vary by shopping period, product lifecycle, promotions, and inventory position. A rule based on one period may become too aggressive when customer intent changes. For example, a bid reduction triggered by a short-term CVR decline may suppress valuable traffic if the decline reflects temporary market conditions rather than poor relevance. Compare the current results with comparable periods where data exists, and annotate promotions, price changes, stock interruptions, and major Listing edits. Keep automated controls responsive, but set review points for rules that were created under unusual conditions.
- Treat market shifts as a reason to iterate, not as evidence that a static rule has failed permanently. Competitor pricing, new offers, changes in search behavior, placement dynamics, and shifts in traffic mix can alter CTR, CVR, ACoS, and order volume without any change to the campaign structure. Static bid caps and fixed spend allocations cannot anticipate every change in auction pressure or customer intent. Review whether a term’s clicks are still producing orders, whether its CVR has changed, and whether its current ACoS remains below or above break-even ACoS. Then adjust bids, budgets, targeting, or Listing priorities according to the diagnosed cause. Preserve the rule only when the underlying performance relationship remains valid.
Competitor comparison can be useful here, but it must go beyond an overall Listing score. The jewelry seller’s page scored higher on several dimensions, including visual detail and reviews, yet the competitor made safety, fit, and after-sales reassurance more explicit and earlier in the copy. This shows why market analysis should examine the order and emphasis of the buying argument, not only the apparent quality of individual assets. A page can win on polish while losing on decision clarity.
- Use a common metric dictionary across campaign reports, dashboards, and decision notes. Conflicting definitions create false explanations. If one report uses attributed ad sales for ACoS while another uses total sales, the resulting comparison can lead to an incorrect budget decision. Apply the same formulas for ACoS, TACoS, CVR, CTR, order count, and low-conversion-term spend share throughout the analysis. Keep attribution windows, currency treatment, and reporting periods consistent. When a metric is unavailable or measured differently, label the limitation rather than combining it with a supposedly comparable figure. Consistency is especially important when automated adjustments depend on thresholds: a rule is only as reliable as the data definition behind its trigger.
- Avoid declaring a campaign unprofitable from ACoS alone. The common mistake is to see an ACoS above a preferred target and immediately pause the campaign. The correct approach is to compare actual ACoS with break-even ACoS, then examine order count, CVR, average order value, product margin, and the campaign’s role in the funnel. A campaign above break-even may require a bid reduction or targeting change, but a campaign below break-even can still deserve attention if order volume is falling or TACoS is rising. Conversely, a campaign with a higher ACoS may be acceptable when its break-even ACoS is also higher and its order production supports the business objective. Profitability requires the complete cost context, not a single advertising ratio.
The opposite mistake is also common: assuming that a higher Listing score or stronger reviews proves that the page is already capable of converting efficiently. The pearl earrings page looked better by several surface-level measures, but the audit found a gap between content quality and decision readiness. A polished page can still produce inefficient ad spend if it does not answer the questions buyers use to reduce risk. Profitability analysis should therefore connect campaign metrics with the page experience behind those metrics.
- Avoid unsourced platform-wide statistics when explaining why monitoring matters. Claims about the percentage of searches, sellers, or sales controlled by a platform require a verifiable source. Without one, use qualified language such as “a significant and growing share” rather than presenting a precise universal figure. The same discipline applies to performance benchmarks. A CTR or CVR threshold may be useful as an internal diagnostic rule, but it should not be presented as a universal standard without evidence and category context. Anchor the analysis in the seller’s own account data: changes in CTR, CVR, ACoS, TACoS, order count, and low-conversion-term spend are more actionable than unsupported market-wide numbers.
- Separate low conversion caused by traffic from low conversion caused by the Listing. Start with the evidence chain: impressions and CTR indicate whether the offer earns attention; clicks and CVR indicate whether the resulting traffic converts; orders and ACoS show the commercial consequence. If CTR is weak but CVR is stable among those who click, the first investigation may concern relevance, creative, placement, or bid competitiveness. If CTR is healthy but CVR declines, review the detail page, price, reviews, availability, offer strength, and customer expectation. Do not automatically solve every ACoS increase by reducing bids. A lower bid can reduce spend while also reducing qualified traffic, leaving the underlying conversion problem untouched.
This was the central diagnostic issue in the jewelry account. The seller’s team initially treated the problem as an advertising or creative problem because costs were difficult to control despite strong page scores and reviews. The audit instead found a conversion constraint: the page looked refined but did not lead with the concerns most likely to delay a jewelry purchase. The competitor’s page was less polished in some respects, yet it made material safety, size guidance, and after-sales support more visible. The conclusion was not that every ad was irrelevant, but that the page was consuming relevant traffic without completing the trust process.
- Inspect order count before scaling a campaign on rising revenue. Rising attributed sales can result from a higher Average Order Value rather than stronger demand generation. Check whether order count, clicks, and CVR support the revenue increase. If order count rises while ACoS remains below break-even ACoS and TACoS is stable, additional budget may be justified after confirming inventory capacity. If revenue rises but order count falls, inspect the source of the change before increasing spend. A campaign that produces fewer orders at a higher average order value may not provide the same demand coverage or learning signal as one producing steady order volume. Use order count as a core operating measure, not a secondary detail.
- Review automated adjustments for alignment with the current profitability boundary. Automation can reduce manual bid and budget work, but it should not replace weekly interpretation. Confirm that each adjustment is still using the intended inputs, thresholds, attribution window, and break-even ACoS reference. Investigate whether a rule is responding to a temporary anomaly, a genuine change in CVR, or a shift in traffic quality. If spend moves toward low-conversion terms, examine the rule path and its targeting scope. A monitoring dashboard integrated with automated adjustments, such as DeepBI, can centralize Amazon advertising signals, reduce ad-hoc spreadsheet analysis, and flag cost anomalies in real time for review. The tool supports faster diagnosis; the seller remains responsible for validating the business context.
A useful review should also ask whether the rule is reacting to a symptom created by the Listing. If a page’s title, bullets, images, and A+ modules do not present a coherent buying argument, reducing bids may only hide the problem temporarily. In the pearl earrings case, the proposed page direction was to align these assets around a consistent sequence: desire, proof, safety, use scenarios, gifting, and protection. Automated adjustments could then operate against a stronger conversion foundation rather than continually compensating for an unclear page.
- Use weekly findings to assign a specific next action rather than producing a report with no operating decision. For each material variance, choose one action: reduce or increase a bid, reallocate budget, refine targeting, add negative targeting, inspect the Listing, adjust a rule, or continue observing because the sample is insufficient. Define the metric that will confirm or reject the action, such as lower ACoS, higher CVR, more orders, reduced low-conversion-term spend, or improved TACoS. Avoid making several unrelated changes at once when attribution matters. A focused iteration preserves learning and makes it easier to connect cause with result. Over time, this cadence converts advertising data into a repeatable control system rather than a series of reactive cost cuts.
The correct next action is not always an advertising action. When the traffic is relevant and CTR is reasonable but CVR remains constrained, inspect the page’s decision path before increasing or cutting spend. For the jewelry seller, that meant rebuilding the order of the title, bullets, images, and A+ modules so that the page answered practical risk questions earlier. The method remains the same: identify the variance, diagnose the bottleneck, choose one focused intervention, and define the metric that will indicate whether the diagnosis was correct.
- Close each review by checking whether cost control is supporting sustainable growth. The aim is not to minimize ad spend in isolation. A severe spend reduction can lower clicks, orders, CTR learning, and product visibility, while uncontrolled expansion can push ACoS above break-even and increase dependence on paid traffic. Sustainable control comes from maintaining consistent formulas, reviewing ACoS alongside break-even ACoS, monitoring TACoS and order count, and reducing the share of spend assigned to low-conversion terms. Regular iteration keeps automated controls aligned with actual market conditions and profitability. A disciplined weekly review therefore protects margin while preserving the advertising activity capable of generating qualified orders and supporting longer-term Amazon growth.
A sustainable system also checks whether the Listing is working with the advertising program rather than against it. In the jewelry case, the page began from a position of strong ratings, refined visuals, and a higher overall Listing score than its benchmark competitor. The problem was not a complete absence of quality; it was that trust and decision proof appeared in the wrong order. Reframing the page around comfort, safety, durability, fit, gifting, and after-sales reassurance gave paid visitors a clearer path toward purchase.
That leads to the central operating principle: advertising should amplify a page that is ready to convert, not compensate indefinitely for a page that leaves important questions unanswered. Before expanding budgets, verify the full chain from impression to click to conversion. If the campaign is buying relevant traffic but the Listing is not closing the decision, the most profitable advertising adjustment may begin with the page itself.