

Introduction: Why ACoS Alone Is a Trap in Today's Market
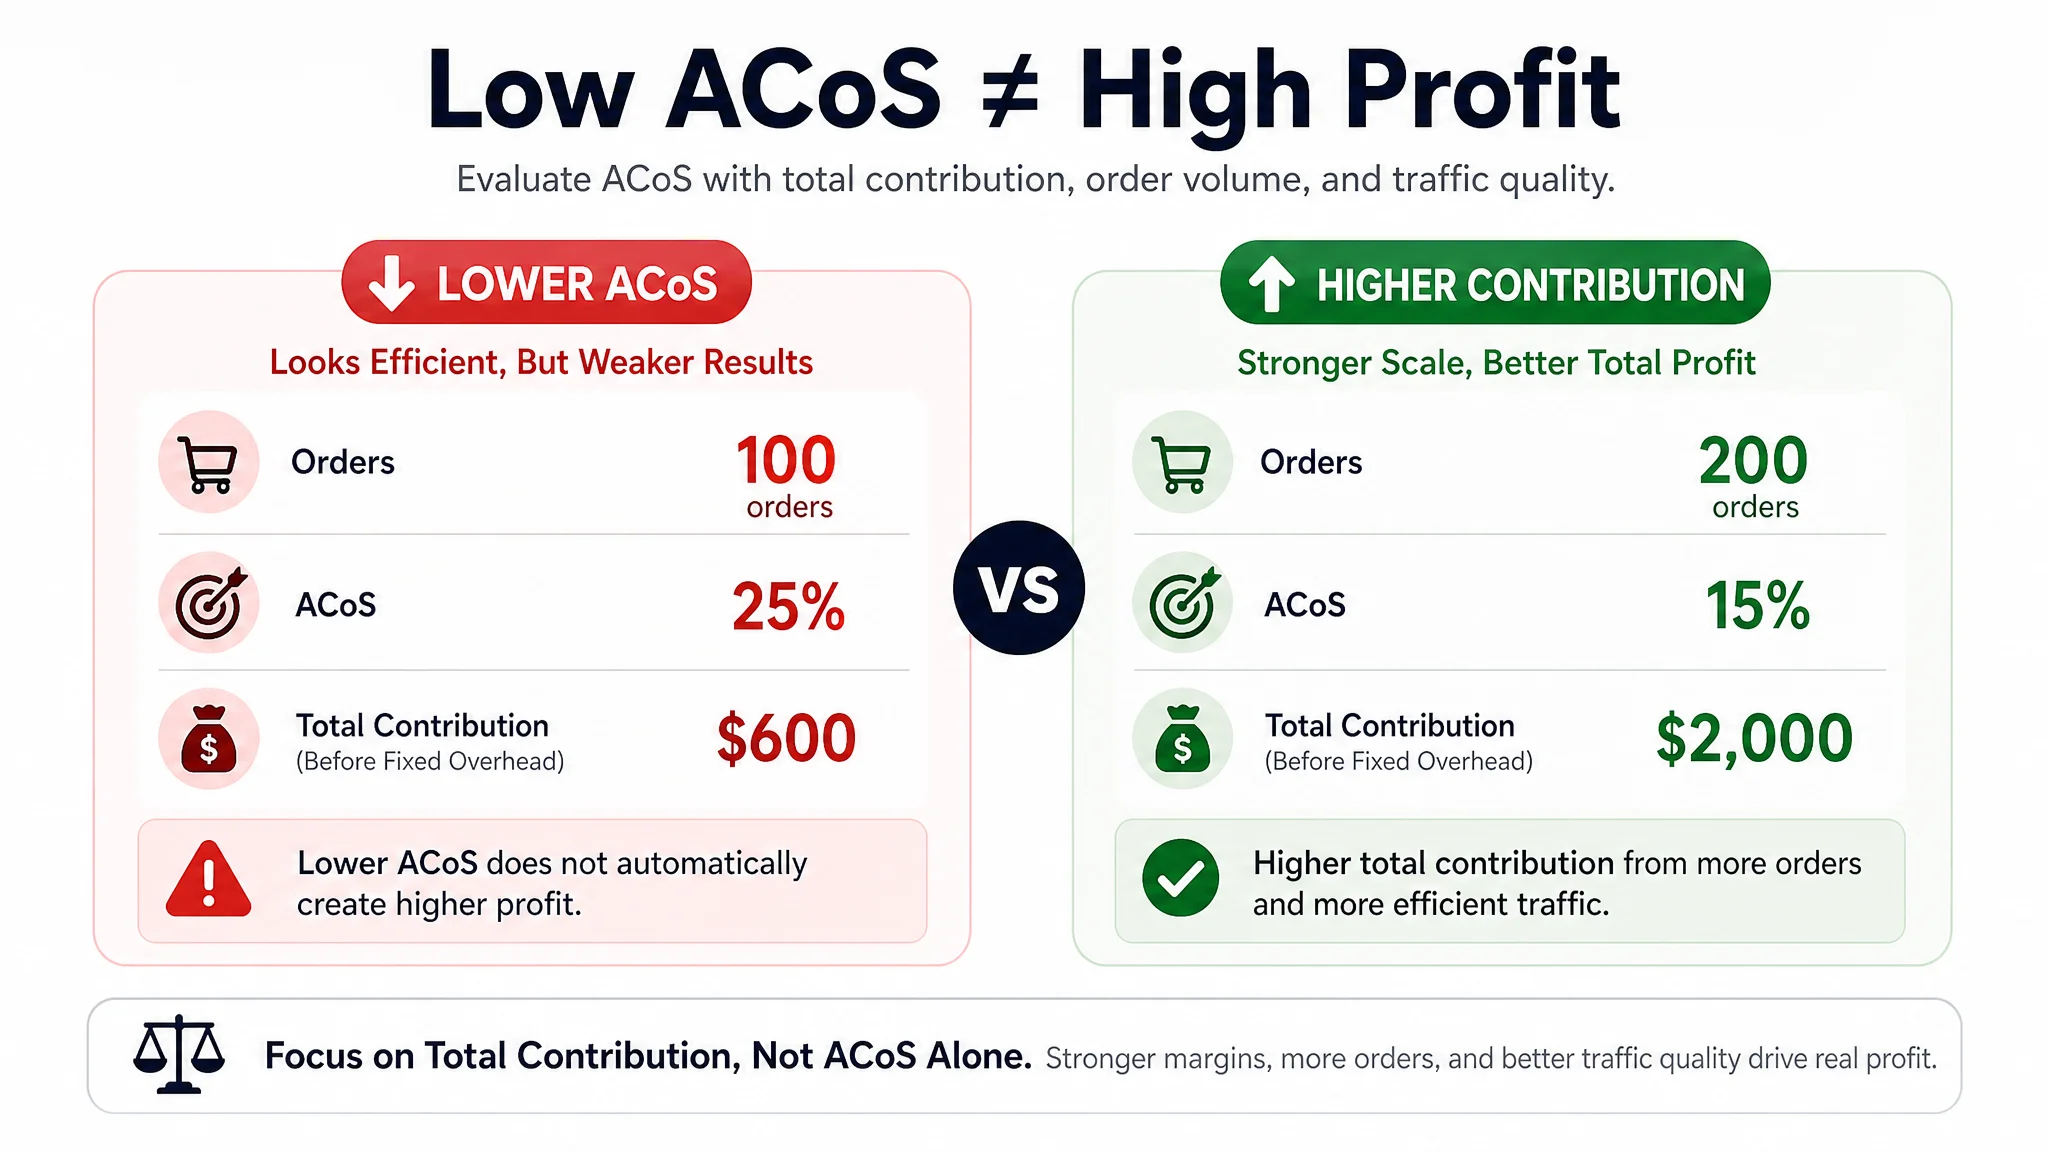
A lower ACoS does not automatically produce higher profit. Consider a product with a $16 contribution margin before advertising. At 100 orders and a 25% ACoS on a $40 selling price, advertising costs $10 per order, leaving $600 after ad spend. If stronger targeting and listing performance generate 200 orders at a 15% ACoS, advertising costs $6 per order, and total contribution rises to $2,000 before fixed overhead. The improvement comes from healthier margins, greater sales volume, and more efficient traffic—not from the percentage reduction alone.
The 2025 Amazon advertising environment makes this distinction more urgent. Competition for valuable traffic remains intense, cost-per-click is under pressure, and algorithm changes can affect how products gain visibility and convert demand. Recent industry reports also indicate that average ACoS has risen in many categories. Cutting bids simply to force the ratio lower may reduce impressions, clicks, CTR, CVR, and, ultimately, sales velocity or BSR.
Many sellers still treat ACoS as a vanity metric: an attractive dashboard figure that reveals little about total earnings. Evaluate advertising against net profit instead. ACoS should be considered alongside selling price, contribution margin, organic sales, TACoS, CTR, and CVR. Advertising data is most valuable when it shows which traffic sources and listing elements generate profitable growth.
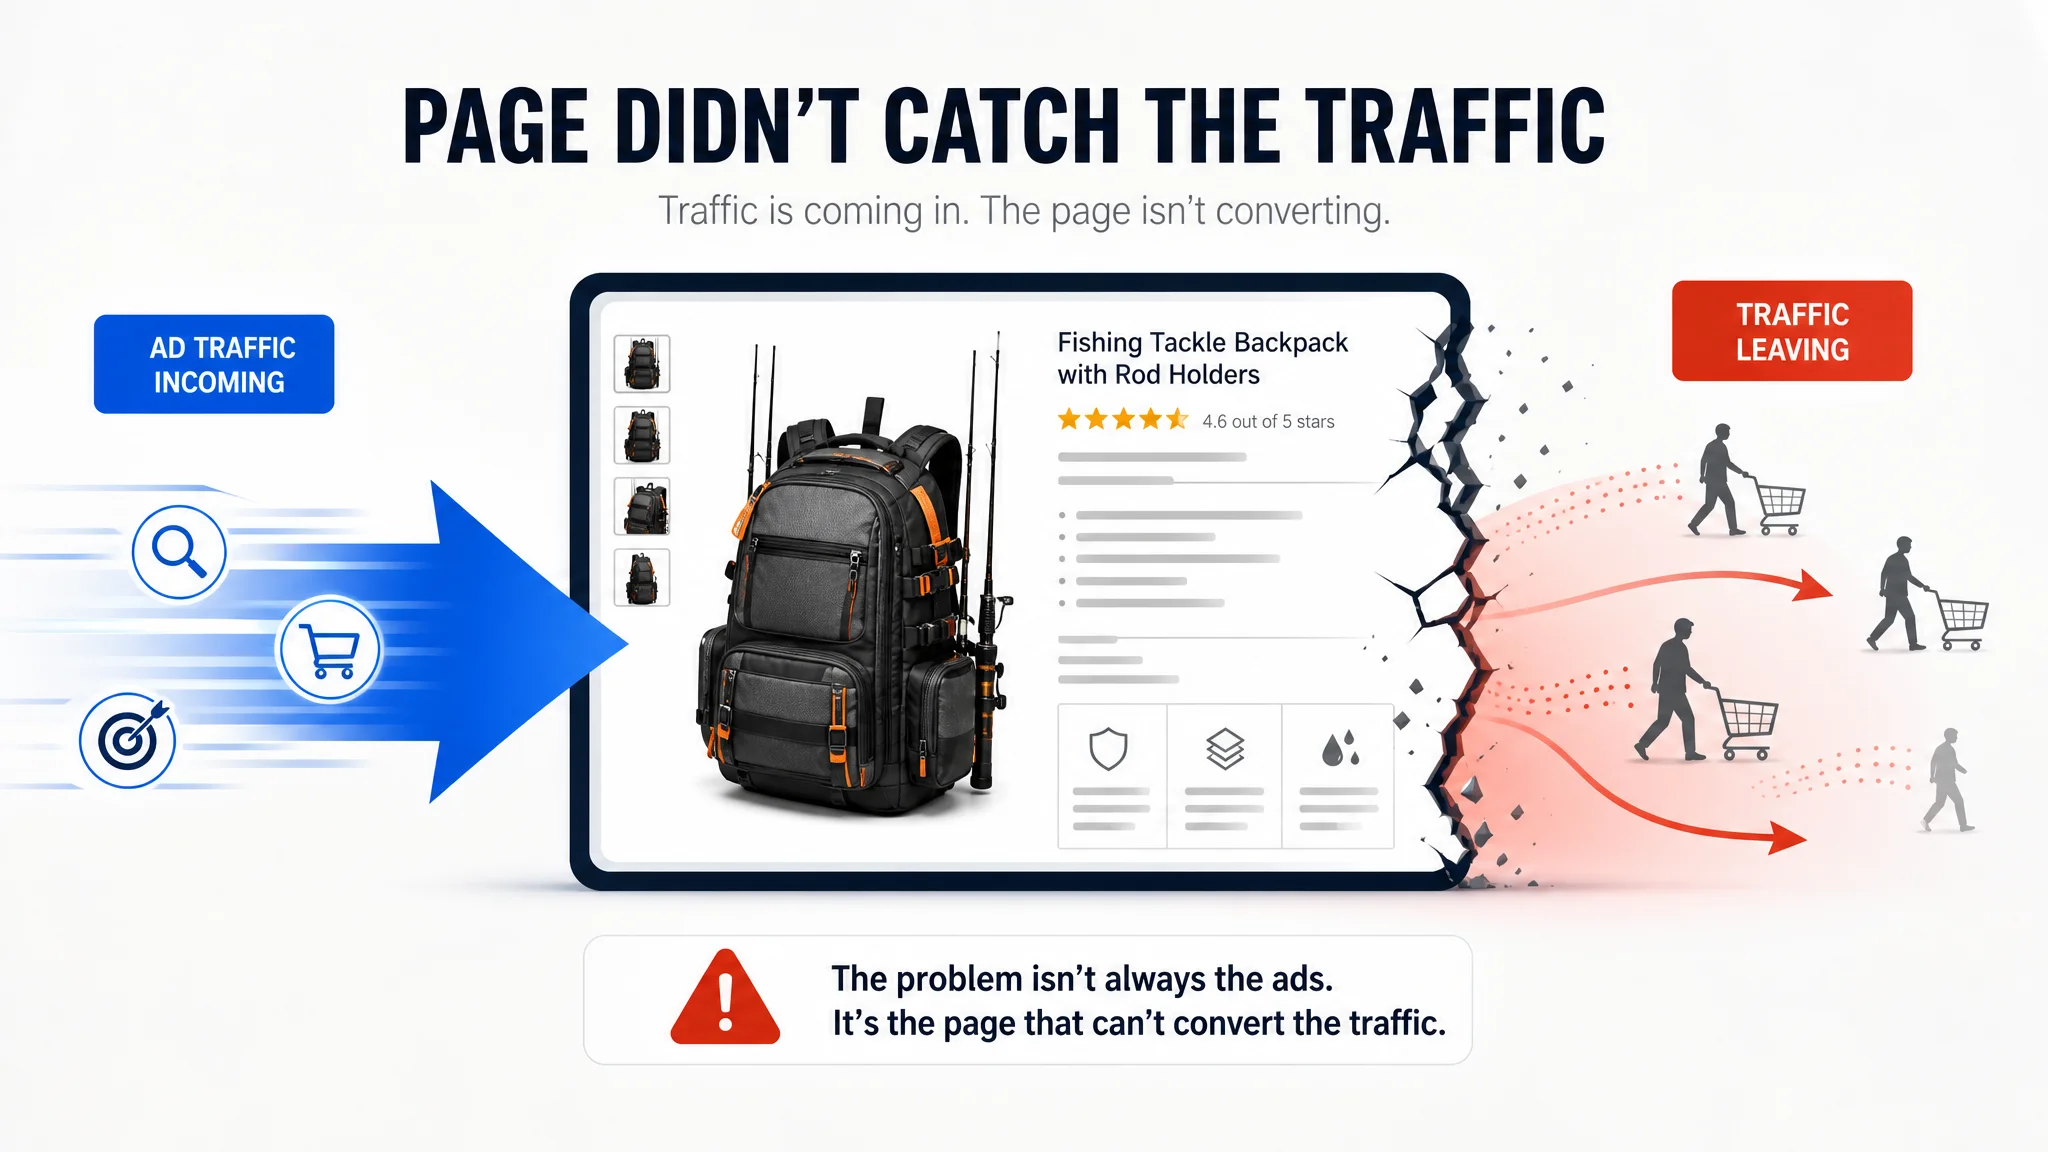
A fishing-gear seller illustrates why this broader view matters. The product page had a 4.6-star rating and more than 400 reviews, supported by a fully developed A+ page and a functional image set. On the surface, the Listing appeared strong enough to receive more traffic. Yet advertising remained difficult to control: traffic was coming in, ACoS stayed under pressure, and CVR did not behave like a page with that level of social proof. The seller initially assumed the issue was bids, keywords, or campaign structure and continued adjusting ads.
A competitive Listing diagnosis showed a different constraint. The page scored 73/100 against a category benchmark at 82/100. The largest gaps were not in reviews or the existence of A+ content, but in the title, main-image sequence, and bullets—the parts of the page that shape relevance, trust, and purchase intent before shoppers seriously evaluate the offer. In this situation, advertising was not solving a traffic problem. It was sending more visitors to a page that was not fully prepared to convert them.
Visual assets, including the main image and A+ content, are commercial drivers rather than decorative expenses; their impact should be linked to subsequent CTR and conversion performance. Optimize for the profit contribution of the business as a whole, not the lowest advertising ratio.
Decoding ACoS and Profit Fundamentals - Beyond the Vanity Metric
ACoS is calculated as:
ACoS = (ad spend / ad revenue) × 100
It indicates how much advertising cost is required to generate each dollar of attributed sales. ROAS expresses the inverse relationship—ad revenue divided by ad spend—and is useful for measuring historical campaign performance. It does not guarantee or predict future revenue because traffic quality, CVR, competition, pricing, and listing strength can change.
To establish a rational target, calculate break-even ACoS from unit economics:
- Product price: $50
- Product margin before marketplace and fulfillment costs: 40% = $20
- Amazon referral fee: $7.50
- Shipping cost: $4
- Pre-ad profit: $20 − $7.50 − $4 = $8.50
- Break-even ACoS: $8.50 ÷ $50 × 100 = 17%
If ACoS remains below 17%, the sale generates net profit under these assumptions. At or above that level, advertising consumes the available pre-ad profit.
There is no universal “good” ACoS. The appropriate threshold depends on margin, product life stage, and the objective: immediate profit, higher sales volume, stronger CVR and organic ranking, or market-share growth.
A corrected anonymized before-and-after comparison reinforces this point. In the before state, the seller focused on lowering ACoS but assessed performance too narrowly. In the after state, the seller considered broader sales, margin contribution, CTR, CVR, and total advertising dependence together. A higher ACoS can be commercially superior when it supports profitable scale and healthier long-term economics.
The fishing-backpack example adds an important qualification: even a mathematically acceptable ACoS may conceal a weak conversion system. The seller had strong ratings and substantial review coverage, but those signals did not eliminate the Listing’s gaps in search relevance, image sequencing, or buyer-oriented messaging. If those weaknesses reduce CVR, the business may respond by spending more to obtain the same number of orders. The issue is not that ACoS has no value; it is that ACoS must be interpreted alongside the page’s ability to turn paid traffic into profitable orders.
Product Research: How Choosing the Right Products Lays the Profit Foundation
Profitable Amazon advertising begins before the first bid. Product selection and unit economics determine the ACoS range your campaigns can support; bidding cannot rescue a product whose margin is already too thin. Calculate the contribution margin after product cost, fulfillment, marketplace fees, and other variable expenses, then compare it with your planned ACoS.
For example, a product with a 10% margin cannot sustainably support a 20% ACoS. Advertising would consume more than the available contribution, even if CTR and CVR appear acceptable. A product with a 40% margin, however, may support a 25% ACoS while retaining a positive contribution margin. The precise threshold depends on your cost structure, but the decision sequence remains consistent: validate the economics first, then set bids toward a profitable target.
Product economics alone are not enough. The Listing must also be capable of competing for the demand the product is targeting. In the fishing-tackle backpack case, the seller’s product had credible social proof and a complete A+ page, but DeepBI’s benchmark comparison still identified a nine-point Listing gap. The title scored 9 out of 20 against the benchmark’s 16, while the main images scored 24 versus 26 and the bullets scored 6 versus 7. These gaps did not indicate that the product lacked demand. They indicated that the page was not expressing its value as effectively as the strongest relevant competitor.
DeepBI supports this pre-advertising analysis as a data aggregation and analytics layer rather than a standalone product research function. Its market, competitor, keyword, and performance signals can help identify competitive gaps and assess whether a positioning has credible demand. The scoring service functions as an automated market health-check system, using similarity constraints to compare products with relevant visual form, function, price range, and audience. Combine these signals with your own margin data to identify high-margin opportunities before allocating spend.
Keyword exploration is central to validation. Reverse-engineering search terms from titles and bullet points, examining high-conversion terms, and connecting them with relevant category and competitor patterns can reveal how buyers discover the product and whether its positioning can generate the CTR and CVR required for a sustainable ACoS.
The same diagnosis showed why keyword validation should include the Listing itself. The benchmark led with “Fishing Tackle Backpack” and layered concrete benefits such as “Lightweight” and “Protective Rain Cover.” The target page opened with the brand name, pushing the core category phrase farther back, while using less specific language such as “Strong Materials.” The benchmark also used “Rod & Gear Holder,” covering a broader search intent than the narrower “Rod Holders.” More aggressive bidding could buy visibility, but it could not fully repair that relevance and messaging mismatch. Product research should therefore ask not only whether demand exists, but whether the page is ready to capture it.
AI-Powered Listing Optimization - Turning Clicks into Dollars
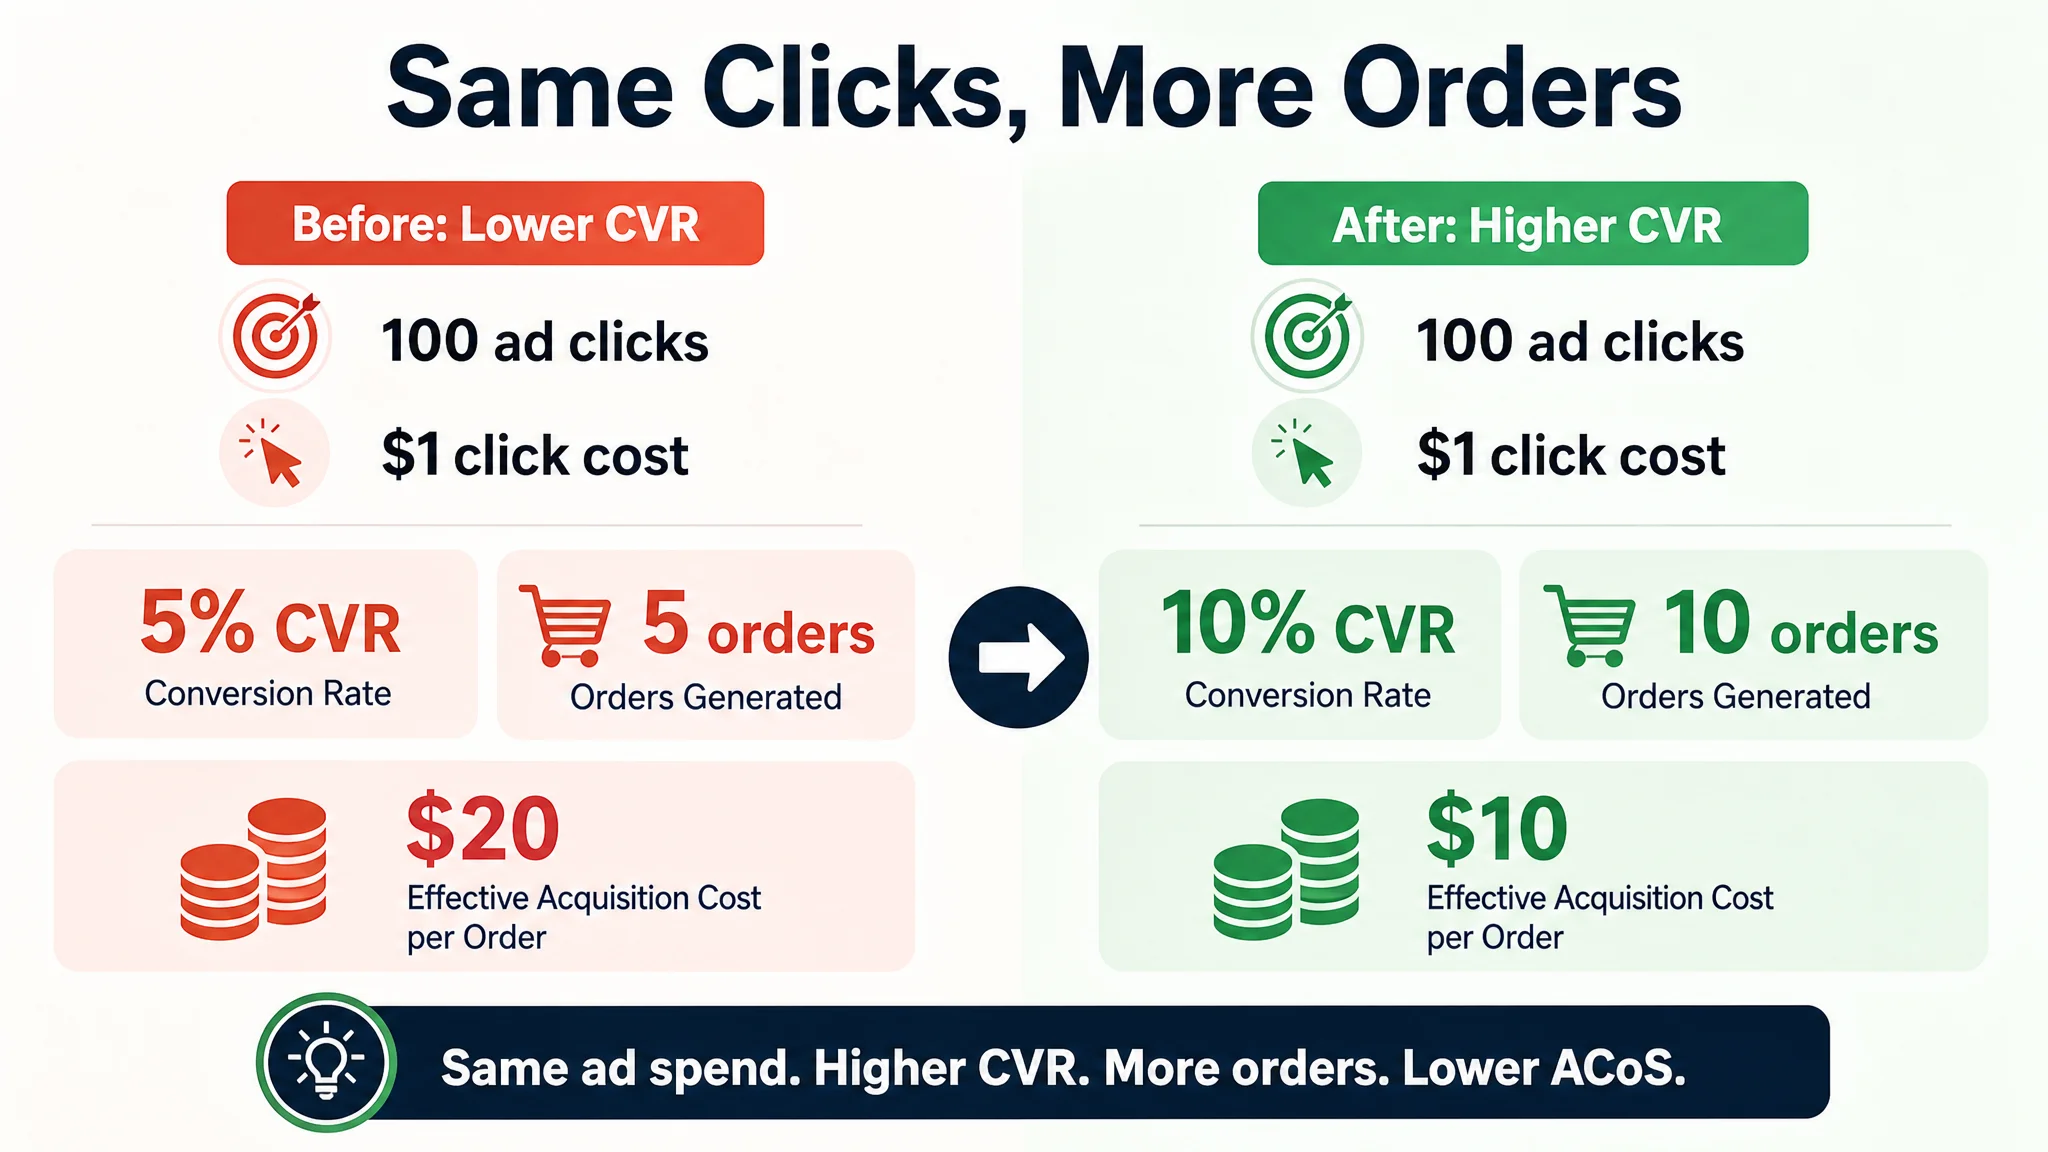
Paid traffic cannot compensate for a listing that fails to convert. If 100 ad clicks produce five orders at a 5% CVR, a $1 click cost results in a $20 effective acquisition cost. Raising CVR to 10% means the same 100 clicks produce ten orders, reducing acquisition cost to $10 without changing the bid. The same ad budget now generates twice as many conversions, improving ACoS and profit per advertising dollar.
Consider a consistent before-and-after scenario. Assume each order generates $40 in sales and contributes $16 before advertising, creating a 40% break-even ACoS. At a 5% CVR, $100 in clicks produces $200 in sales and a 50% ACoS, which is above break-even. At a 10% CVR, the same spend produces $400 in sales and a 25% ACoS, moving the campaign below break-even and creating room for profit. The listing has not reduced the bid cost; it has made each click more productive.
The fishing-backpack Listing showed how this problem can remain hidden behind apparently healthy page signals. The product had a 4.6-star rating with 441 reviews, no obvious negative reviews on the first page, and a fully built A+ section. The seller therefore treated the page as “good enough” and looked first to bids, keyword selection, and campaign types. But the page was losing conversion capacity at the front of the decision process.
The main-image issue was not poor image quality in isolation. The first image clearly showed the product with rods and pliers, but the next images moved quickly into feature maps, dimensions, and compartment layouts. Comfort and back padding—important concerns for shoppers carrying fishing gear for extended periods—appeared later. The benchmark used earlier images to establish outdoor use, comfort, breathability, ergonomics, and practical capacity. One page was primarily explaining features; the other was reducing buyer uncertainty in sequence.
The bullets created a similar problem. The target Listing mostly described functions and materials, with overlapping content between the first and fifth bullets and fewer specific, felt outcomes. The benchmark organized its bullets around themes such as versatility, resilience, and comfort, then connected each feature to outcomes including ventilation, reduced fatigue, and storage capacity. Buyers were not simply comparing the number of features; they were deciding which page made the product’s usefulness easier to understand.
DeepBI Listing supports this conversion-focused workflow through intelligent scoring and competitor benchmarking based on relevant keyword, category, price, audience, functional, and visual similarity. Its multidimensional diagnosis covers CTR, CVR, main images, titles, bullet points, A+ content, visual quality, information density, and customer-feedback signals. It then generates executable text and visuals, including revised title structures, pain-point-focused bullets, A+ concepts, and product-consistent images.
In the case, the recommended title moved “Fishing Tackle Backpack” and “Tackle Storage” toward the front, replacing vague benefit language with more concrete positioning such as “Large Capacity” and “Durable.” The image sequence was also reorganized so that the product type appeared first, outdoor use followed, comfort and breathable padding appeared earlier, and capacity was shown through a more concrete loaded-gear visualization within the product’s actual capabilities. The bullets were reframed from scattered features into focused proof points covering waterproof construction, organized storage, adjustable compartments, ergonomic comfort, and professional use.
These changes did not create a new product. They made existing attributes easier for shoppers to understand and compare. Use advertising impressions, clicks, CTR, CVR, ACoS, and TACoS to determine whether the next intervention should attract more qualified clicks or convert existing traffic more effectively. When the page is the constraint, improving Listing conversion capacity may create more value than continuing to buy additional traffic.
Amazon PPC Tool & Next-Gen Ad Automation: Engineering ACoS for Profit
With more than 350 million products estimated on Amazon, based on ScrapeHero’s 2023 data, isolated ACoS targets are too blunt for competitive PPC management. A campaign can meet its ACoS goal while wasting spend on low-converting search terms or underfunding keywords that support profitable growth.
DeepBI Ads addresses this through a four-layer traffic funnel:
- Exploration: Test broader traffic sources to collect impressions, clicks, and conversion signals.
- Coarse filtration: Remove weak segments and redirect spend away from inefficient traffic.
- Precision: Concentrate bids on keywords and audiences producing stronger CVR and more viable ACoS.
- Scaling: Expand profitable traffic while protecting TACoS and overall account efficiency.
The system uses seven-day performance data to adjust bids and budgets dynamically. Low-ROI keywords can be paused automatically, while stronger opportunities receive more controlled investment. This replaces set-and-forget campaign management, in which stale bids and delays in manual review allow waste to accumulate. The result is a shift from undirected spending to more precise targeting.
However, automation should not be used to avoid diagnosing the Listing. In the fishing-backpack case, the seller’s initial response to rising advertising pressure was to fine-tune bids, segment campaigns, and widen keyword coverage. Those actions changed how traffic was purchased, but they did not change the page’s underlying title relevance, image order, or decision logic. DeepBI therefore asked a more fundamental question before recommending continued ad iteration: Does this page deserve more traffic yet?
The diagnosis suggested that the answer was not yet. More aggressive bidding would have purchased additional impressions against competitors whose titles expressed category intent more clearly. A broader keyword mix could have increased visits without addressing why shoppers hesitated after entering the page. This is why ad automation should be connected to Listing diagnostics: otherwise, the system may optimize the cost of sending traffic into a structural conversion bottleneck.
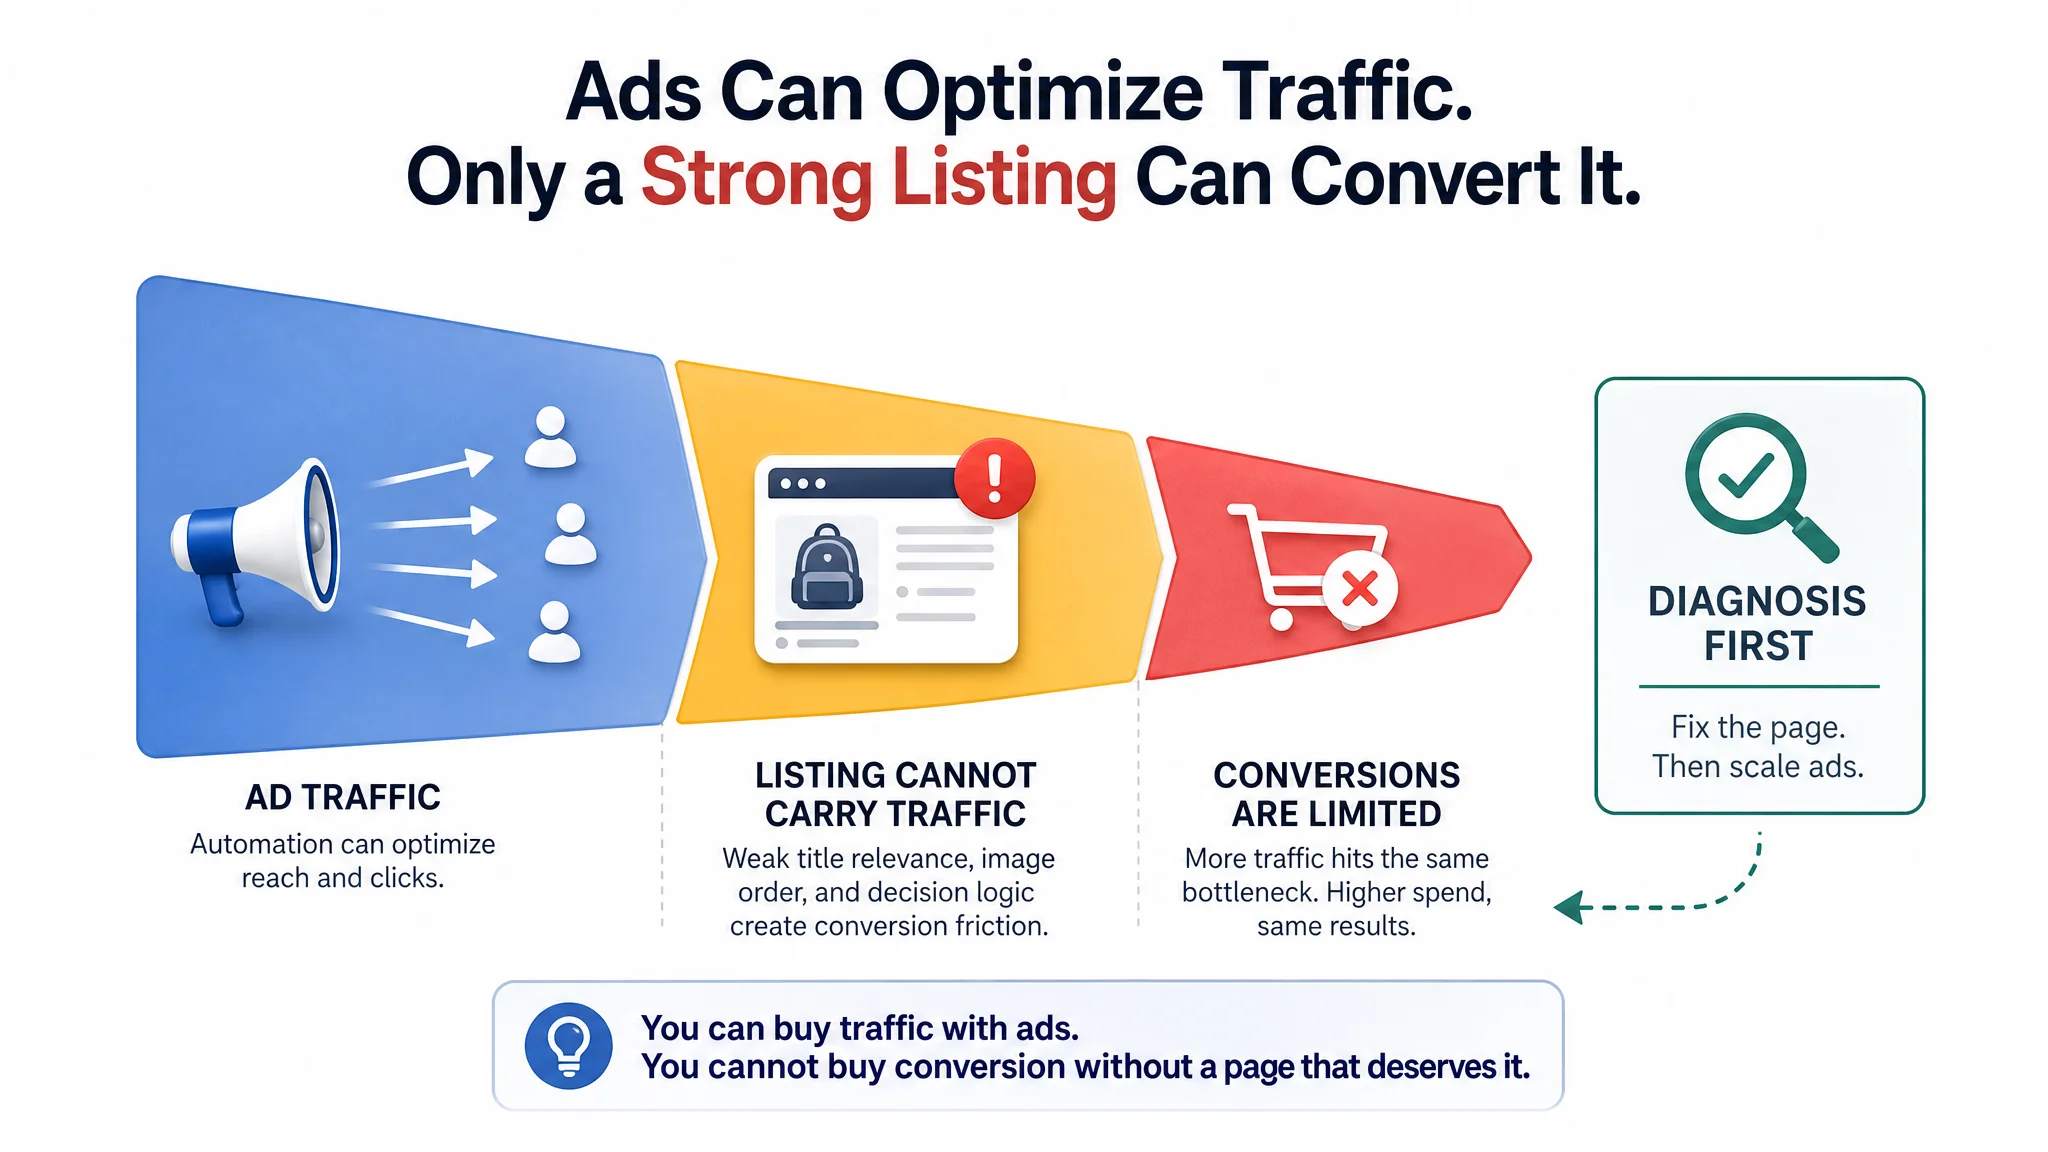
An anonymized performance pattern illustrates the mechanism: after funnel-based targeting and negative-keyword mining, ACoS declined from 41.88% to 11.15%. Evaluation should extend beyond that single figure: track whether impressions become more qualified, TACoS remains controlled, and overall advertising efficiency improves. Use the funnel to develop profitable traffic—but first ensure that the Listing can convert the traffic the funnel identifies.
Accurate Sales Data and Profit Predictions: The Profit Checker Advantage
An ad dashboard can show spend, attributed sales, and ACoS, but it cannot by itself confirm whether an ASIN is profitable. A campaign may report an acceptable ACoS while referral fees, fulfillment costs, product costs, and weak organic sales quietly erode the contribution margin.
DeepBI’s Ads profit checker addresses this gap by bringing ad spend, total sales revenue, Amazon fees, and organic sales into a single profit dashboard. Rather than reviewing disconnected reports, you can evaluate paid and organic performance together and determine whether advertising is generating profit or merely shifting revenue attribution.
The calculation must also use the correct break-even ACoS for each ASIN:
Break-even ACoS = (Selling price − product cost − accurate Amazon fees and other applicable costs) ÷ selling price
Referral fees should be calculated using the applicable percentage of sales, not replaced with an assumed flat $5 charge. That distinction can materially change the allowable ACoS, especially across different price points and categories. DeepBI uses the resulting ASIN-level threshold to flag overspending before inefficient spend compounds.
Real-time alerts identify ACoS trends moving toward or beyond the profit limit. Predictive analytics then forecast the likely outcome if current spending levels continue, providing a basis to reduce bids, reallocate budget, or investigate conversion performance before profit deteriorates.
The fishing-backpack example shows why “investigate conversion performance” must be a concrete operating step rather than a general recommendation. The seller’s page appeared safe because ratings, reviews, A+, and functional imagery created an impression of completeness. Yet the Listing score and benchmark comparison revealed that the page was underperforming in the exact elements that influence whether traffic becomes an order. Without connecting advertising data to title, image, bullet, and A+ diagnostics, the team could easily interpret the problem as an endless PPC efficiency issue.
This automation addresses two recurring failures directly: manual calculation errors and set-and-forget advertising. By replacing spreadsheet-heavy checks with automated profit analysis, the workflow can save approximately 12 hours per week while improving the speed and consistency of decisions. It also helps separate two different questions: whether advertising costs are economically acceptable, and whether the Listing is converting the traffic efficiently enough to make those costs sustainable.
The Profit Multiplier: When Ads, Listings, and Organic Traffic Work in Unison
Advertising and listing optimization should not be managed as separate projects. A stronger Listing raises CVR, allowing a larger share of paid clicks to become orders. When the same traffic converts more efficiently, ad-attributed revenue can increase, ACoS can decline, and sales velocity can accelerate without requiring proportional budget growth.
DeepBI Listing connects these improvements to measurable advertising signals. It can use stable ad data and high-converting search terms to guide title, image, and selling-point optimization while keeping recommendations grounded in verified product attributes. The operating principle is straightforward: use paid traffic to reveal conversion signals, then improve the Listing so each subsequent click has greater commercial value.
The fishing-backpack diagnosis makes this feedback loop practical. The seller did not lack positive feedback; the problem was that the page did not prioritize the information buyers needed in the order they needed it. The title underused category search language, early images explained features before resolving comfort and real-world-use concerns, and bullets listed capabilities without turning them into a clear path from problem to product outcome.
The A+ section contained strong visual material, including multiple use scenarios, pocket types, adjustable dividers, and capacity specifications. Its weakness was sequencing. Aspirational scenery appeared before enough functional proof about durability, waterproofing, capacity, and hardware. The recommended direction was to place performance evidence earlier, use close-up visuals to demonstrate how pockets and attachments function, turn size diagrams into compatibility guidance where factually supported, and finish with comfort reassurance.
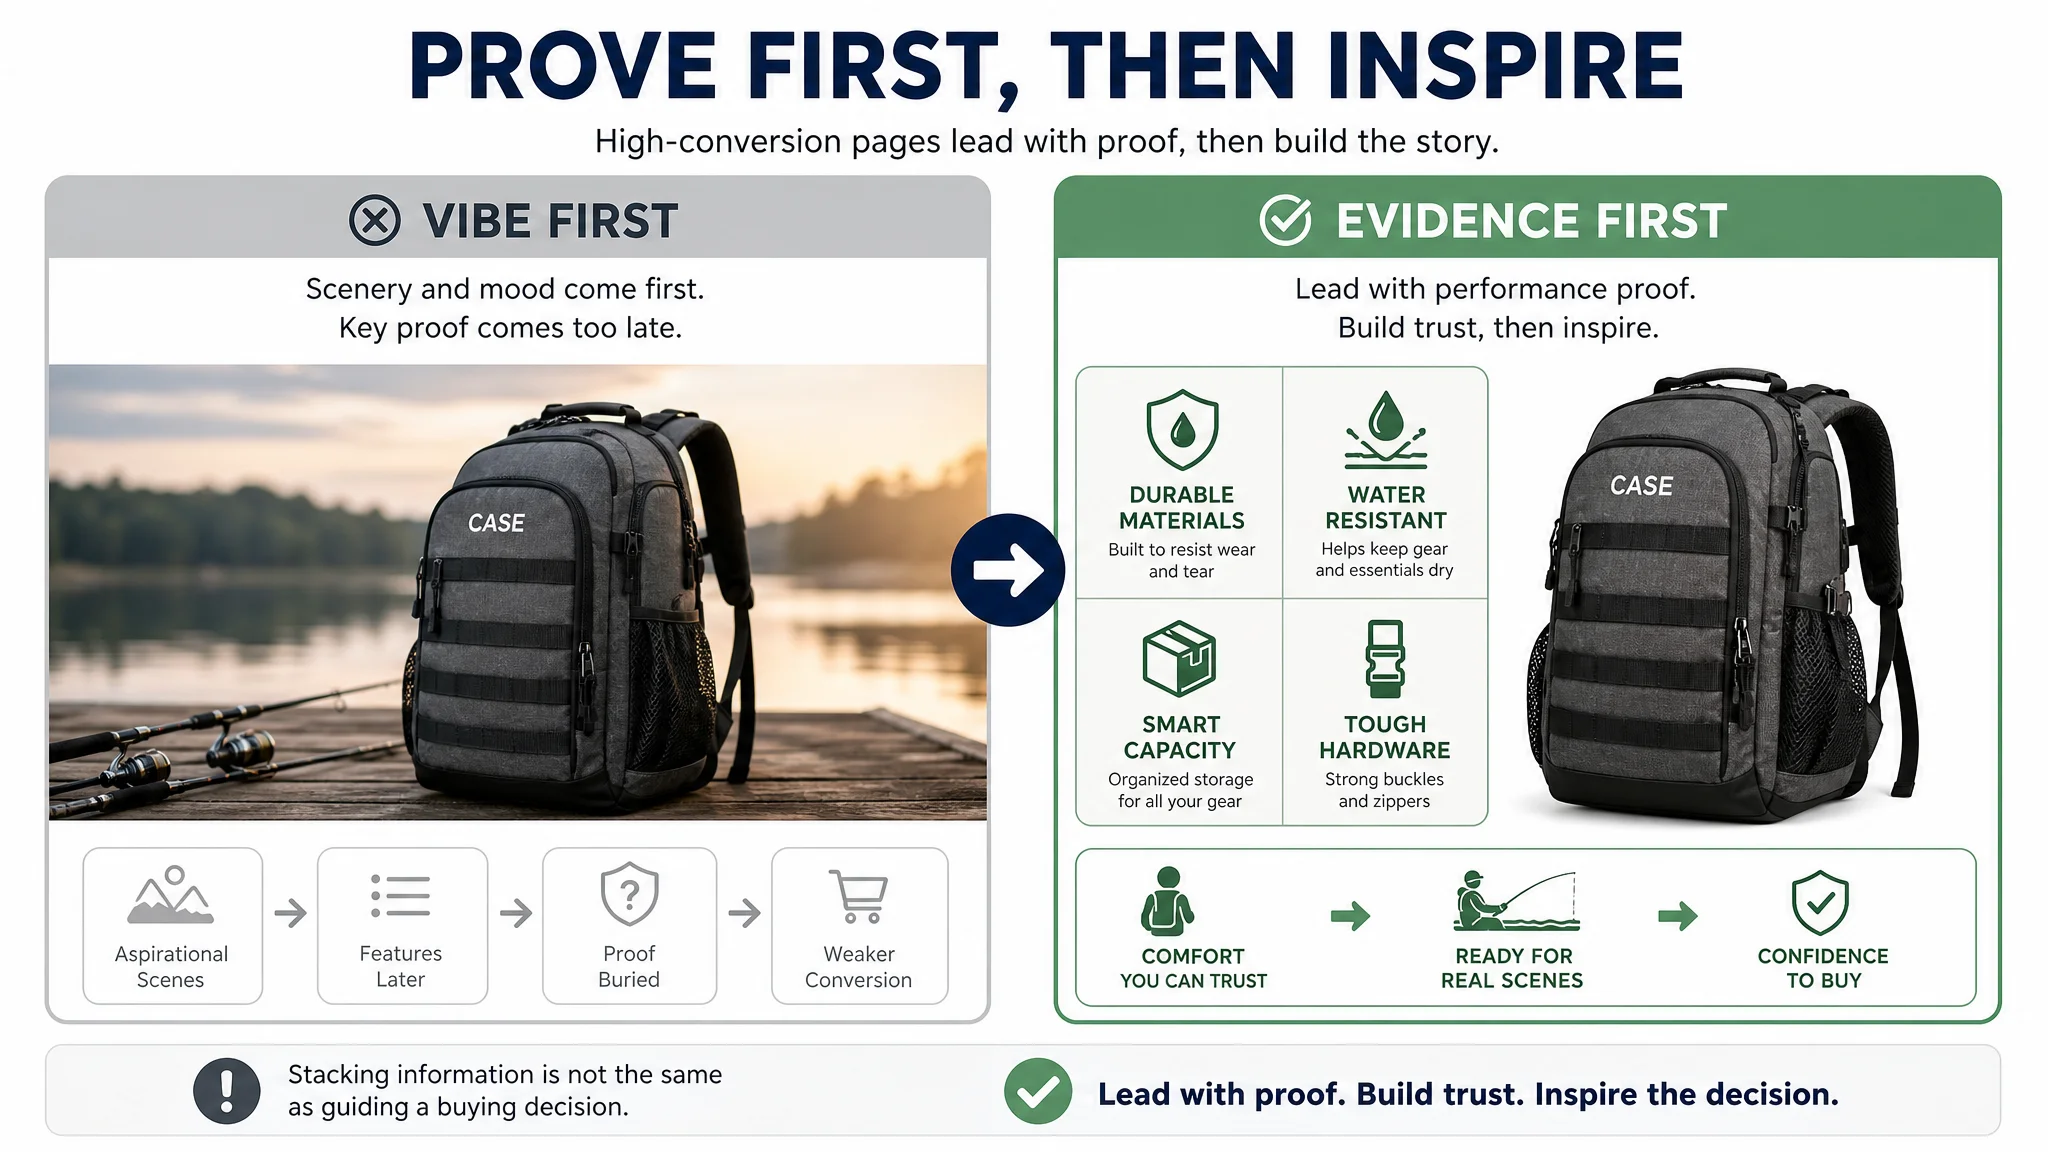
This is the difference between a page that displays information and a page that carries a buying decision. Advertising can reveal where shoppers respond, but the Listing must convert that response into trust and action. A page that leads with proof, clarifies use cases, and addresses regret risks gives paid traffic a stronger chance of producing profitable orders.
DeepBI Ads can also identify high-converting keywords for Amazon top-of-search campaigns. Use those terms to concentrate visibility where conversion evidence is strongest, then monitor CTR, CVR, ACoS, BSR, and listing cycle time rather than judging performance by impressions alone. As conversion strengthens and sales velocity rises, the resulting organic contribution can reduce dependence on paid traffic.
Evaluate the full profit equation rather than ACoS in isolation. ACoS may rise slightly during an expansion push while total profit still increases, provided incremental sales remain contribution-positive and the share of organic orders grows enough for TACoS to decline. The generalized 29.2% TACoS improvement pattern illustrates this compounding relationship; it is an analytical benchmark, not a guaranteed outcome. Optimize ads and listings as one feedback loop, and measure whether paid efficiency is improving the economics of total sales.
Conclusion: Your 2025 Roadmap to Profitable Ad Growth
ACoS is a diagnostic signal, not the destination. A profit-focused operator evaluates advertising decisions against net profit, product margin, and the ability to fund sustainable growth—not an arbitrary ACoS target.
Use the corrected break-even calculation:
- Selling price: $25
- Product cost: $10
- Amazon fee: $7.50
- Profit before advertising: $7.50
- Break-even ACoS: $7.50 ÷ $25 = 30%
An ACoS below 30% may be profitable before other expenses, while an ACoS above that level requires stronger organic sales, higher margin, or a deliberate strategic reason. Always evaluate the metric against the product’s actual economics.
Your 2025 process should connect four levers: select products with viable demand and margin, improve Listing quality to raise CTR and CVR, track true profit at the product level, and optimize advertising continuously using reliable signals. The fishing-backpack example adds a necessary operating rule: before increasing traffic or repeatedly changing bids, compare the Listing with the strongest relevant benchmark and identify whether the page can convert the traffic it already receives.
High ratings do not guarantee conversion competitiveness. A complete A+ page does not automatically establish relevance, trust, or purchase logic. In the fishing-gear case, the central issue was not a lack of praise or visual content, but the failure to prioritize search intent, comfort, capacity, and proof in the sequence shoppers use to decide. Advertising was amplifying that weakness rather than fixing it.
AI can reduce manual errors and set-and-forget failures by connecting advertising reports with Listing and creative decisions, but deployment should remain controlled and measurable. Build the workflow in DeepBI: diagnose against relevant competitors, identify the conversion constraint, generate compliant changes, approve and apply selected assets, then mark the deployment point and monitor CTR, CVR, ACoS, and TACoS. Manage the loop consistently, and let profit—not ACoS alone—determine the next move.