

What You'll Learn About ACoS and Profit on Amazon
ACoS is more than an advertising cost percentage. Used correctly, it helps you judge whether paid traffic is contributing to profitable growth—or simply buying sales that weaken your margins. The key is to define the right metrics before comparing account averages or changing bids.
You will first establish what ACoS measures, how it relates to advertising sales, and why a headline average can hide major differences between campaigns, products, and customer intent. From there, the analysis moves to break-even ACoS: the point at which advertising spend consumes the profit available from each sale. This gives you a defensible target instead of relying on industry benchmarks or arbitrary cost limits.
The guide then connects profitability to product lifecycle. Launch campaigns may prioritize discovery and conversion data, while mature products may require tighter control of ACoS, stronger CVR, and continued support for organic visibility and BSR.
Finally, you will see how DeepBI can turn advertising signals into listing optimization inputs. By connecting exposure, clicks, conversions, CTR, CVR, ACoS, and TACoS with listing diagnosis and visual-content decisions, DeepBI creates a feedback loop between ad performance and commercial execution. The objective is not to reduce spend blindly, but to improve the content and decisions that make each advertising dollar more productive.
The Clarity of Amazon PPC Data - Making ACoS Work for You
Amazon PPC reports become useful only when they connect advertising spend to profit. ACoS is a central clarity metric, but it should not be judged in isolation. Compare it with the product’s contribution margin and break-even ACoS: a campaign with a lower ACoS is not automatically more profitable if it produces weak conversion quality, limited sales volume, or little value beyond the attributed order.
DeepBI’s dynamic dashboards automatically surface profit-impact insights, helping sellers move from isolated metrics to an evidence chain. Instead of scanning impressions, clicks, conversions, and spend separately, sellers can identify which changes are influencing CTR, CVR, ACoS, and ultimately contribution profit.
The workflow also helps connect Listing improvements with advertising results. When a new image is successfully published, DeepBI marks a visual iteration event point in its ad reports. Sellers can then observe how the ASIN’s CTR changes during the following 7–14 days, creating a clearer feedback loop between creative decisions and PPC performance. For a product with high spend but poor conversion, this can reveal whether the problem is weak traffic engagement, Listing persuasion, or bidding strategy.
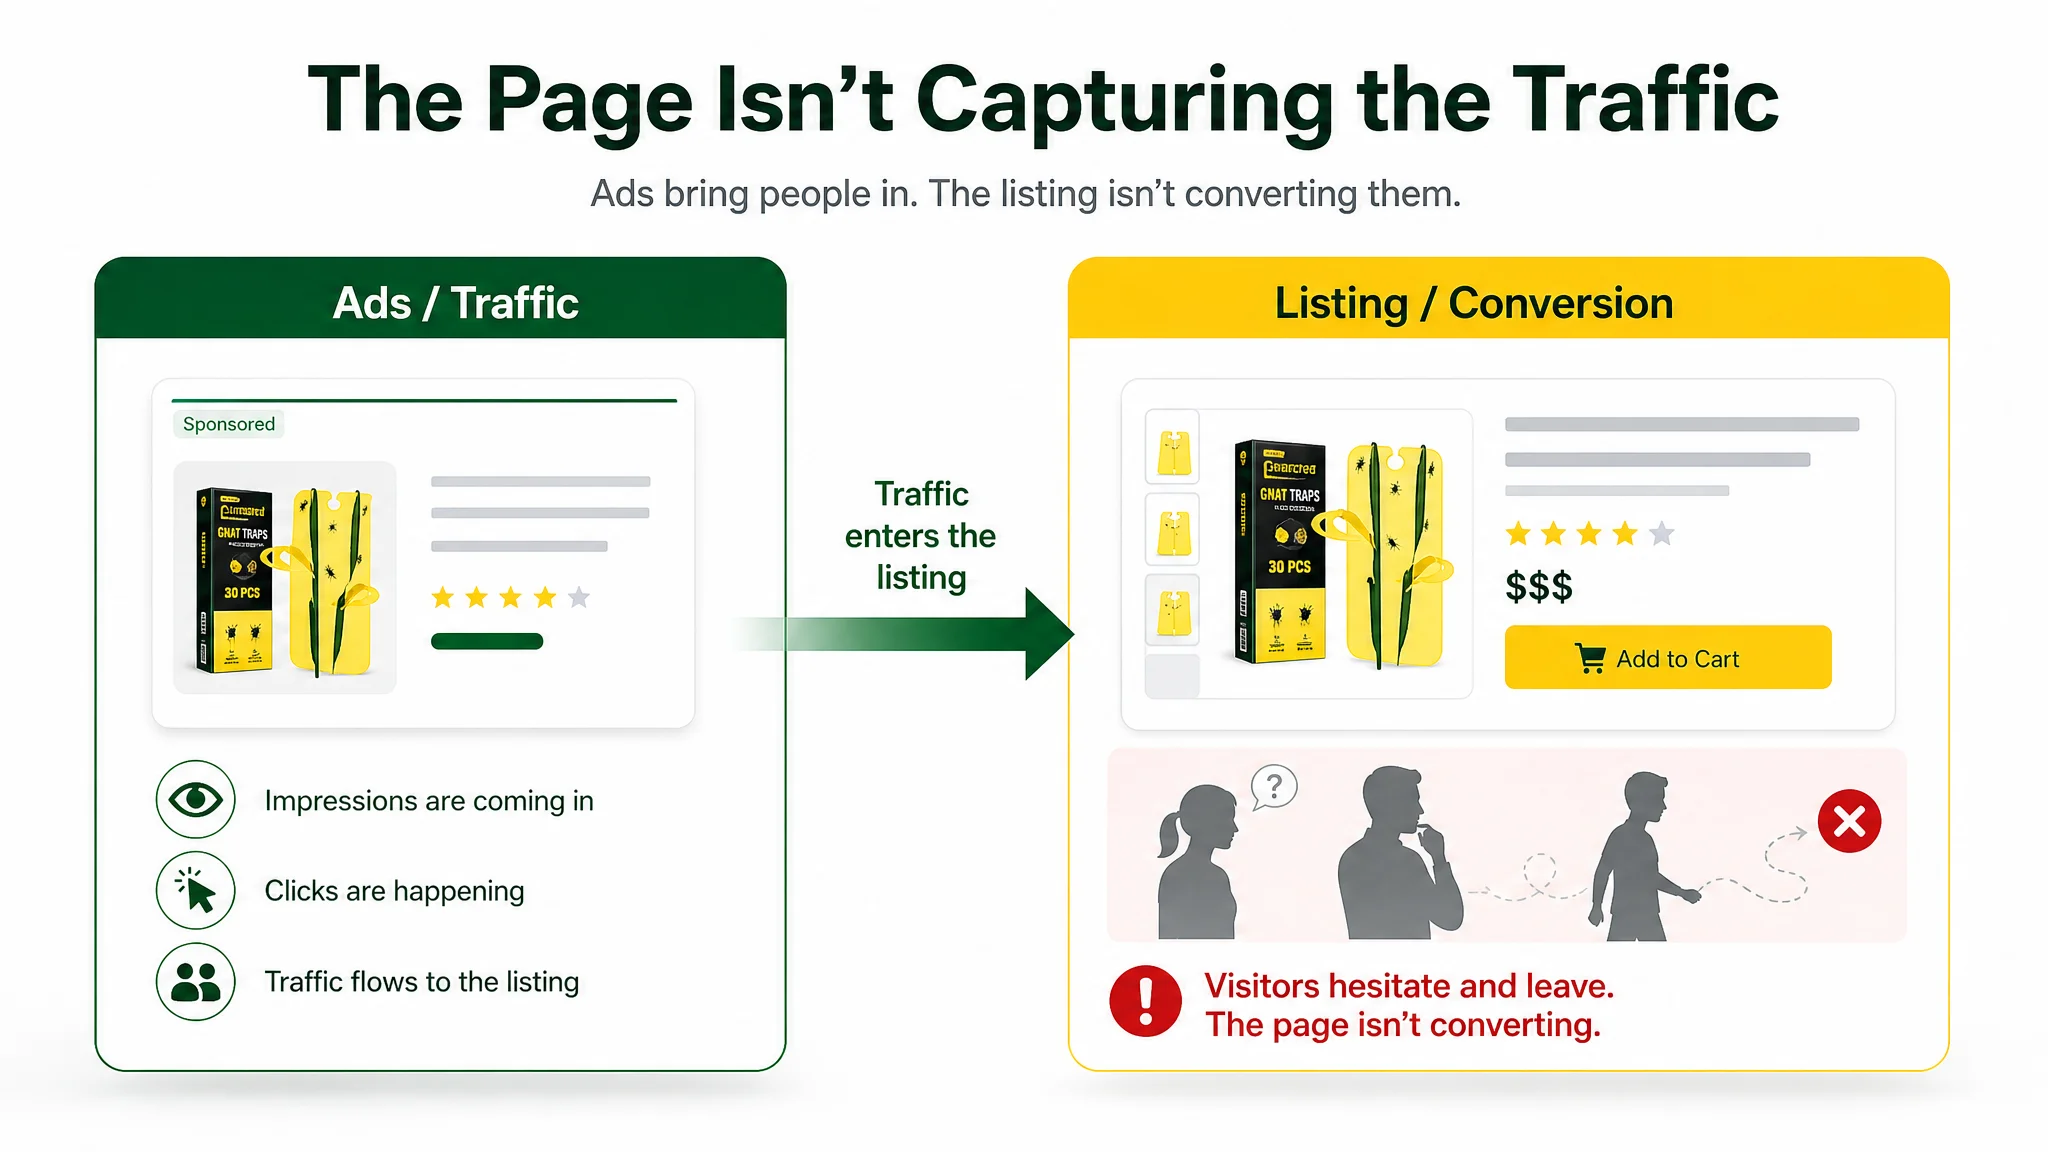
A gnat-trap seller in the US marketplace illustrates why this distinction matters. The product was receiving steady Amazon ad impressions and clicks, but orders were not growing in line with spend and ACOS was becoming increasingly difficult to control. The team initially assumed that the problem was insufficient keyword coverage, weak bids, or an underdeveloped campaign structure. However, a DeepBI comparison with a closely matched competitor showed that the more important gap was inside the Listing itself.
The customer’s Listing scored 70/100, compared with 77/100 for the benchmark Listing. The difference was concentrated in the title, Details/A+ content, and review-related trust signals—the parts of the page responsible for helping a shopper understand, trust, and choose the product. In other words, the ads were not failing to create traffic; the page was consuming traffic without converting enough of it.
The practical priority is smart bidding, not simply higher bids. A bid increase may buy more impressions while worsening ACoS if CTR or CVR remains weak. Use the dashboard to identify the constraint, set bids against profitability targets, and review the resulting KPI movement. Better decisions come from clearer relationships between spend, customer response, and profit—not from spending more by default.
Understanding the Average Amazon Seller's Ad Challenges
Amazon advertising decisions often become difficult when rising traffic costs collide with uncertain margins. A seller may know the campaign’s ACoS, clicks, and sales, yet still be unable to answer a more important question: how much profit remains after product costs, fulfillment, marketplace fees, discounts, and advertising spend? Without a clear contribution margin, the seller may not know the break-even ACoS—the point at which advertising stops generating profit.
This uncertainty encourages decisions based on gut feeling. A campaign may be paused because its ACoS appears high, even though it is attracting valuable customers or supporting organic rank. Another campaign may continue receiving budget because its ACoS looks acceptable, despite weak CVR or insufficient profit per order. Listing changes can follow the same pattern: an image may look more polished, but without structured measurement, its effect on CTR and CVR remains unclear.
A common version of this problem is to treat every weak result as a traffic-acquisition problem. In the gnat-trap case, the seller’s internal reaction to stagnant orders and stubborn ACOS was to add keywords, refine bids, adjust match types, and increase budget in the hope of catching a stronger competitor. The assumption was that the Listing was already “good enough” and that more qualified traffic would eventually lift conversions.
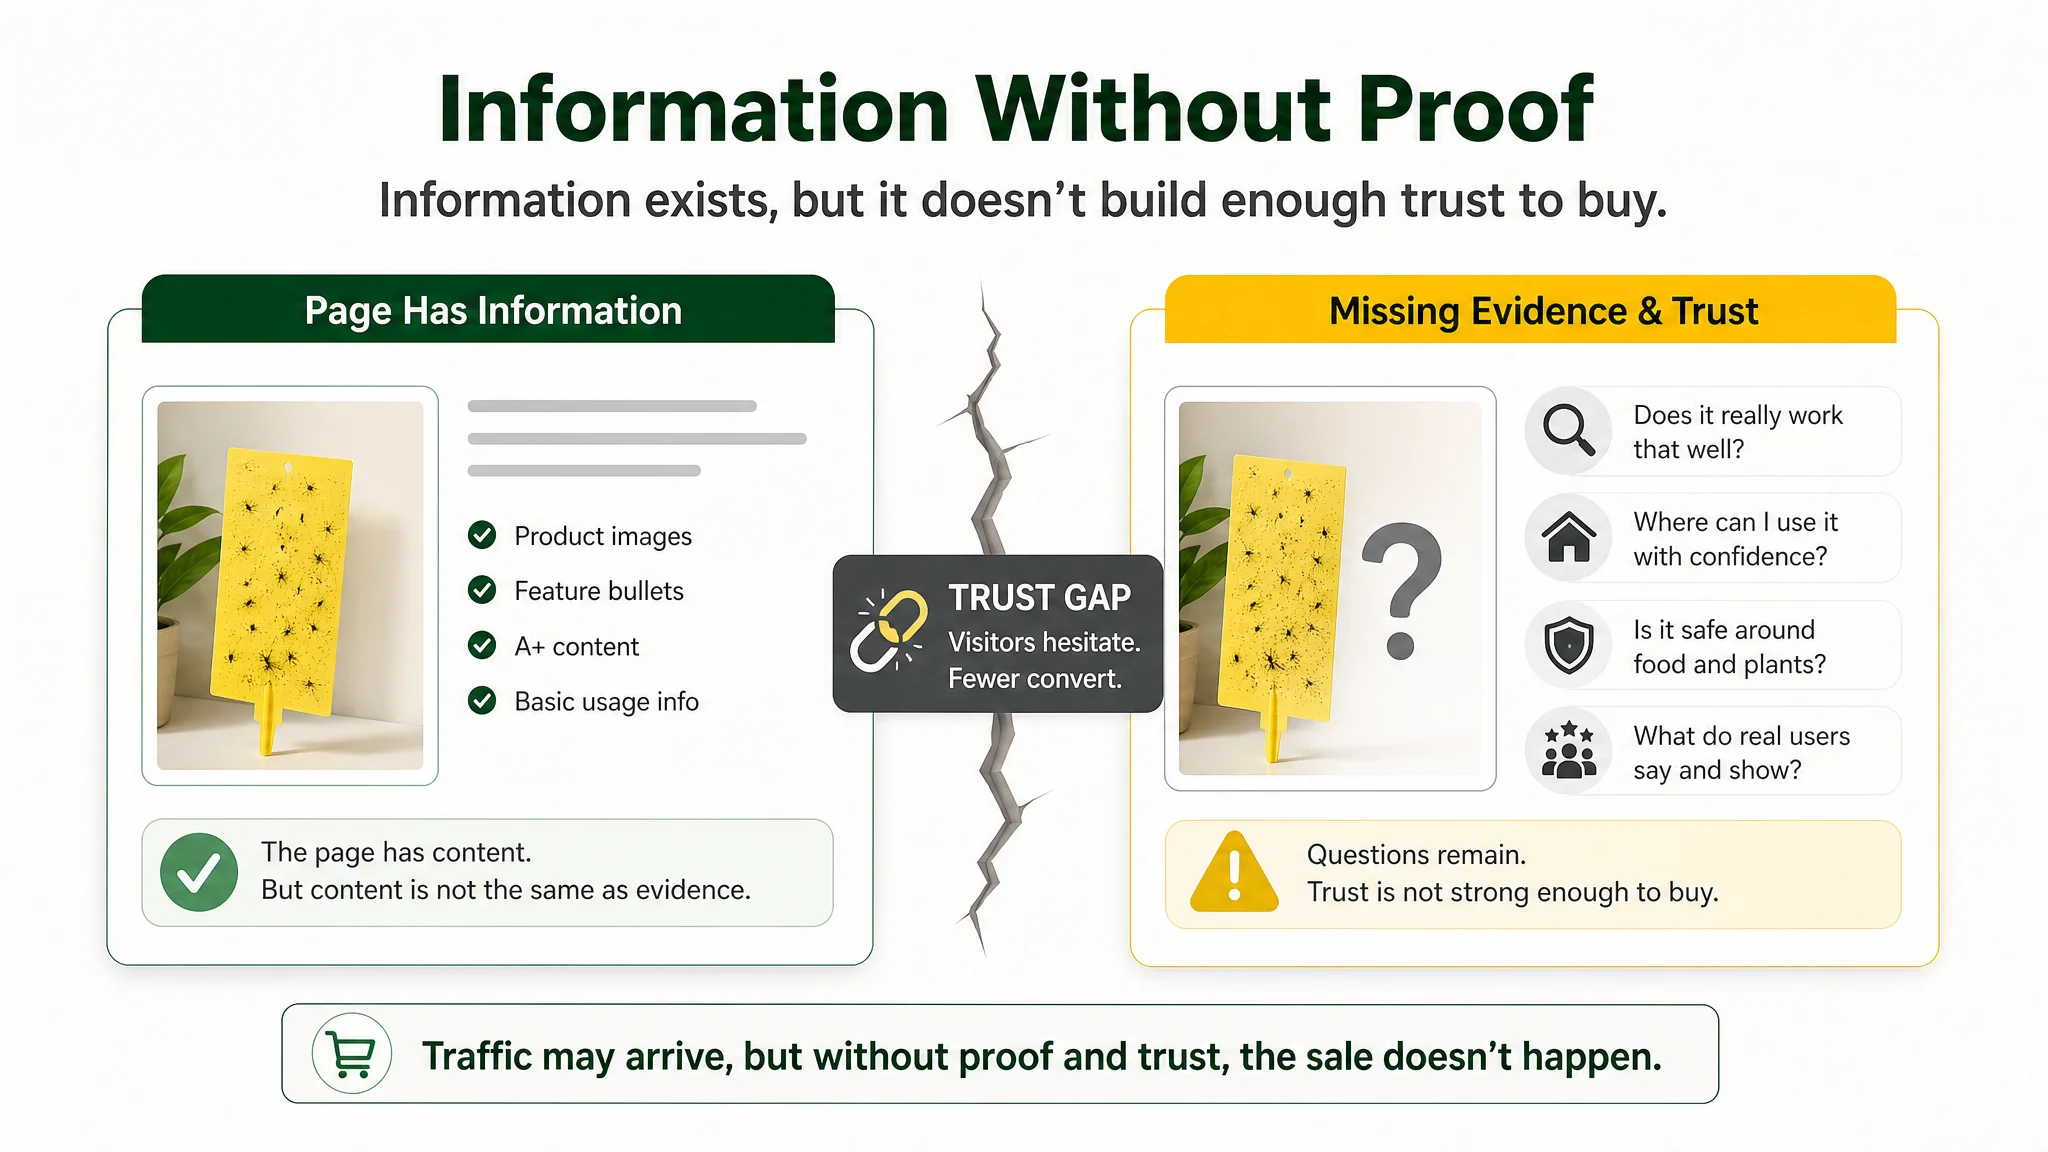
The diagnosis showed why that assumption was risky. The page had a complete image set, A+ content, reasonable reviews, and a total score that did not suggest a broken Listing. Yet the benchmark was stronger in the exact areas that influence conversion capacity: title logic, proof within the A+ content, and visual trust. The customer page contained information, but it did not establish the same level of evidence that the competitor used to answer questions such as whether the traps really worked, where they could be used, and whether they were safe around plants and food.
This is why there is no universal “good” ACoS. The right target depends on selling price, unit economics, product maturity, growth objectives, and the role advertising plays in the broader business. A launch-stage ASIN may accept a different ACoS from a mature product focused on cash flow. Sellers should therefore interpret ACoS alongside profit margin, CVR, CTR, TACoS, and organic performance rather than treating it as a standalone score.
The practical shift is from subjective judgment to a data evidence chain: define the financial baseline, identify the break-even point, and evaluate advertising decisions against both profitability and strategic goals. That evidence chain must include the Listing when traffic is arriving but buyers are not completing the decision.
A Snapshot of Daily Ad Stats and Their Profit Impact
Average Click-Through Rate (CTR) and Why It Matters
A daily advertising snapshot begins with impressions and clicks. Across a large proprietary dataset, the corrected average CTR range is 0.5%–0.8%. CTR shows how effectively an ad converts exposure into qualified traffic, but it does not determine profitability by itself. A high impression count with weak CTR can waste reach, while strong CTR paired with poor CVR can simply produce more expensive non-buying traffic.
The gnat-trap Listing shows why CTR and CVR need to be interpreted as separate stages of the same commercial path. The product’s page was not necessarily failing at every stage. Its more important weakness was that the information and visuals did not create enough confidence after shoppers arrived. A seller looking only at impressions, clicks, and ad delivery could easily conclude that the next step was to buy more traffic. A Listing diagnosis instead asked whether those clicks were entering a page capable of converting them.
That distinction matters because advertising can amplify both strengths and weaknesses. If the main image and title create a compelling search-result promise but the detail page does not provide proof, additional clicks may increase spend without improving profit. CTR should therefore be read as an early signal, while CVR and contribution profit determine whether the traffic is commercially useful.
Cost Per Click (CPC) Realities Across Ad Types
CPC must be evaluated alongside click volume, conversion rate, and selling margin. Corrected reference ranges are:
- Sponsored Products: $0.81–$1.20
- Sponsored Brands: $1.50–$2.50
- Sponsored Display: $0.70–$2.00
These ranges vary by ad type, competition, targeting, and marketplace conditions; Sponsored Products should not automatically be assumed to have the lowest CPC. Daily spend only becomes meaningful when connected to the revenue and contribution profit generated by those clicks.
A lower CPC does not solve a weak conversion path. If a product page lacks clear differentiation, visual proof, or trust-building information, cheaper clicks can still produce poor economics. Conversely, a higher CPC may be rational when the Listing converts qualified traffic efficiently and the resulting orders fit the product’s margin structure.
Conversion Rates and the Profit Connection
The corrected overall conversion-rate range is 9%–11%. Based on the corrected comparison, Amazon may generate approximately 7–8 times more conversions than non-Amazon sites, making conversion efficiency especially important when assessing ad spend.
Consider a product selling for $150. After $40 in production costs, $20 in Amazon fees, and $30 in shipping, the remaining profit is $60. That is a 40% profit margin, so the break-even ACoS is 40%. Impressions, clicks, spend, and conversions matter only after they are mapped to this margin: below 40% ACoS, advertising remains profitable before other costs; above it, the campaign loses money.
The conversion connection is also why Listing diagnosis belongs in advertising analysis. In the gnat-trap case, the page included feature descriptions and multiple visual modules, but its content did not match the benchmark’s proof structure. The competitor showed actual caught insects, multiple household settings, and a safety-oriented food scene. The customer page relied more heavily on illustrative graphics and conceptual representations. The issue was not simply that the product had too few words or modules; it was that the page did not provide enough evidence to move a hesitant shopper from interest to purchase.

A conversion rate is therefore not just a campaign output. It is also a signal about whether the product page is answering the buyer’s most important questions.
Amazon's Average CTR and Its Role in ACoS
Click-through rate (CTR) is an early signal of whether an Amazon ad appears relevant and compelling to shoppers. A commonly used benchmark for Amazon Advertising is approximately 0.5%–0.8%. Reaching or exceeding this range is usually a useful target, although the appropriate level varies by category, keyword, placement, and competitive intensity.
A higher CTR does not guarantee a lower ACoS, nor does it create a direct mathematical relationship between the two metrics. However, stronger engagement can contribute to lower CPC and improved ACoS when it reflects better ad relevance and a stronger Quality Score. More qualified clicks may also provide better signals for evaluating listing and keyword performance, while CVR remains essential for judging whether that traffic produces profitable sales.
CTR is influenced by both competition and listing quality. A product competing against highly recognizable or visually stronger offers may receive fewer clicks even when its bid is adequate. Main-image clarity, visual hooks, keyword placement, selling-point hierarchy, title relevance, and supporting A+ content can all affect click appeal. DeepBI’s Listing module evaluates these elements against closely matched competitors and converts diagnosed weaknesses into specific content or visual optimization actions. These changes can support higher CTR, but they should be validated through performance data rather than treated as guaranteed gains.
The gnat-trap comparison made this relationship concrete. The benchmark competitor began its title with “96PCS,” immediately establishing a quantity and value anchor. The customer title began with “30PCS” and repeated terms such as “Gnat Traps” and “Indoors/Indoor,” creating keyword density without the same level of decision clarity. The benchmark’s sequence was easier to scan: quantity, core product, core function, and core scenario. It also communicated “Kitchen Indoor and Outdoor,” while the customer title emphasized a narrower indoor use case.
This does not mean that adding more words automatically improves CTR. The point is that search-result content needs to function as a concise decision script. It should tell shoppers what the product is, who it is for, what problem it addresses, and why it deserves attention. A title that is technically keyword-rich but structurally difficult to scan may fail to create the same click motivation as a clearer competitor title.
For direct ACoS control, bid management remains the primary lever. DeepBI’s AdsQuant module should guide bid adjustments, while Listing optimization supports the relevance and click potential that make advertising spend more productive.
Decoding ACoS - Definition, Calculation, and the Break-Even Point
ACoS is a useful advertising-efficiency metric, but it only becomes financially meaningful when compared with the profit available before advertising costs. A campaign can produce sales and still reduce overall profitability if its advertising cost exceeds that available margin.
The ACoS Formula and a Corrected Profit Example
The standard formula is:
ACoS = Ad Spend ÷ Ad Revenue × 100
For example, assume a product sells for $150. Its non-advertising costs are:
- Production: $40
- Amazon fees: $20
- Shipping: $30
The total non-ad cost is $90, leaving $60 in profit before advertising:
$150 − $40 − $20 − $30 = $60
That $60 represents a 40% net profit margin before advertising, calculated as:
$60 ÷ $150 × 100 = 40%
ACoS differs from ROAS. ACoS shows advertising cost as a percentage of attributed revenue, while ROAS shows revenue generated for each dollar spent:
ROAS = Ad Revenue ÷ Ad Spend
At a 40% ACoS, the corresponding ROAS is 2.5x.
Break-Even ACoS: Your Profit Margin in Disguise
Break-even ACoS is the highest advertising cost the product can absorb before advertising eliminates its pre-ad profit. In the example, the available profit is $60 on $150 of revenue, so the break-even ACoS is 40%.
When all relevant non-ad costs are included, break-even ACoS equals the product’s net profit margin before advertising. An ACoS below 40% preserves profit; an ACoS above 40% makes the sale unprofitable. This reference point should guide campaign evaluation more reliably than an isolated ACoS target.
However, a mathematically acceptable ACoS does not prove that the underlying advertising structure is healthy. If the page converts inconsistently because it lacks trust or proof, a seller may see unstable ACoS even when bids and keywords are managed correctly. The gnat-trap case demonstrates this distinction: the seller could adjust the cost of acquiring traffic, but the page still had difficulty turning that traffic into orders because its title, A+ evidence, and visual trust signals lagged behind the benchmark.
Break-even analysis tells you how much advertising cost the sale can absorb. Listing analysis helps explain whether the sale is likely to happen efficiently in the first place.
Why a "Good" ACoS Depends on Profit Margin and Strategy
The Margin Context: Same ACoS, Different Outcomes
ACoS is not a profitability score by itself. It measures advertising cost against attributed sales, while the acceptable level depends on product margin, operating costs, and the role advertising plays in the business.
Consider two sellers with the same 35% ACoS. If Seller A has a 50% product margin, advertising leaves approximately 15 percentage points before other costs. If Seller B has a 30% margin, the same advertising expense exceeds the product margin and creates a loss before other operating expenses are considered. The metric is identical; the economic outcome is not.
Strategy also changes the target. A growth-oriented seller may accept a higher ACoS to increase impressions, improve CTR and CVR, build BSR, and gather demand signals that support future organic sales. An efficiency-oriented seller, particularly for an established product, may prioritize lower ACoS, stronger contribution margin, and reduced dependence on paid traffic. Neither approach is automatically correct. The right target is the one that supports the intended business objective without sacrificing profitability unintentionally.
The Listing itself can change the economics behind the same ACoS. A page that converts more of its qualified traffic can generate more orders from a comparable level of spend, while a weaker page may require additional clicks and budget to produce the same sales volume. This is why the gnat-trap seller’s initial plan to “buy more traffic” was not a neutral growth decision. Until the page addressed its trust and proof gaps, additional spend risked amplifying the conversion disadvantage rather than overcoming it.
The relevant question is not simply whether the campaign can obtain traffic at a certain cost. It is whether the combination of traffic cost, Listing conversion capacity, and product margin creates acceptable contribution profit.
Lifecycle-Based ACoS Targeting
ACoS targets should also reflect product maturity. During launch, an approximate 40%–70% range may be reasonable when the seller is deliberately investing in visibility, conversion data, and ranking momentum. For mature products, a target of approximately 15%–30% may better support efficient growth and stable returns. These ranges are directional, not universal; margin and strategy must determine the final threshold.
DeepBI’s module supports phase-appropriate ACoS targets and automatically adjusts bids, helping align campaign execution with the product’s lifecycle and profitability objective.
Lifecycle targeting should not be confused with permission to ignore the Listing. Even when a seller accepts a higher ACoS during discovery, the page still needs to turn that discovery traffic into useful conversion data. If the Listing is underpowered, the seller may spend more without generating the response signals needed to improve future decisions.
Actionable Strategies to Optimize ACoS for Profit
Long-Tail Keywords: Lower CPC, Higher Relevance
Broad keywords can generate reach but also attract clicks with weak purchase intent. Long-tail targeting narrows the query to a clearer customer need, helping sellers seek lower CPC while protecting CVR. Review search-term performance regularly and shift budget toward keywords that produce orders at an acceptable ACoS, rather than rewarding traffic volume alone.
The gnat-trap Listing showed why keyword refinement must be connected to page content. DeepBI recommended incorporating clearer use-case and product terms such as fruit fly traps, house plants, and specific pest types. The goal was not to fill the title with additional repetitions, but to create a more coherent connection between the searches being targeted and the buyer’s expected solution.
Long-tail traffic still needs a page that confirms relevance. If the keyword promises a solution for houseplants, indoor kitchens, or multiple pests, the title, bullets, images, and A+ content should support that expectation. Otherwise, even a highly relevant click can end without a purchase.
Negative Keywords: Cutting Waste, Boosting Efficiency
When a search term generates clicks without meaningful conversion, continued bidding turns it into avoidable spend. Add clearly irrelevant or consistently unprofitable terms as negative keywords after reviewing impressions, clicks, orders, CVR, and ACoS. This keeps budget available for higher-quality traffic and reduces the risk that weak queries dilute campaign profitability.
Negative keywords are useful when the problem is poor traffic quality. They are less useful when the primary constraint is that qualified visitors cannot find enough reasons to buy. In the gnat-trap case, the initial assumption focused on missing or inefficient keywords, but the diagnosis found that the Listing was also weaker in title logic, proof, and trust-building visuals. Removing search terms without repairing those conversion barriers would have addressed only one possible source of waste.
The correct sequence is to distinguish between irrelevant traffic and unpersuaded traffic. Both can produce poor ACoS, but they require different actions.
Listing Optimization: The CVR-ACoS Connection
Advertising cannot compensate for a detail page that fails to convert qualified traffic. Use DeepBI to diagnose the main image, title, bullet points, A+ content, and reviews, then address the specific barriers affecting CTR and CVR. Stronger relevance, benefit communication, and trust signals can convert more clicks without requiring proportionally higher ad spend, improving ACoS through conversion quality rather than volume alone. Listing changes must remain consistent with the product’s authentic attributes and verifiable specifications.
The gnat-trap case provides a clear example of how this diagnosis works. The Listing was not empty or obviously defective. It had a complete image set, A+ modules, reasonable reviews, and a score of 70/100. The problem was that its content did not form a sufficiently persuasive decision path when compared with a closely matched competitor.
The benchmark Listing built a stronger visual evidence chain. It showed actual caught insects, multiple rooms and use cases, and a food-adjacent safety scene. The customer Listing used core scene images, feature icons, before-and-after concepts, usage steps, and brand visuals, but relied more heavily on symbolic or illustrative graphics. The difference was not the mere presence of A+ content; it was the strength of the proof.

The review layer reinforced the same issue. The customer Listing had 4.3 stars and approximately 746 reviews, while the benchmark had 4.6 stars and approximately 5,460 reviews. The customer’s front-page review mix had a similar negative-review ratio, but the competitor had substantially more image-based review proof. For a pest-control product, shoppers may want to see actual results rather than rely only on claims. Social proof and A+ visuals therefore worked together as a trust engine.
Listing optimization also needs to translate product features into buyer-facing reasons to choose the product. For this seller, the adjustable green stake was a tangible structural differentiator. It could help users insert the trap without getting their hands sticky and provide a neater alternative to hanging traps. DeepBI’s recommendation was to make that difference visible in the title, bullet points, and A+ content rather than leaving it buried in technical description.
The revised bullet direction followed a pain-point → solution → proof structure:
- Lead with durability and adhesion by combining strong double-sided adhesive, UV resistance, waterproof properties, and the point that replacement is not needed until the trap is fully covered.
- Frame safety in direct buyer language, including non-toxic, eco-friendly, no-chemical, no-odor, and plant-safe claims where accurate and supportable.
- Present the adjustable green stake as an easy-setup advantage that keeps hands clean and provides stronger, neater support.
- Explain the bright yellow visual attraction in simple terms, connecting it to target pests and the intended capture mechanism.
- Expand the use-case narrative across indoor houseplants, kitchens, greenhouses, and gardens where appropriate.
These changes were designed to answer the buyer’s actual sequence of questions: Does it work? Is it safe? Is it easy to use? Where can I use it? Why should I choose this version?
That is the practical connection between CVR and ACoS. A more persuasive page can improve advertising economics by converting a larger share of the traffic already being purchased.
Smart Bidding and Budget Allocation
Bid management should reflect placement and time-of-day performance. Allocate more aggressively where CVR and profitable ACoS justify it, and reduce exposure when clicks are expensive but orders are weak. DeepBI’s four-layer exploration-to-scaling funnel supports progression from discovery to validated keyword scaling, while dynamic bid adjustment helps align bids with performance. Daily auto-bidding based on seven-day results provides a disciplined review cycle, replacing isolated decisions with recent, comparable evidence.
The order of operations matters. In the gnat-trap case, DeepBI did not recommend continuing to push budgets while the Listing remained structurally weaker than the benchmark. The priority was to clarify the title, strengthen the bullet hierarchy, improve the main-image system, and rebuild A+ content around real capture evidence, safety, weather resistance, multiple scenarios, and the stake differentiator.
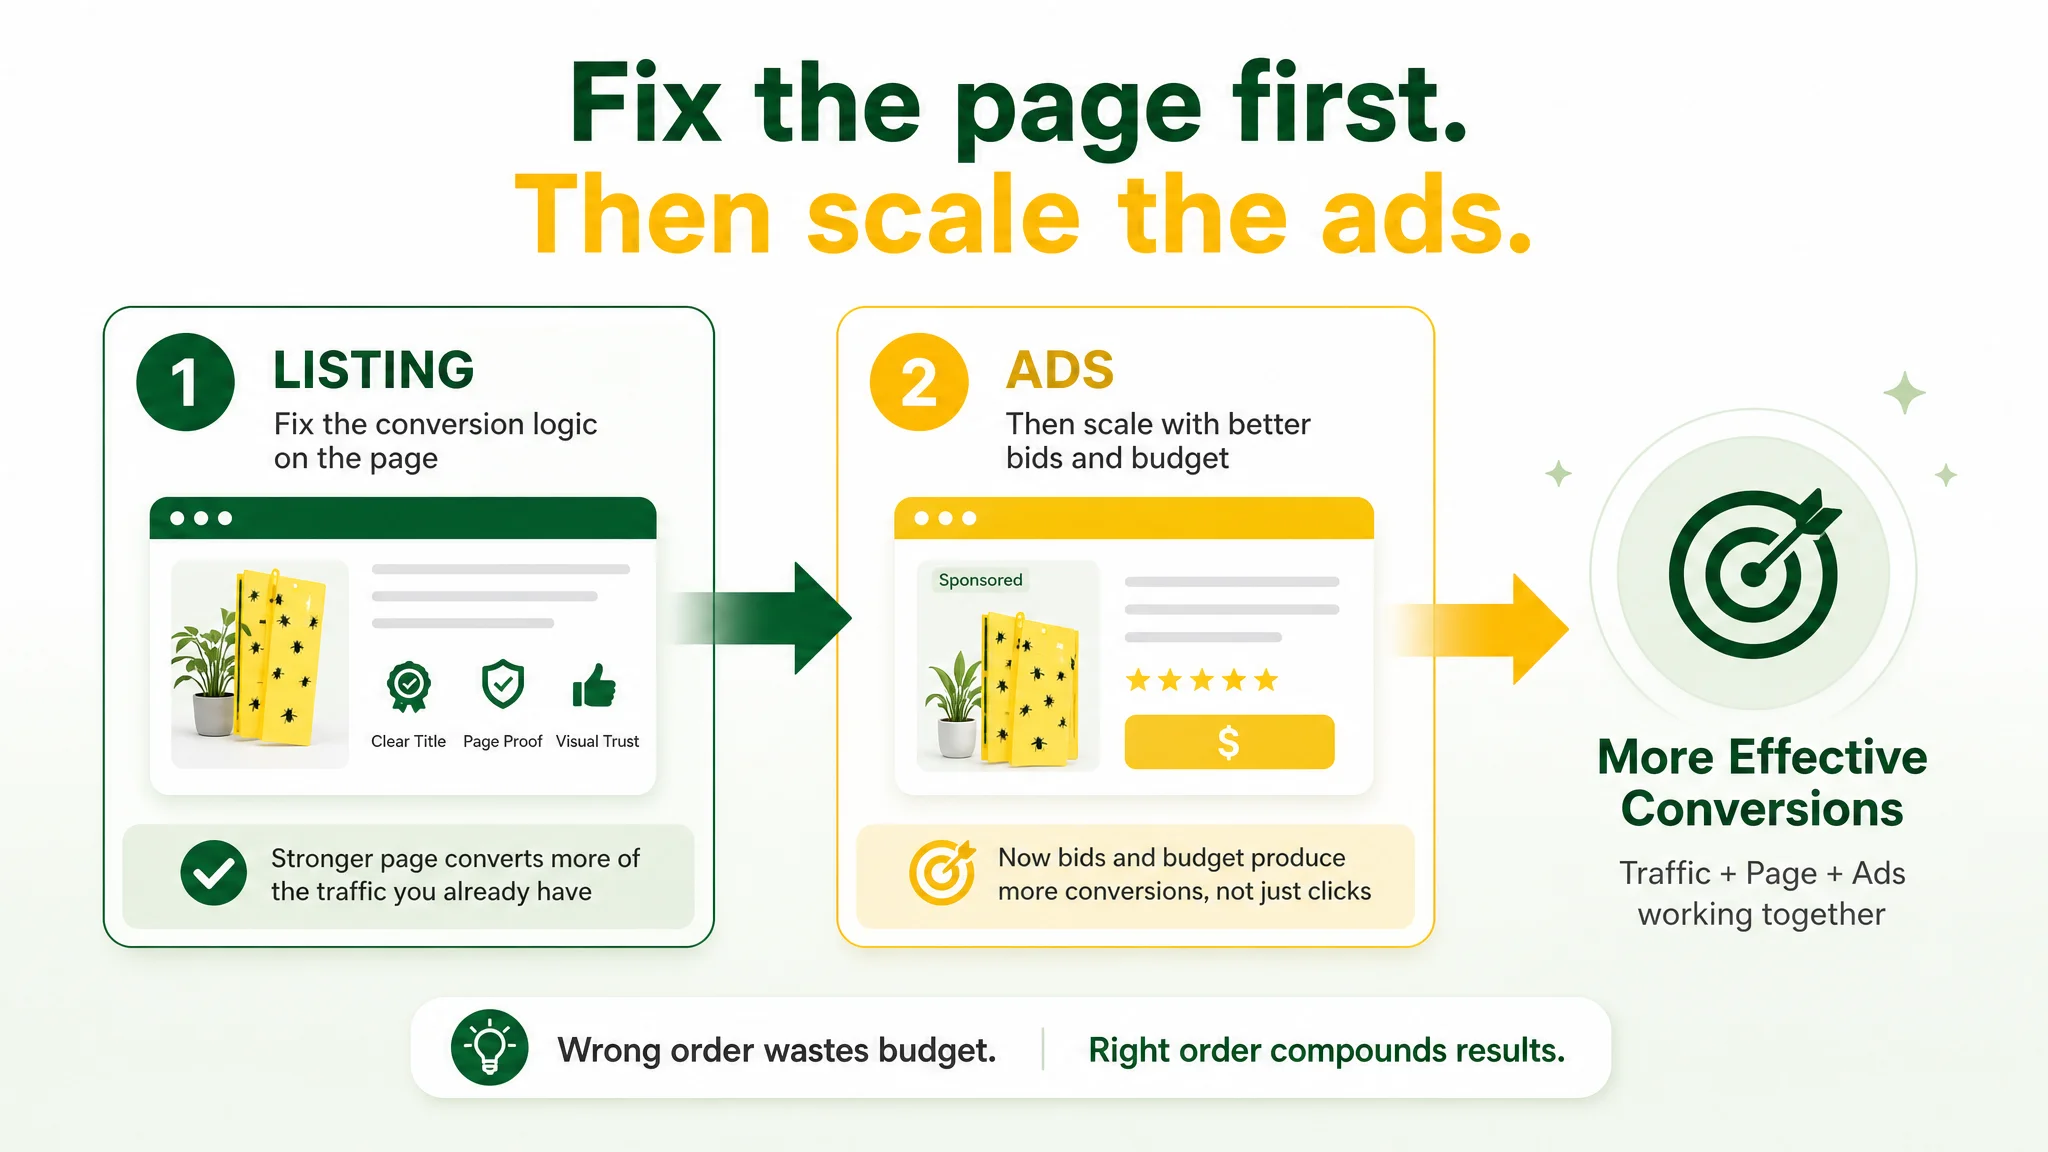
Only after the conversion logic was strengthened could bid and budget decisions become more meaningful. Otherwise, advertising optimization would mainly determine how money was distributed across a page that still had difficulty closing the sale.
Beyond ACoS - TACoS and the Path to Sustainable Profit
ACoS measures the efficiency of paid sales, but it does not show whether advertising is helping the broader business. Calculate it as:
ACoS = Ad Spend ÷ Attributed Ad Revenue
For a wider view, use TACoS:
TACoS = Total Ad Spend ÷ Total Revenue
Because TACoS includes both paid and organic revenue, it connects advertising investment with overall business growth. A decreasing TACoS can indicate that total revenue is growing faster than ad spend, potentially reflecting rising organic sales and stronger overall profitability. It is not proof of organic growth by itself, but it is a useful signal to examine alongside CTR, CVR, BSR, and contribution margin.
The practical question is how advertising data can support that outcome. DeepBI’s fifth-layer funnel uses high-performing ad keywords to support organic ranking. Ad performance helps identify search terms with strong conversion signals. AdsQuant can then concentrate budget around those keywords to support their search visibility. If the process contributes to more organic orders, total revenue may rise without a proportional increase in ad spend, allowing TACoS to decline.
The Listing remains part of this loop. A page that does not convert paid traffic efficiently is also less likely to generate the conversion signals needed to support broader organic growth. In the gnat-trap case, the seller began reorganizing the page around clearer title logic, stronger proof, better scenario coverage, and a visible product differentiator before relying more heavily on advertising. Early operating signals included a more responsive CVR, downward movement in ACOS as more clicks became orders, and a better opportunity for organic rankings and orders to recover. These observations were not presented as guaranteed outcomes; they demonstrated why page quality is a necessary condition for interpreting ad and organic signals correctly.
This creates a broader evaluation loop: use ACoS to judge paid traffic efficiency, then use TACoS to assess whether advertising is contributing to a healthier revenue mix. Sellers should review high-conversion keywords, compare their paid and organic sales contribution, and monitor whether changes in CTR, CVR, BSR, and TACoS support a more sustainable growth model.
How DeepBI Automates Profit-Driven Ad Management
DeepBI turns a profit target into a repeatable Amazon advertising workflow, with AdsQuant as the primary execution layer and Listing and Organic connected only when they influence paid-traffic economics.
- Set the commercial target first: Define the acceptable profit margin, break-even ACoS, target ACoS, budget limits, and product priorities; DeepBI then executes against those seller-approved parameters rather than replacing the seller’s judgment.
- Use AdsQuant as the operating core: Apply the four-layer advertising funnel to separate traffic, engagement, conversion, and profitability signals, so decisions are based on the complete path from impression to contribution rather than clicks alone.
- Optimize bids daily with profit in view: Use dynamic daily bid optimization to respond to changes in spend, CTR, CVR, order volume, and ACoS, directing investment toward opportunities that fit the seller’s profitability thresholds.
- Control ACoS systematically: Use the ACoS control matrix to distinguish scaling, monitoring, reducing, or stopping decisions across campaigns and keywords. This makes budget allocation more consistent than manual reactions to isolated daily results.
- Connect optimization to CVR: Use advertising signals such as search terms, impressions, clicks, conversions, CTR, CVR, ACoS, and TACoS to diagnose whether weak results stem from poor click appeal or insufficient conversion support. AI-powered Listing recommendations can then target relevant titles, images, A+ information, or selling-point communication, subject to seller review and Amazon requirements.
- Use Listing data to explain ad inefficiency: When ads are generating traffic but orders remain weak, compare Listing structure and visual proof with relevant competitors instead of assuming that bids or keywords are the only constraint. The gnat-trap diagnosis showed how a page with a complete image set and a 70/100 score could still lag behind a 77/100 benchmark in title logic, A+ proof, and review-based trust.
- Translate product advantages into conversion assets: A product feature only contributes to advertising efficiency when shoppers can recognize its value. In the gnat-trap case, the adjustable green stake was elevated from a buried product detail into a visible reason to choose the Listing, supported by bullet points, imagery, and A+ content.
- Use only where advertising data provides the bridge: Converting search terms and product attributes can guide Listing improvements that support natural visibility and reduce reliance on paid traffic over time.
- Keep human-AI collaboration explicit: The seller sets profit targets and approves commercial direction; DeepBI handles the recurring analysis, optimization workflow, and execution steps within Amazon.
The operating principle is straightforward: advertising data should not only tell sellers where to spend. It should also help reveal whether the product page is ready to convert the traffic being purchased.
Conclusion - Making Every Ad Dollar Count
ACoS is useful only when interpreted against the product’s profit margin. A low ACoS can still produce weak or negative economics when margins are thin, while a higher ACoS may be rational when the product is being launched, gaining market visibility, or building BSR. The essential reference point is break-even ACoS: the maximum advertising cost ratio the product can absorb before advertising eliminates its contribution profit.
From there, acceptable ACoS should reflect lifecycle stage, margin structure, and the role of the campaign. Long-tail keywords can improve efficiency by narrowing intent, supporting stronger CVR, and reducing wasted clicks. Negative keywords reinforce that discipline by filtering irrelevant traffic before it consumes budget and damages ACoS.
The process becomes more manageable when DeepBI connects diagnosis, strategy, production, delivery, and feedback. By combining advertising signals such as impressions, clicks, conversions, ACoS, and TACoS with Listing and visual optimization, it helps automate the complex loop of identifying weaknesses, creating improvements, applying selected assets, and observing subsequent KPI changes.
The gnat-trap Listing demonstrates why this loop must include more than campaign mechanics. The seller initially interpreted stagnant orders and rising ACOS as evidence that ads needed stronger keywords, higher bids, or more budget. A benchmark comparison instead showed that the page had weaker conversion capacity: its title was less decision-oriented, its A+ content provided less hard proof, and its review layer offered less visual persuasion. The appropriate response was not to abandon advertising, but to repair the page that advertising was sending shoppers to.

The final discipline is measurement clarity. Define revenue, profit, margin, ACoS, TACoS, CTR, and CVR consistently before interpreting averages. Then ask a second question: can the Listing earn trust, communicate value, and close the decision once the traffic arrives?
Every ad dollar should be judged not by ACoS alone, but by its measurable contribution to sustainable profit.