


When AI Tools Justify Their Cost (And When They Don't)
An AI Amazon optimization tool earns its place when manual work consumes more value than the subscription costs. That value can come from recovered operator time, lower advertising waste, fewer stockout-related sales disruptions, or additional revenue created by stronger CTR and CVR. If the tool cannot be tied to one of those outcomes, free reports, spreadsheets, and manual review may remain the better choice.
The decision should begin with a measurable baseline:
- How many hours does the current process consume each month?
- How much advertising spend, inventory value, or sales volume is exposed to avoidable error?
- Which KPI should move: CTR, CVR, ACoS, BSR, or listing cycle time?
- What threshold would cover the monthly tool cost?
The five categories below have different break-even points because the underlying operational risk is different.
Listing optimization ($0-99/month)
Listing tools are easiest to justify when a product receives traffic but fails to convert it, or when repeated content work creates a significant listing cycle-time burden. A headline rewriting tool alone is rarely enough. The stronger buying signal is a diagnostic gap across the main image, title, bullets, A+ content, and reviews, linked to weak CTR or CVR.
For example, CTR below approximately 0.35% can indicate weak main-image competitiveness, particularly when the listing also scores poorly on visual appeal. CVR below approximately 7% can signal that product detail, trust signals, A+ content, or review proof are failing to convert existing traffic. These figures are diagnostic signals, not guaranteed improvement forecasts. The financial case exists when a credible CTR or CVR improvement could generate more contribution margin than the $0-99 monthly cost.
A diagnostic workflow can compare the listing with a closely matched benchmark ASIN, quantify gaps across several dimensions, and turn those gaps into specific optimization actions. It can also connect a published visual change to subsequent advertising data, allowing the seller to observe CTR movement after the iteration rather than relying on subjective judgment. If a process that once required downloading assets, renaming files, logging into Seller Central, and uploading manually takes about 30 minutes but can be reduced to seconds, larger catalogs gain an additional time-saving rationale.
A beauty seller’s exfoliating mist set illustrates why the diagnosis must extend beyond surface-level review counts. The team initially believed that slow orders were mainly caused by having too few reviews and that advertising needed more tuning. The product had some traffic and a 4.1 star rating, but a structured comparison found a total Listing score of 59 against 84 for a benchmark ASIN. The title, main-image set, and reviews were not irrelevant, but the detail and A+ dimension scored only 3 against 24 for the benchmark. The more important issue was therefore not simply the number of reviews. The page was not explaining the product, its use, or the reason for buying a two-mist set clearly enough.
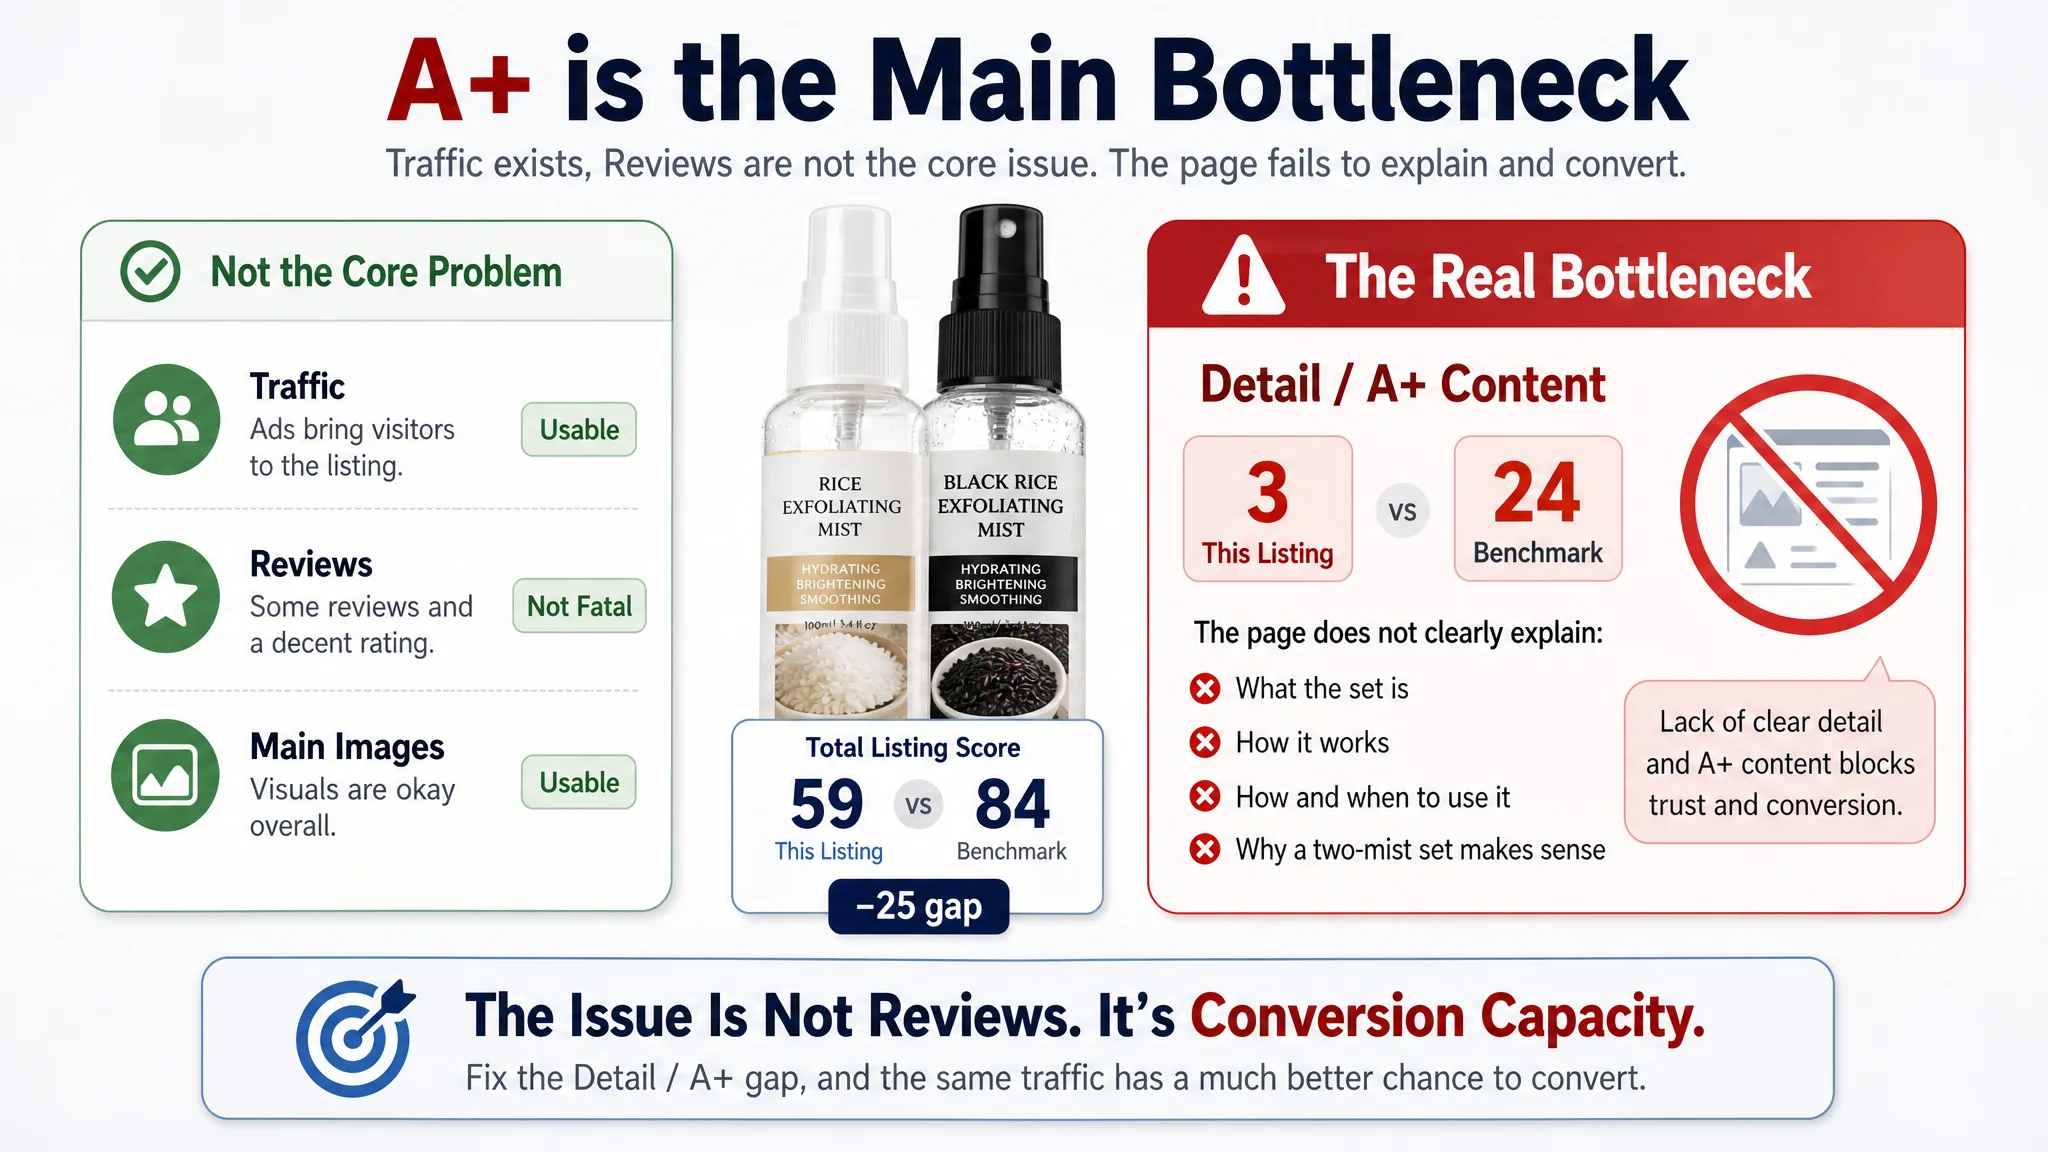
This is the type of problem for which listing optimization software can be economically relevant. A tool is not valuable merely because it generates alternative copy or attractive images. It becomes valuable when it identifies where conversion capacity is being lost and connects the diagnosis to actions that can be measured through CTR and CVR.
Do not buy when traffic is too limited to establish a meaningful baseline, the listing already has healthy CTR and CVR, or the seller lacks the margin and traffic needed to benefit from incremental improvement. Free listing audits may be sufficient for a small catalog with infrequent changes.
Repricing ($99-500/month)
Repricing becomes financially defensible when price decisions must be updated across a large catalog and manual monitoring creates either missed sales or margin leakage. A practical break-even signal is approximately 500 or more SKUs. At that scale, checking competitors, updating prices, and protecting minimum margins can absorb enough operating time to exceed the $99-500 monthly cost.
The payoff may appear through better Buy Box competitiveness, fewer delayed price responses, and more consistent margin control. Sellers should define the target before purchasing: improved conversion at a controlled margin, reduced manual hours, or stronger sales velocity. ACoS is not the primary repricing metric, but price changes can affect CVR and contribution margin, so those outcomes belong in the review.
Do not buy when the catalog is small, prices rarely change, products are highly differentiated, or the seller can monitor the relevant competitors in a short weekly routine. Manual rules and a spreadsheet may offer sufficient control without adding software cost.
PPC automation ($250-695/month)
PPC automation has a clearer threshold because wasted spend can be measured directly. Approximately $3,000 or more in monthly ad spend is a strong signal to evaluate a $250-695 tool. Below that level, the potential savings from bid and budget management may not cover the subscription, especially when campaigns are simple and the seller can review them consistently.
The purchase case should be based on ACoS control, wasted search-term spend, budget allocation, and the time required to manage campaign changes. A tool is more defensible when manual oversight causes delayed bid decisions, budget waste, or missed opportunities to scale profitable terms. The seller should compare the expected recoverable spend and operator hours with the monthly fee, rather than assuming automation will automatically improve sales.
However, a page-level conversion problem can make PPC optimization look more valuable than it really is. In the exfoliating mist case, ads were generating exposure and some clicks, but orders did not scale with spend. The team initially focused on campaign structure, keywords, and review volume. Further diagnosis showed that the page itself contained a usage contradiction: one image instructed shoppers to massage the product to promote absorption, even though the intended use was to massage until residue rolled away and then rinse or wipe it clean. More ad testing would have sent additional shoppers to a page that created uncertainty about stickiness, cleanliness, and facial safety.
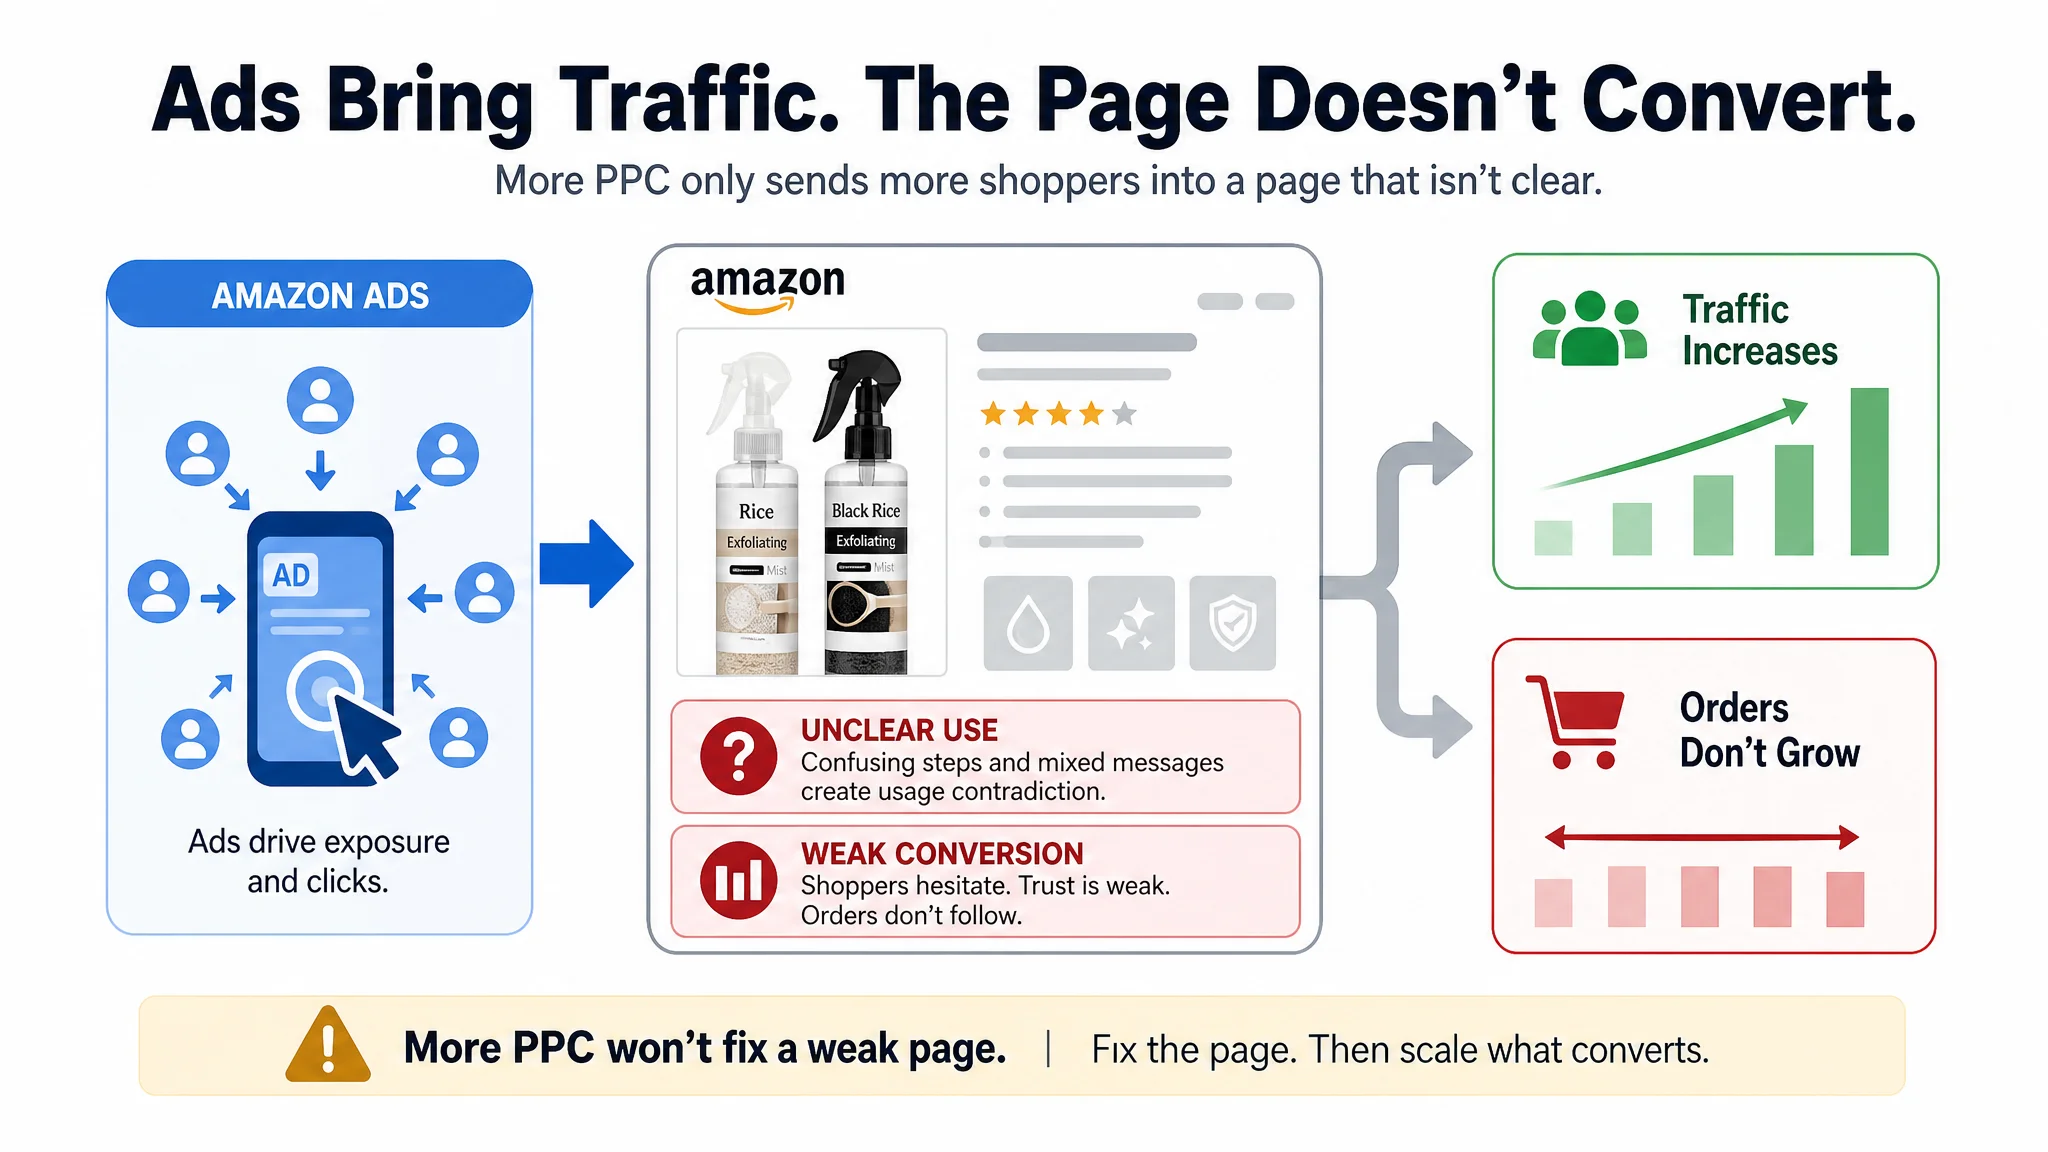
This distinction matters when calculating the break-even point for PPC software. If CVR is being suppressed by unclear product information, advertising automation may optimize the cost of acquiring traffic without solving the reason that traffic fails to become orders. A seller should first establish whether the main constraint is traffic quality, bid management, or the listing’s ability to convert qualified visitors.
Do not buy when monthly ad spend is modest, campaign structure is uncomplicated, or the seller has enough expertise and time to manage bids and search terms manually. A smaller advertiser may gain more from better keyword discipline and listing improvements that raise CTR and CVR before paying for automation.
Inventory forecasting ($49-250/month)
Inventory forecasting is justified when a stockout or overstock decision carries material financial consequences. Two practical signals are monthly revenue of $50,000 or more, or supplier lead times of 60 or more days. Long lead times reduce the ability to correct a forecast error quickly; higher revenue increases the sales and BSR exposure attached to inventory decisions.
The likely payoff is lower stockout risk, more disciplined purchase timing, and less cash tied up in excess inventory. Stockouts can harm ranking and create a recovery-period sales dip, while over-ordering can lock capital into slow-moving units. The seller should compare the $49-250 monthly cost with the margin at risk during a stockout, the carrying cost of surplus units, and the value of time saved in purchase planning.
Do not buy when lead times are short, sales are highly irregular, revenue is still low, or the catalog is small enough for a spreadsheet-based reorder routine. Forecasting software cannot compensate for unreliable supplier data or unexplained demand changes.
Review analysis ($34-140/month)
Review analysis is most useful when review volume is large enough to reveal patterns and when rating structure or negative-review themes may be suppressing CVR. The relevant input is not only the average star rating. Sellers should examine total review volume against benchmark listings, the distribution of ratings, recurring negative-review structures, and the trust value of high-quality image reviews.
A $34-140 tool can be justified when manual reading no longer reveals the dominant objections, and those objections can guide listing, product, or trust-signal improvements. The payoff should be assessed through clearer listing scoring, stronger conversion messaging, fewer avoidable expectation gaps, and improved CVR—not through an assumption that every negative review can be reversed.
The exfoliating mist example also shows why review analysis should not become a substitute for listing diagnosis. The seller’s review dimension did show a gap—8 compared with 11 for the benchmark—but it was not the largest weakness. The detail and A+ dimension had a 21-point gap, and the images and copy created confusion about how the product should be used. Reviews were part of the trust picture, but they were not the only or necessarily the dominant reason shoppers hesitated.
Do not buy when review volume is sparse, feedback is already easy to interpret manually, or the seller lacks the authority to address recurring product problems. Review data is valuable only when it leads to an executable change while preserving product accuracy and customer expectations.
5 Categories of AI Tools Every Amazon Seller Should Know
The right AI stack is determined by the bottleneck limiting growth, not by the number of features on a product page. A seller with weak listing conversion needs a different system from one losing the Buy Box, overspending on PPC, carrying excess inventory, or struggling to interpret customer feedback. The five categories below provide a practical decision map: what each tool does, when it becomes economically relevant, and where DeepBI fits.
1. Listing optimization tools
Listing optimization tools improve the assets that turn Amazon traffic into clicks and orders: the main image, title, bullet points, A+ content, secondary images, and supporting trust signals. The relevant threshold is usually a measurable CTR or CVR problem. For example, CTR below 0.35% combined with a weak main-image score signals a missing visual hook; CVR below 7% alongside weak detail-page and review signals indicates that the listing is failing to convert incoming traffic.
Amazon-native AI listing capabilities should be the baseline. They can help sellers generate or refine listing language within the marketplace workflow. Paid tools become relevant when a seller needs deeper competitive benchmarking, diagnostic scoring, structured visual direction, and faster implementation across multiple ASINs.
DeepBI is positioned in this more comprehensive layer. It benchmarks an ASIN against semantically and visually similar market leaders, scores the main image, title, bullets, A+ content, and review-related signals, then connects weaknesses to CTR and CVR. Instead of returning vague advice such as “make the image more compelling,” it can translate a benefit into production instructions covering composition, camera angle, lighting, scene elements, color, and information density.
The exfoliating mist diagnosis demonstrates the difference between a general creative review and a structured listing diagnosis. The customer’s main-image dimension appeared slightly stronger than the benchmark on paper, yet the image sequence still failed an important decision test. The first image gave too much visual weight to the model and did not immediately communicate the two-bottle set. Another image showed an outcome but did not explain the process that produced it. Most importantly, the step-by-step image contradicted the intended rinse-off use. A listing can therefore appear visually acceptable while still weakening buyer confidence through unclear decision logic.
Its AI copy and visual generation is constrained by Product DNA, helping preserve the product’s actual structure, materials, logo, and functional attributes. The system is therefore a commercial production workflow rather than an open-ended AI drawing board. Approved assets can be synchronized through Amazon SP-API and matched to the relevant listing placements, reducing manual download, renaming, and upload steps and shortening listing cycle time.
2. Repricing tools
Repricing tools adjust an offer’s price in response to competing offers, Buy Box conditions, and seller-defined margin limits. Their primary threshold is economic: use becomes relevant when Buy Box loss, price volatility, or manual price monitoring costs more than the margin protected by automated decisions.
Generic repricing software is most useful for sellers with multiple competing offers, frequent price changes, or a catalog too large for reliable manual control. The critical guardrail is not the lowest possible price; it is the minimum profitable price after Amazon fees, fulfillment costs, advertising expense, and target contribution margin. Sellers should evaluate whether Buy Box gains justify the potential pressure on margin and ACoS.
DeepBI should not be treated as a repricing system. Its listing workflow focuses on diagnosing and improving the content that attracts and converts traffic, while price, inventory, and order data remain subject to the permissions granted through Amazon’s systems. A seller facing a Buy Box problem should therefore pair listing optimization with a separate repricing decision rather than expect one tool to solve both.
3. PPC and advertising management tools
PPC automation tools manage keyword bids, budgets, targeting, and campaign decisions according to recent advertising performance. The break-even threshold is reached when daily bid and budget management consumes more time than it saves, or when inefficient spend is materially increasing ACoS and TACoS.
A useful Amazon traffic model has four layers: exposure, click, conversion, and profitability. Impressions show whether the product is entering relevant traffic; CTR shows whether the creative earns attention; CVR shows whether the listing converts that traffic; ACoS and TACoS show whether the resulting sales justify the spend. DeepBI uses recent Amazon advertising data across these layers to support daily bid and budget adjustments while also feeding impressions, clicks, conversions, CTR, CVR, ACoS, and TACoS into listing diagnosis and optimization.
That positioning is important: advertising data is not only for campaign control. It can reveal whether the true constraint is traffic quality, the main image, product information, or trust content. DeepBI connects those signals to listing copy and visual generation, then supports post-application measurement against CTR, CVR, and advertising efficiency.
In the exfoliating mist case, the ad console initially appeared to be the natural place to work because rising ad costs and slow orders were visible symptoms. Yet the listing comparison showed a total score of 59 against 84 for the benchmark, with the largest gap in detail and A+ content. The product had traffic, but the page did not clearly define what each mist did, how the set should be used, or whether the product should be rinsed. This meant that the same advertising data could be misread as a targeting problem when it was partly evidence of a page-level conversion problem.
4. Inventory management and forecasting tools
Inventory forecasting tools estimate future demand, replenishment timing, stockout risk, and excess inventory exposure. Their relevant threshold is operational complexity: they become valuable when lead times, order quantities, sales volatility, and cash tied in stock make manual forecasting unreliable.
Generic systems can help sellers protect BSR momentum by reducing stockouts while limiting unnecessary capital allocation to slow-moving units. A practical break-even test compares the tool’s cost with the expected impact of avoided lost sales, emergency freight, storage expense, and obsolete inventory.
DeepBI is not an inventory forecasting or replenishment platform. Its role is narrower: improve the listing and use advertising feedback to strengthen traffic and conversion decisions. Inventory planning should remain with a dedicated system that has the necessary demand, supply, and stock inputs.
5. Review analysis and customer sentiment tools
Review analysis tools organize star ratings, review volume, sentiment themes, and recurring complaints to identify customer-perceived weaknesses. The threshold is reached when review volume is too large for manual reading or when rating distribution and recurring issues are affecting CVR and trust.
Generic review systems may support structured sentiment monitoring and issue prioritization. DeepBI uses review quantity, star distribution, and high-quality image reviews as one listing-analysis signal alongside images, copy, and A+ content. It can help identify a trust or information gap that should influence listing optimization, but it is not an independent review management or customer-response system.
The central lesson is that reviews should be interpreted within the entire conversion system. A low review count may create a disadvantage, but it does not explain every weak order trend. In the mist-set diagnosis, the review gap was smaller than the A+ gap, while contradictory usage instructions introduced a separate source of doubt. Reviewing sentiment without examining the page’s content and visual logic would have produced an incomplete explanation.
From Free Amazon AI to DeepBI: A Listing-First Optimization Path
Amazon native AI tools are the baseline, not the ceiling
For a new or recently launched ASIN, Amazon’s native and free AI listing capabilities are a sensible starting point. During the first three to six months, sellers can use them to establish a workable content baseline, test product positioning, and learn which listing elements require the most attention. At this stage, the priority is not to purchase every optimization platform. It is to create a repeatable process for improving the main image, title, bullets, A+ content, and supporting visuals while monitoring CTR, CVR, ACoS, and BSR.
Free tools are most useful when the listing is relatively simple and the seller can still review each recommendation manually. They can help accelerate routine copy production, but they do not automatically provide a complete competitive explanation. A seller may receive a title or image suggestion without knowing whether the real constraint is weak visual differentiation, poor keyword placement, missing trust information, or a failure to address customer concerns reflected in reviews.
The exfoliating mist seller’s first interpretation shows how this gap can lead to the wrong investment. The team saw low review volume and rising ad costs, so the initial discussion centered on collecting more reviews and tuning ads. A deeper comparison instead found that the title was only slightly behind the benchmark, the main image was not simply unattractive, and the review dimension was not the largest gap. The page’s detail and A+ content lacked the visual story needed to explain the product. Free tools might help produce isolated copy, but they would not necessarily expose the underlying conflict between the product’s intended use and the instructions displayed in the image sequence.
That gap becomes more expensive as the catalog expands. Manual work often involves exporting assets, renaming files, comparing competing ASINs, recording changes, preparing replacements, and checking advertising results afterward. Sellers should track this AI-related listing work rather than treating it as invisible overhead. If it consistently exceeds approximately 10 hours per week, the cost is no longer only labor. Delayed updates can extend listing cycle time, slow CTR or CVR improvement, and leave advertising spend exposed to weak conversion.
DeepBI diagnostic, benchmark, and optimization loop
DeepBI is designed for the point at which a seller needs listing intelligence rather than isolated content generation. Its workflow begins with a quantified diagnostic of the current ASIN. The system evaluates the main image, title, five bullets, A+ content, and review-structure or voice-of-customer signals, then identifies where the listing is losing competitive strength.
The next step is a controlled benchmark. Rather than comparing the ASIN with any prominent product in the category, DeepBI selects a relevant high-performing ASIN under similarity constraints such as product type, price range, audience, and market validation. This prevents recommendations from being based on materially different products. The seller can then see the gap between the current listing and a credible benchmark, including whether the weakness is visual hierarchy, title structure, incomplete parameter communication, feature-only bullets, missing usage information, or insufficient trust support.
In the exfoliating mist diagnosis, the benchmark made the bottleneck visible:
- Total Listing score: 59 versus 84.
- Title: 16 versus 18.
- Main image set: 26 versus 24.
- Bullet points: 6 versus 7.
- Detail and A+ content: 3 versus 24.
- Reviews: 8 versus 11.
The numbers did not suggest that every part of the page was failing equally. They showed that the largest opportunity was the detail and A+ layer. The page needed to explain what the two bottles were for, demonstrate the usage process, provide ingredient and comfort information, and reduce the risk created by the unclear rinse-off logic. A benchmark is useful precisely because it converts a general feeling that “the listing is weak” into a prioritized explanation of where the conversion chain breaks.
The diagnostic should connect directly to funnel metrics. Weak CTR can be investigated alongside main-image weaknesses, while weak CVR can be examined through A+ content, review credibility, and missing trust or usage information. DeepBI converts these findings into prioritized actions aimed at CTR and CVR, rather than presenting a long list of equally urgent edits.
The execution layer turns those actions into structured title and bullet recommendations, as well as revised main-image, detail-image, and A+ visual assets. Its visual generation process uses a Product DNA map to constrain the output to the product’s actual physical structure. That safeguard matters because a general-purpose AI image can alter a product’s appearance, creating product-image mismatch, negative reviews, and refunds. DeepBI translates the diagnostic gaps into parameterized design instructions before generation.
Selected visual assets can then be synchronized to Amazon listing placements through an SP-API-connected workflow, with an original-versus-new preview before replacement. Instead of downloading, renaming, logging into Seller Central, and uploading one file at a time, the seller can reduce an operation that previously took many minutes to a much shorter application step. After publication, visual changes can be linked to advertising reports so the seller can observe CTR movement and evaluate whether the optimization produced a measurable response.
Paid-tool upgrade triggers
The decision to upgrade should be based on friction, not on the abstract promise of AI. A paid listing workflow becomes rational when one or more of these conditions persist:
- Manual AI-related listing work exceeds approximately 10 hours per week.
- The catalog has enough listing complexity that sellers cannot reliably compare images, titles, bullets, A+ content, and review signals by hand.
- CTR remains weak, but the specific competitive or visual gap is unclear.
- CVR is under pressure because the detail page does not adequately communicate use cases, trust signals, or product differences.
- Content production is slowing the listing cycle time or delaying launches, refreshes, and corrective updates.
- Advertising spend is increasing without a clear connection between listing changes and CTR, CVR, or ACoS.
Free tools remain appropriate when they cover the immediate need. DeepBI becomes more valuable when the seller needs a scored diagnosis, a defensible benchmark, prioritized execution, product-authentic visual generation, and faster deployment in one listing-first loop. The upgrade is justified when better diagnosis and shorter execution time can protect advertising efficiency while giving the team a measurable path from listing friction to CTR and CVR action.
Using AI to Turn Ad Traffic into Durable Organic Demand
Paid traffic is not durable growth when it only produces short-term orders. The stronger model is to use Amazon advertising data to identify which shoppers and search terms convert, then transfer those signals into listing improvements and organic-ranking support. The result is a compounding loop: better traffic selection improves ACoS, stronger listing relevance and conversion improve CVR, and improved organic visibility raises the share of profitable demand that does not require the same level of ad investment.
Four-layer ad acquisition with DeepBI
A practical acquisition system should move through four layers rather than treating every campaign, search term, and product target equally:
- Exploration: Test a broad range of relevant queries and targets to discover where impressions, clicks, conversions, and order value begin to concentrate.
- Initial filtering: Remove or reduce traffic sources that generate clicks and spend without sufficient conversion evidence. This protects budget from low-quality reach before scaling decisions are made.
- Precision targeting: Concentrate spend on targets with stronger conversion quality, acceptable ACoS, and a meaningful relationship to the product’s actual selling points.
- Scaling: Increase exposure only after the target demonstrates repeatable performance, using budget and placement decisions that protect conversion efficiency rather than chasing impressions alone.
The filtering window should be long enough to distinguish a real signal from a temporary spike. Approximately two months of Amazon advertising data gives sellers a broader base for identifying low-conversion traffic, recurring winners, and targets with stronger order value. The objective is not to eliminate every expensive click immediately. It is to separate exploratory data from traffic that deserves continued investment.
Daily management should use the previous seven days of clicks, conversions, spend, and ACoS as the operating reference. Bids and budgets can then be adjusted according to recent performance while avoiding abrupt reactions to a single day of noise. A sudden conversion or spend change may reflect normal volatility; repeated movement across the seven-day window provides a more credible basis for action.
DeepBI supports this decision process by connecting Amazon Listing advertising reports, including impressions, clicks, conversions, TACoS, and ACoS, with listing and visual optimization decisions. Its value is not simply reducing bid-management labor. It helps sellers connect the quality of acquired traffic to the page elements responsible for converting that traffic. When CTR is weak, the investigation can move toward the main image and visual hook. When CVR is weak, the focus can shift toward A+ information density, trust signals, and clearer communication of core selling points.
The mist-set example shows why this connection is necessary. The seller saw advertising exposure without a corresponding increase in orders, but the page’s weakness was not adequately described by “bad traffic.” The product page lacked a clear usage model and did not explain why the two products belonged together. As a result, ads were bringing shoppers into a decision environment where basic questions remained unanswered. Before changing bids or adding keywords, the team needed to repair the page’s ability to receive and convert traffic.
Organic rank and TACOS bridge with DeepBI
The paid-to-organic bridge begins when advertising data is treated as a source of customer-intent evidence rather than only a campaign report. From the accumulated data, sellers can prioritize keywords that combine high CTR, high CVR, and high order value. These terms indicate not only that shoppers notice the offer, but also that the listing satisfies the intent behind the query.
Those keywords can guide title language, image emphasis, and visual feature prioritization. DeepBI is designed to identify high-conversion search terms and convert those signals into optimization weights for titles and images. This creates a direct connection between ad traffic quality and listing conversion performance. A main image that communicates the winning product attribute more clearly can improve CTR; a page that explains the benefit and reinforces trust can improve CVR.
The title comparison in the mist-set diagnosis illustrates this process. The original title used abstract language and did not lead clearly with “for face and body” or the product size. The benchmark opened with a more searchable product definition and connected the product type to its use area, outcome, and specifications. The title was not the largest scoring gap, but it showed how vague wording can weaken both search alignment and purchase confidence. Advertising data can identify which terms attract qualified shoppers; the listing must then use clear language to confirm that the product matches the intent behind those terms.
Top of Search campaigns can then support visibility for the highest-quality terms while the listing is being strengthened. The aim is not to buy rank indefinitely. It is to concentrate paid exposure where strong CTR and CVR give the product a better opportunity to generate sales velocity and improve natural ranking. As organic placement and conversion strengthen, the product can capture a larger share of demand without requiring equivalent paid spend, helping reduce TACoS.
The operating loop is therefore measurable: filter weak traffic, improve paid efficiency, strengthen listing CTR and CVR, support natural ranking and BSR, and increase profitable organic demand. After a visual update, sellers should compare subsequent CTR movement over a defined observation window rather than judging the change immediately. DeepBI can mark a visual iteration event in the advertising report, enabling a 7–14 day comparison between the update and later performance. This feedback closes the loop between advertising data, listing execution, and the next optimization decision.
Implementation Strategy: Cost Gates, Roles, and Continuous Optimization
The right AI Amazon optimization strategy is not a universal software bundle. It is a cost-gated operating model: define the business objective, assign measurable tasks to AI, measure the effect on CTR, CVR, ACoS, BSR, or listing cycle time, and fund the next capability only when the current bottleneck justifies it.
Tool-stack decisions by seller size and monthly spend
Seller size and monthly advertising spend provide useful starting gates, but operational friction should make the final decision. A tool earns its place when manual work, delayed decisions, or missed sales opportunities cost more than the tool and its implementation.
- New sellers: Begin with Amazon native tools and a disciplined manual process. At this stage, the priority is learning the relationship between impressions, clicks, orders, CTR, CVR, and ACoS. Paying for a broad stack before there is enough operating data can create subscription cost without creating a clear optimization signal.
- Growing sellers: Prioritize listing optimization before expanding advertising automation. If listing edits, competitive benchmarking, image production, or content diagnosis consume substantial weekly time, a listing-focused workflow can address the conversion bottleneck first. DeepBI can score listing performance, cross-check exposure, clicks, orders, CTR, and CVR against listing dimensions, benchmark comparable ASINs, and turn quantified gaps into prioritized actions.
- Scaling sellers: Add PPC automation when campaign volume and spend make manual checks unreliable. At approximately $3,000 or more in monthly ad spend, daily bid and budget decisions can justify automation when the seller cannot consistently review search terms, clicks, conversions, spend, and ACoS. Add inventory and repricing capabilities when their own operational thresholds are reached and the relevant data is available.
This sequence avoids buying capabilities in the wrong order. Better traffic selection cannot compensate for a weak detail page, and stronger listing content cannot fully solve inefficient campaign targeting. The stack should expand as a measurable constraint moves from listing conversion to paid acquisition and then to organic growth.
The exfoliating mist case provides a practical ordering principle. The seller’s first instinct was to obtain more reviews and adjust advertising, but the diagnosis showed that the most severe gap was in the detail and A+ experience. The page needed to explain the dual-product structure, show the correct spray-massage-rinse or wipe process, and provide a visual trust bridge before additional traffic could be evaluated fairly. Tool selection should follow the largest measurable bottleneck, not the most visible symptom.
Human goals vs. AI execution
The seller remains responsible for the commercial objective. That objective may be protecting profit through ACoS control, accepting a higher acquisition cost to scale, improving CVR before increasing traffic, or shortening the listing cycle time for a larger catalog. The seller must also define acceptable constraints, approval thresholds, product facts, and compliance boundaries.
AI should execute within those decisions rather than replace them. Its role can include:
- Collecting and analyzing Amazon listing and advertising data.
- Identifying whether a bottleneck is more likely to involve acquisition and visual attention or detail-page conversion and trust.
- Translating quantified gaps into structured optimization instructions.
- Generating or revising approved listing assets within verified product constraints.
- Supporting bid and budget optimization where the selected advertising workflow provides that capability.
- Measuring subsequent signals and informing the next iteration.
A controlled listing workflow illustrates the division clearly: diagnostic score, competitive benchmark, prioritized CTR/CVR actions, AI copy or visual generation, human review, and SP-API-supported application. Product DNA and verified attributes remain hard constraints; AI should not invent claims or alter physical characteristics. The seller decides what business outcome is acceptable, while AI reduces repetitive analysis and execution uncertainty.
The usage error in the mist listing also shows why human review remains essential. A visual instruction can look polished while still being commercially wrong. “Massage gently to promote absorption” was inconsistent with the intended rinse-off process and could create concerns about stickiness and safety. AI can help identify and rewrite the instruction, but the seller still needs to confirm the product facts and approve the final claim. Execution speed is valuable only when the underlying product logic is accurate.
Risk controls and continuous optimization
Continuous optimization requires controls at both the business and execution levels. A seller should establish the following before expanding automation:
- Set an explicit target, such as maintaining an ACoS ceiling, improving CVR, or prioritizing controlled growth.
- Approve changes before deployment when the change affects product claims, core images, or other material listing elements.
- Require generated assets to remain consistent with verified product attributes and Amazon formatting requirements.
- Record each scoring or implementation event so the seller can connect a listing change with later CTR, CVR, spend, orders, or ACoS data.
- Review inventory constraints before increasing traffic. Stockouts can harm organic ranking, and some sellers report a meaningful sales dip during the recovery period.
- Roll back or revise changes that fail to improve the selected KPI within the defined measurement window.
These safeguards prevent automation from becoming untraceable activity. They also protect against a common failure mode: changing several variables at once and then being unable to determine which action affected performance.
A further control is to test the logical consistency of the listing before increasing traffic. The title, images, bullets, and A+ modules should answer the same basic questions:
- What is the product?
- Who is it for?
- What does each component do?
- How is it used?
- What result should the shopper reasonably expect?
- What evidence or information reduces purchase risk?
In the mist-set example, the page failed this consistency test even though some individual assets looked acceptable. The title did not clearly anchor the use area and size, the main images did not consistently explain the product’s mechanism, and the A+ section was almost entirely text. A complete optimization process therefore needs both score-based diagnosis and a human-readable check of whether the page tells one coherent story.
Conclusion: operating rhythm and key takeaways
The practical rhythm is simple: analyze, implement, measure, and adjust. Analyze the current listing, campaign, and organic signals. Implement one constrained, prioritized change. Measure its effect on CTR, CVR, ACoS, BSR, orders, or listing cycle time. Adjust the next action according to evidence rather than assumption.
The operating logic is especially important when advertising symptoms are strong. A product can have exposure without enough orders, a reasonable star rating without enough trust, or a visually attractive image set that still leaves shoppers unsure how the product works. The exfoliating mist listing initially appeared to have a review problem and an advertising problem. The deeper diagnosis found a much larger A+ gap and a usage contradiction that weakened the page’s conversion capacity. The lesson is not that reviews or advertising are unimportant. It is that they should not be treated as the default explanation before the listing itself has been examined.
New sellers should earn the right to add paid tools by first establishing a native Amazon baseline. Growing sellers should resolve listing friction before scaling ad complexity. Scaling sellers can layer PPC automation, repricing, and inventory systems when spend, catalog size, lead times, and conversion discipline support those investments.
The strongest Amazon AI tools strategy therefore follows thresholds, not hype. Human judgment sets the destination and guardrails; AI collects data, executes supported workflows, and accelerates iteration. Listing conversion, advertising acquisition, and organic ranking should be managed as one continuous growth system, with every new investment tied to a visible operational trigger. Before turning up bids, sellers should ask a more fundamental question:
Does this Amazon product page clearly explain the product, resolve buyer concerns, and deserve more traffic yet?
If the answer is no, the next optimization may belong on the Listing rather than in the ad console.