

Before You Optimize Anything: Know Your Real Target
There is no universally optimal ACoS. A percentage that appears efficient for one ASIN can erode contribution for another because their underlying margin structures differ.
Start with each ASIN’s contribution margin before advertising and calculate its break-even ACoS. For example, suppose two products each operate at a 30% ACoS:
- Product A has a 50% contribution margin before ads. After ad spend, 20 percentage points remain to cover fixed costs and profit.
- Product B has a 20% contribution margin before ads. The same advertising level creates a 10-point contribution shortfall before fixed costs.
The ACoS is identical, but the economic outcomes are opposite.
The target must also reflect the campaign’s role. A launch campaign may tolerate an ACoS above the eventual break-even level while building demand, conversion data, and potential BSR momentum. A mature harvesting campaign should generally prioritize profitable demand and tighter ACoS control. A campaign defending organic rank may accept lower short-term efficiency when paid visibility supports a broader strategic objective.
Lifecycle stage is a useful starting lens, not a fixed range. Category competitiveness, CPC pressure, CVR, and the ASIN’s margin can materially shift the acceptable target.
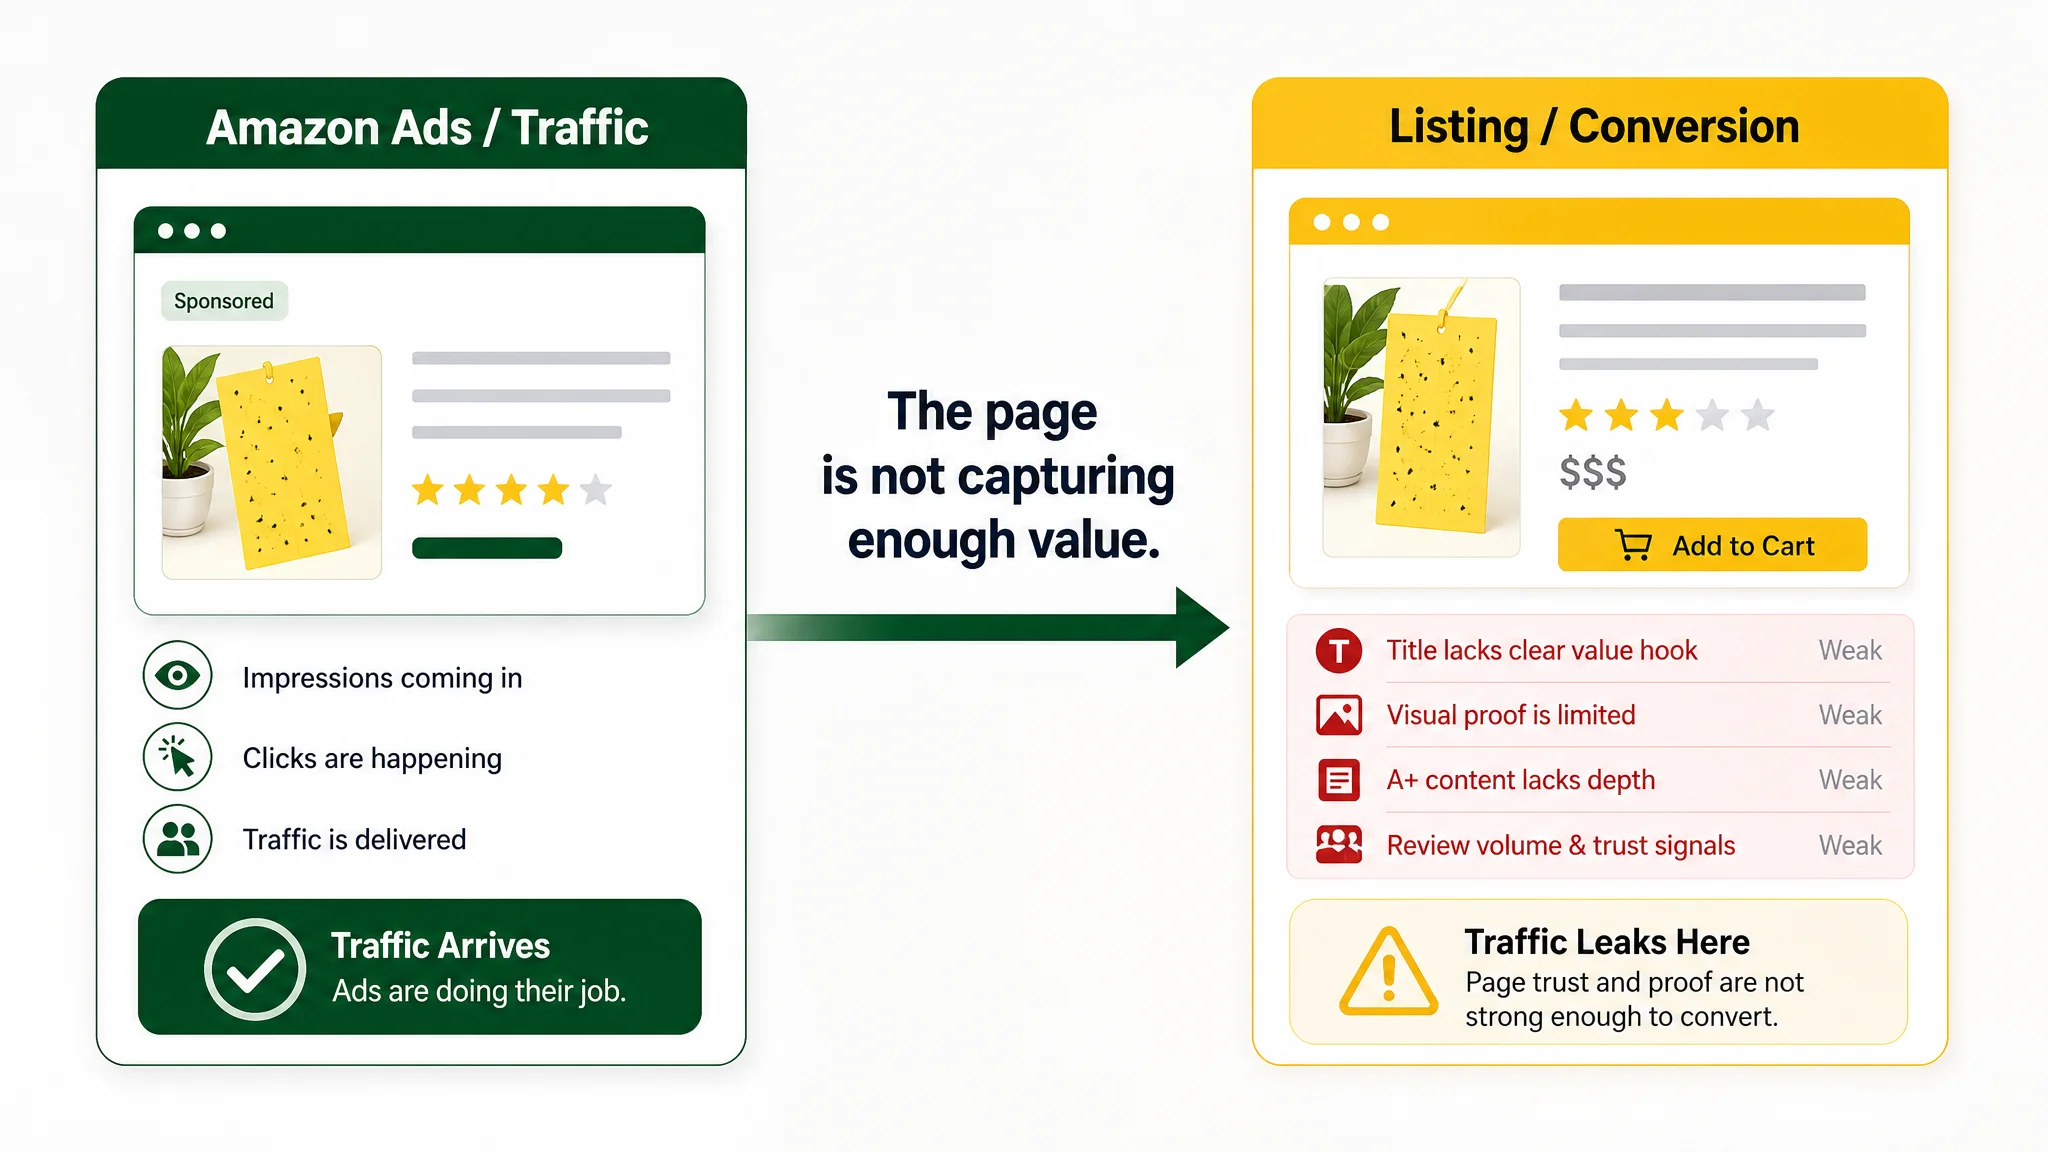
A listing diagnosis from the gnat-trap category illustrates why campaign targets cannot be separated from conversion capacity. The seller was receiving steady ad traffic, but orders were not growing in line with spend and ACoS was becoming difficult to control. The initial assumption was that the campaigns needed more aggressive keyword, bid, or budget optimization. However, the listing was scoring 70/100 against a carefully matched benchmark at 77/100, with the gap concentrated in the title, A+ and detail content, and review-related trust signals. The issue was not simply how much the seller was willing to pay for traffic; it was whether the page could convert that traffic efficiently enough to justify the spend.
The first operational step is not to choose a market benchmark. Define the role of every campaign, then set its ACoS constraint based on that role, the ASIN’s break-even economics, and the desired balance between immediate profit and longer-term organic growth. At the same time, confirm that the listing has enough conversion capacity to support the target.
ACoS vs Profit: Why the Ratio Alone Doesn't Tell You Anything
The ACoS Formula
ACoS is calculated as:
ACoS = Ad Spend ÷ Ad-Attributed Sales × 100
If an ASIN spends $20 and generates $100 in ad-attributed sales, its ACoS is 20%. This figure shows how much advertising cost was required to produce each dollar of attributed revenue. It does not indicate whether the order generated a profit.
The missing variable is contribution margin. A product with a 40% contribution margin may support a 20% ACoS before other business costs are considered. A product with a 15% contribution margin may lose money at the same 20% ACoS. The ratio is identical, but the economic result is not.
Evaluate ACoS against the ASIN’s contribution margin, pricing, fulfillment costs, fees, discounts, and strategic role—not against a universal benchmark. ACoS is a constraint: it describes what you are willing to pay for an ad-attributed dollar. It is not a complete bidding or growth strategy. Cutting bids to force a lower ratio can also reduce CTR, CVR, visibility, BSR momentum, or the sales signals that support listing optimization.
The ratio can also hide a conversion problem. In the gnat-trap example, the seller initially interpreted stubborn ACoS and slow order growth as evidence that the advertising system needed more work. Yet the listing already had a complete image set, A+ content, and reasonable reviews. Its “good enough” appearance made it easy to overlook the more important issue: the page was consuming traffic without building enough trust or proof to convert it. The benchmark listing’s stronger title logic, visual evidence, and review depth showed that two pages receiving comparable attention from shoppers could have very different economic outcomes.
DeepBI evaluates ACoS and ROI alongside the share of ad spend generating results, helping assess spend quality instead of treating the ratio as a standalone verdict. Its advertising data can also connect with listing and visual optimization, creating a feedback loop among ad signals, conversion, and organic performance. Attribution windows vary by ad type and campaign setting, so verify the applicable window in Seller Central.
Before changing another bid, calculate the break-even ACoS for each ASIN and ask whether the listing is converting the traffic at a rate that makes the target economically realistic.
How to Calculate Break-Even ACoS and a Target ACoS per ASIN
The Break-Even Formula
Break-even ACoS is the advertising cost as a percentage of sales at which an ad-attributed order contributes zero after variable costs, including the product and fulfillment costs incurred for that order.
Break-even ACoS = Contribution before advertising ÷ Selling price
Where:
Contribution before advertising = Selling price − COGS − Amazon referral fee − FBA fees − inbound shipping − outbound shipping − other applicable variable costs
This is not automatically the same as gross margin. The numerator must include every variable marketplace and fulfillment cost relevant to the ASIN. The resulting percentage is the highest ACoS the order can absorb without generating a loss. Once ACoS exceeds that level, the ad-attributed order loses money.
An Illustrative Cost Breakdown
The following example is illustrative:
- Selling price: $40.00
- COGS: $10.00
- Amazon referral fee: $6.00
- FBA fees: $8.00
- Inbound shipping: $1.50
- Outbound shipping: $2.50
- Total variable costs before advertising: $28.00
- Contribution before advertising: $40.00 − $28.00 = $12.00
Break-even ACoS = $12.00 ÷ $40.00 = 30%
At a 30% ACoS, advertising consumes the full $12 contribution, leaving zero contribution on the ad-attributed order. If the seller intends to retain an 8% profit margin on sales, the target ACoS becomes:
Target ACoS = Break-even ACoS − Intended retained margin = 30% − 8% = 22%
Recalculate both figures whenever price, COGS, fulfillment costs, shipping, or marketplace fee schedules change.
The calculation tells you what an order can support, but not whether the page is capable of generating enough orders at that cost. In the gnat-trap case, pushing more traffic toward a page with weaker title structure, less convincing A+ proof, and fewer visual trust signals would not change the underlying break-even point. It would simply expose more of the existing conversion gap. Economic targets therefore need to be paired with a listing-level assessment of CVR and the reasons shoppers do or do not complete the purchase.
ACoS vs TACoS: Why Smart Sellers Track Both
ACoS and TACoS answer different operating questions. ACoS evaluates the efficiency of sales attributed to advertising, while TACoS shows the weight of advertising across the entire Amazon business.
- ACoS: Formula: Ad spend ÷ ad-attributed sales × 100, Primary question: How efficiently did the ads generate attributed revenue?
- TACoS: Formula: Total ad spend ÷ total Amazon revenue × 100, Primary question: How much of the Amazon business is funded by advertising?
Standard TACoS uses total Amazon sales, including both organic and ad-attributed sales. It excludes off-Amazon revenue; adding external sales would create a blended business ratio rather than standard Amazon TACoS.
Reading both metrics together helps prevent narrow bid decisions. Organic rank may strengthen while TACoS declines, even if ACoS remains flat or rises. This pattern can indicate that advertising is supporting broader sales growth, with organic revenue accounting for a larger share of total revenue. Conversely, a campaign with weak ACoS may be commercially immaterial when its spend is small relative to total Amazon revenue.
Use TACoS as a guardrail in both directions. A rising ratio may signal overspending, while an unusually low ratio accompanied by weakening CTR, CVR, or BSR may indicate underinvestment in demand generation. Neither result has a universal threshold. Interpret TACoS against product lifecycle stage, margin structure, category competition, and business strategy—whether the priority is harvesting profit, defending rank, launching a product, or building organic sales.
The gnat-trap listing also shows why TACoS should not be interpreted without conversion context. The seller was concerned that rising advertising costs were not producing corresponding order growth, but the appropriate response was not automatically to suppress all paid demand. The page needed stronger proof, clearer decision logic, and better trust signals so that paid traffic could contribute to sales rather than merely inflate the cost base. If the listing improves its CVR and begins converting existing traffic more efficiently, TACoS can become healthier without requiring the operator to remove every growth-oriented campaign.
Negative Keywords: The Fastest ACoS Fix Most Accounts Need
The fastest safe way to improve ACoS often involves removing identifiable traffic waste—not cutting bids across campaigns and sacrificing profitable demand.
Start with the Search Term Report over a meaningful period. A 60- to 90-day look-back is a reasonable default because a shorter window can overreact to normal conversion variation. Sort search terms by spend in descending order and inspect the highest-spend terms first. Calculate potential waste from your own report rather than relying on a fixed industry percentage.
Separate two distinct problems:
- Irrelevant matches: Queries that do not fit the product or buyer intent and should never have received impressions. These are strong negative-keyword candidates.
- Relevant but unprofitable terms: Queries that fit the product but generate too few conversions at their current CPC, CVR, or contribution margin. These require economic review before exclusion.
As an operator heuristic—not a universal rule—flag a term that has spent several multiples of your target CPA without converting. Validate the result against clicks, CVR, sales value, and break-even ACoS, then apply negative keywords where the waste is substantiated. The objective is not to eliminate all expensive traffic; it is to improve the average quality of the traffic that remains.
However, negative keywords cannot repair a page that fails to persuade relevant shoppers. In the gnat-trap case, the seller’s initial response focused on finding more high-intent keywords and refining campaign structure. The diagnosis instead found that the traffic was reaching a page with weaker decision logic than the benchmark: a less scannable title, conceptual rather than outcome-based visuals, and less visual proof of effectiveness. Excluding irrelevant traffic would still be appropriate, but treating every non-converting relevant term as a targeting problem would risk removing demand that the listing simply had not learned to convert.
DeepBI can support this workflow by expanding keyword and competitor-ASIN coverage during exploration, then using advertising signals such as impressions, clicks, conversions, ACoS, and TACoS to filter low-conversion or low-quality traffic before committing more budget. The resulting decisions should distinguish traffic waste from conversion friction rather than treating both as the same problem.
Conversion Rate Is the ACoS Lever That Doesn't Cost You Volume
ACoS equals ad spend divided by attributed sales. If spend remains constant while the listing converts more of its existing traffic, attributed sales increase and ACoS declines. This makes CVR a different lever from bid reduction: cutting bids may remove impressions and clicks, whereas conversion work improves efficiency without eliminating traffic. Because every campaign sending traffic to the ASIN relies on the same listing, conversion improvements can benefit the account broadly.
Improve conversion capacity before scaling spend. Ads can amplify a strong listing, but they rarely rescue a weak one. Use a competitor_layout_gap analysis to compare properly matched ASINs by product type, use case, audience, and price band, then turn each gap into a hypothesis and an execution step.
The gnat-trap diagnosis is a direct example of this sequence. The seller’s listing was not broken: it had a complete image set, A+ content, and a total score of 70/100. But a carefully matched competitor scored 77/100, and the difference was concentrated in the modules that help visitors make a decision. The competitor used a clearer quantity and product structure in its title, actual caught-insect imagery, multiple usage scenes, and stronger visual review evidence. The seller’s page contained information, but it did not create the same level of proof. That distinction matters because additional clicks do not solve a trust gap; improving the page can increase the value of the traffic already being purchased.
Product Images
Check whether the main image communicates the product’s value and decision-relevant details quickly. Weak visual hierarchy can suppress CTR and CVR. Testable actions may include changing image order, clarifying composition, or adding visual explanations. DeepBI can diagnose image gaps, rank them by expected impact, generate structured recommendations, and connect approved assets through Amazon’s SP-API.
In the gnat-trap comparison, the customer’s image set was structurally complete, but the competitor communicated value and effectiveness more forcefully. The recommended direction was to make the pack size visually obvious, show target pests in a professional way, demonstrate waterproof and sun-resistant use, and present the adjustable stake as a visible differentiator. These changes were not simply aesthetic upgrades. They addressed specific reasons a shopper might hesitate: whether the pack offers enough value, whether the product actually works, whether it can be used around plants and food, and whether it is easy to install.
Titles and Bullet Hierarchy
Review title decision terms, bullet ordering, and pain-point coverage. Map each weakness to a revised title structure or a bullet sequence covering the customer concern, product proof, and problem solved. Track the resulting CVR and ACoS rather than relying on subjective judgment.
The customer’s original title repeated terms such as “Gnat Traps” and “Indoors/Indoor” without creating a tight decision path. The benchmark began with a large quantity anchor and organized the title around quantity, core product, function, and scenario. The recommended revision similarly prioritized the core product term, house-plant use, multiple pest types, and the included stake holders. The lesson is not that longer titles are automatically better. It is that title space should carry decision-relevant information rather than repetition.
The same principle applied to the bullets. The seller already mentioned safety, durability, design, and use cases, but the information was not arranged around the questions buyers answer first. Reorganizing the bullets around adhesion and durability, safety, ease of setup, visual attraction, and multiple scenarios created a clearer pain-point-to-solution path. Better hierarchy can improve CVR without requiring more traffic.
Reviews and Pricing
Examine review structure, trust signals, A+ coverage, comparison modules, and use-case content. Pricing should help define a properly matched benchmark, not function as a universal conversion rule. DeepBI can benchmark these listing dimensions against competitive ASINs and prioritize concrete gaps. Stronger CVR may also improve ad rank, allowing lower bids to win comparable auctions and potentially reducing effective CPC—not because conversion directly lowers CPC, but because the listing monetizes the same traffic more effectively.
The review difference in the gnat-trap category reinforced the visual trust gap. The customer had a 4.3-star rating with approximately 746 reviews, while the benchmark had a 4.6-star rating with approximately 5,460 reviews and substantially more image-rich social proof. The rating difference was not catastrophic, but for a product whose effectiveness is easy to question, real photos of captured insects provide evidence that descriptive claims alone cannot. Reviews and A+ therefore worked together as part of the conversion engine rather than as isolated listing fields.

Set Bids From Profit, Not From Rank
A bid should reflect what one converted order can support—not what Amazon suggests or what you believe is required to reach a desired BSR. Start with the target ACoS, average order value, and conversion rate:
Maximum CPC = Target ACoS × Average Order Value × Conversion Rate
Illustrative inputs:
- Target ACoS: 25%
- Average order value: $40
- Conversion rate: 10%
- Maximum CPC: 0.25 × $40 × 0.10 = $1.00
At the same 25% target ACoS and $40 average order value, a 5% conversion rate produces a maximum CPC of only $0.50. The target has not changed; the order economics have. Raising the bid to pursue rank without addressing weak CVR can increase spend and ACoS without generating profitable volume.
The gnat-trap seller initially considered pushing keywords, bids, and budgets to catch a benchmark competitor. That approach assumed that buying more exposure would eventually make the listing catch up. But if the page converts at a lower rate because its title, proof, and trust structure are weaker, a higher bid only buys more opportunities to lose efficiency. The maximum CPC formula makes the relationship explicit: when CVR is constrained by the listing, the economically supportable bid is constrained too.
Do not treat a handful of clicks as sufficient evidence for a bid change. Allow enough data to accumulate for a defensible decision—commonly dozens to hundreds of clicks per keyword, depending on conversion rate and the required confidence level. For lower-volume terms, use a sequential or Bayesian approach rather than reacting to unstable early results.
Review recent clicks, conversions, spend, and ACoS over a stable window rather than against intraday noise. DeepBI can use these advertising signals to adjust bids and budgets on a rolling basis, with changes tied to accumulated performance evidence and the defined review window instead of momentary fluctuations. The prerequisite is that the conversion signal is interpreted alongside the listing conditions that produced it.
Placement and Traffic Quality: Where Budget Quietly Leaks
The same product can produce very different CTR, CVR, and ACoS by placement. Treating the campaign as a single blended number can obscure where profitable orders originate—and where budget is leaking.
For illustration only, a top-of-search placement might generate an 18% ACoS, while a product-page placement for the same product might reach 62%. These figures are neither reported nor typical performance data; the point is that placement-level economics must be measured rather than assumed. If the lower-ACoS placement produces profitable orders, shift more budget and modifier weight toward it. If another placement is unprofitable, first test a lower modifier or bid before shutting down the entire campaign. Campaign-level shutdown can remove productive traffic along with waste.
Placement analysis still needs to be separated from listing analysis. A weak placement may generate poor economics, but a listing that lacks proof or clear decision logic can depress CVR across several placements. In the gnat-trap case, the evidence did not point to a single placement as the central constraint. The more fundamental issue was that the page was structurally less persuasive than the matched benchmark. This is why placement reallocation should not become a substitute for repairing the page itself.
For Sponsored Products, review bid adjustments for top of search and product pages separately. Sponsored Brands uses a different placement structure: top of search, rest of search, and product pages. Keep these categories distinct when comparing spend, orders, CVR, and ACoS, and verify any current adjustment limits in Seller Central before applying them.
DeepBI’s advertising funnel uses signals such as impressions, clicks, conversions, TACoS, and ACoS to identify traffic that survives testing. It concentrates budget on stronger signals, scales them through higher budgets and bids, and trims weaker traffic. This does not guarantee improved profitability, but it provides a more disciplined alternative to indiscriminate campaign cuts. The process is strongest when traffic signals and listing signals are read together.
The Starve Line: When Cutting ACoS Starts Cutting Profit
The lowest possible ACoS is not automatically the best outcome. Repeated bid cuts may initially remove waste, then begin eliminating impressions, clicks, and conversions that support BSR and organic sales. The critical question is not whether ACoS declined, but whether profitable demand and ranking momentum were lost along with it.
Classify spend into three operating buckets:
- Waste: Spend with weak CTR, CVR, or economics that is not contributing a defensible strategic signal. Reduce or remove it.
- Marginal: Spend with uncertain returns that may be justified for testing, position holding, or gathering conversion evidence. Control it, but do not eliminate it automatically.
- Load-bearing: Spend tied to reliable conversion signals, strategically important terms, or sales volume that supports broader account performance. Protect it.
Do not impose one account-wide ACoS target across all three buckets. The size and composition of load-bearing spend depend on the catalog, category, and campaign structure.
The same caution applies before labeling all non-converting traffic as waste. In the gnat-trap case, the seller’s page was not receiving traffic that had no commercial potential; it was under-converting relevant traffic because the page did not provide enough evidence and trust. Cutting that traffic could have lowered the ratio temporarily while also removing the data and demand needed to validate the listing improvements. The better sequence was to strengthen the conversion engine, then reassess which traffic remained uneconomic.
If ACoS falls while TACoS rises, do not diagnose the cause from ACoS alone. First check whether total sales declined faster than ad spend. Then rule out seasonality, price changes, listing edits, and competitor moves before treating bid cuts as the likely explanation.
DeepBI’s organic-traffic layer can identify high-CTR, high-conversion, high-order-value keywords from advertising data, allowing operators to pursue ad-volume and organic-rank efforts in parallel. Ad-generated winners can feed listing and ranking work; once organic sales strengthen, TACoS may decline later without starving the demand that created the opportunity.
Common Mistakes That Keep ACoS High While Profit Stays Flat
High ACoS is often a diagnostic signal, not a reason to cut every budget. Trace the problem from traffic quality through conversion and campaign structure before changing spend.
- Auto campaigns run without management: If irrelevant queries consume spend, review the Search Term Report, add useful terms to controlled campaigns, and reduce exposure to search terms that generate clicks without orders.
- Bids remain unchanged for months: If CTR, CVR, or ACoS shifts while bids stay static, review bid history and placement performance; adjust bids against observed conversion and profitability signals instead of relying on old settings. DeepBI’s dynamic parameter control is designed to address stale bid management.
- Budgets are cut instead of fixing efficiency: If lower spend reduces sales without improving ACoS, inspect the Search Term Report and placement report for waste, then correct targeting, bids, and placements before making another broad budget cut.
- PPC is optimized without conversion analysis: If clicks rise but orders and CVR do not, inspect listing conversion signals, including impressions, clicks, orders, CTR, CVR, detail-page quality, reviews, and selling-point clarity. Improve the listing bottleneck before scaling traffic. The gnat-trap seller followed the opposite sequence at first: the team focused on keywords and bids while assuming the page was already good enough. Benchmarking showed that title logic, A+ proof, and visual trust were the more important constraints.
- Branded and non-branded traffic are mixed: If strong branded conversion hides weak non-branded performance, separate the campaigns and compare CTR, CVR, ACoS, and profit contribution by traffic type.
- Spend scales on a listing that cannot convert: If impressions and clicks grow while CVR remains weak, pause scaling and investigate the listing, reviews, A+ content, and information density. A page can have complete modules and still lack the proof needed to close the sale.
- Keyword and competitor discovery stops: If coverage narrows while growth stalls, use advertising data to identify high-converting search terms and expand relevant keyword and competitor-ASIN coverage through DeepBI’s discovery layer.
What Results Should You Realistically Expect
Amazon advertising results should be evaluated in phases, not against a promised ACoS target or fixed timeline. Profitability optimization compounds as each phase produces cleaner data for the next decision.
In the early phase, the fastest visible ACoS improvement often comes from removing obvious waste. Adding negative keywords, cutting irrelevant traffic, and stopping spend on weak search terms can reduce inefficient clicks before any major listing change takes effect. This improvement may be useful, but it does not yet prove that the account has reached a durable profit structure.
The middle phase focuses more on control. Bid adjustments and placement reallocation help concentrate spend where CTR, CVR, and contribution margin justify it. The objective is to stabilize efficiency rather than react to every daily fluctuation. Sufficient click and order volume is necessary before treating these adjustments as reliable.
A listing repair can be part of this middle phase when the data shows that traffic is not the primary bottleneck. In the gnat-trap case, the work shifted toward a clearer title, a pain-point-to-solution bullet hierarchy, stronger main-image communication, and A+ content built around actual capture evidence, safety, weather resistance, usage scenes, and the adjustable stake. The purpose was not to create a decorative redesign. It was to make the page answer the questions that prevented relevant shoppers from completing the purchase.
In the later phase, stronger conversion can support better organic performance and BSR while spend remains steady or increases selectively. As paid traffic contributes to more sales and organic rank improves, TACoS may decline even while the account continues investing in growth. This outcome depends heavily on listing quality and market conditions; it is not automatic.
The case did not justify treating the page changes as a guaranteed performance outcome. It did show the type of operating shift that matters: CVR became more responsive to ad changes, ACoS began to show downward movement as more clicks turned into orders, and ad decisions became less dependent on guesswork. These are more useful signals than claiming that one listing change guarantees a particular result.
Timing varies with data volume, attribution lag, category behavior, and the listing’s starting quality. Recent ACoS, CVR, or TACoS data remains provisional until the relevant attribution windows close and enough post-change activity accumulates. Judge trends against a stable baseline rather than isolated clicks, conversions, or a single short reporting period.
Final Thoughts: The Order You Should Do This In
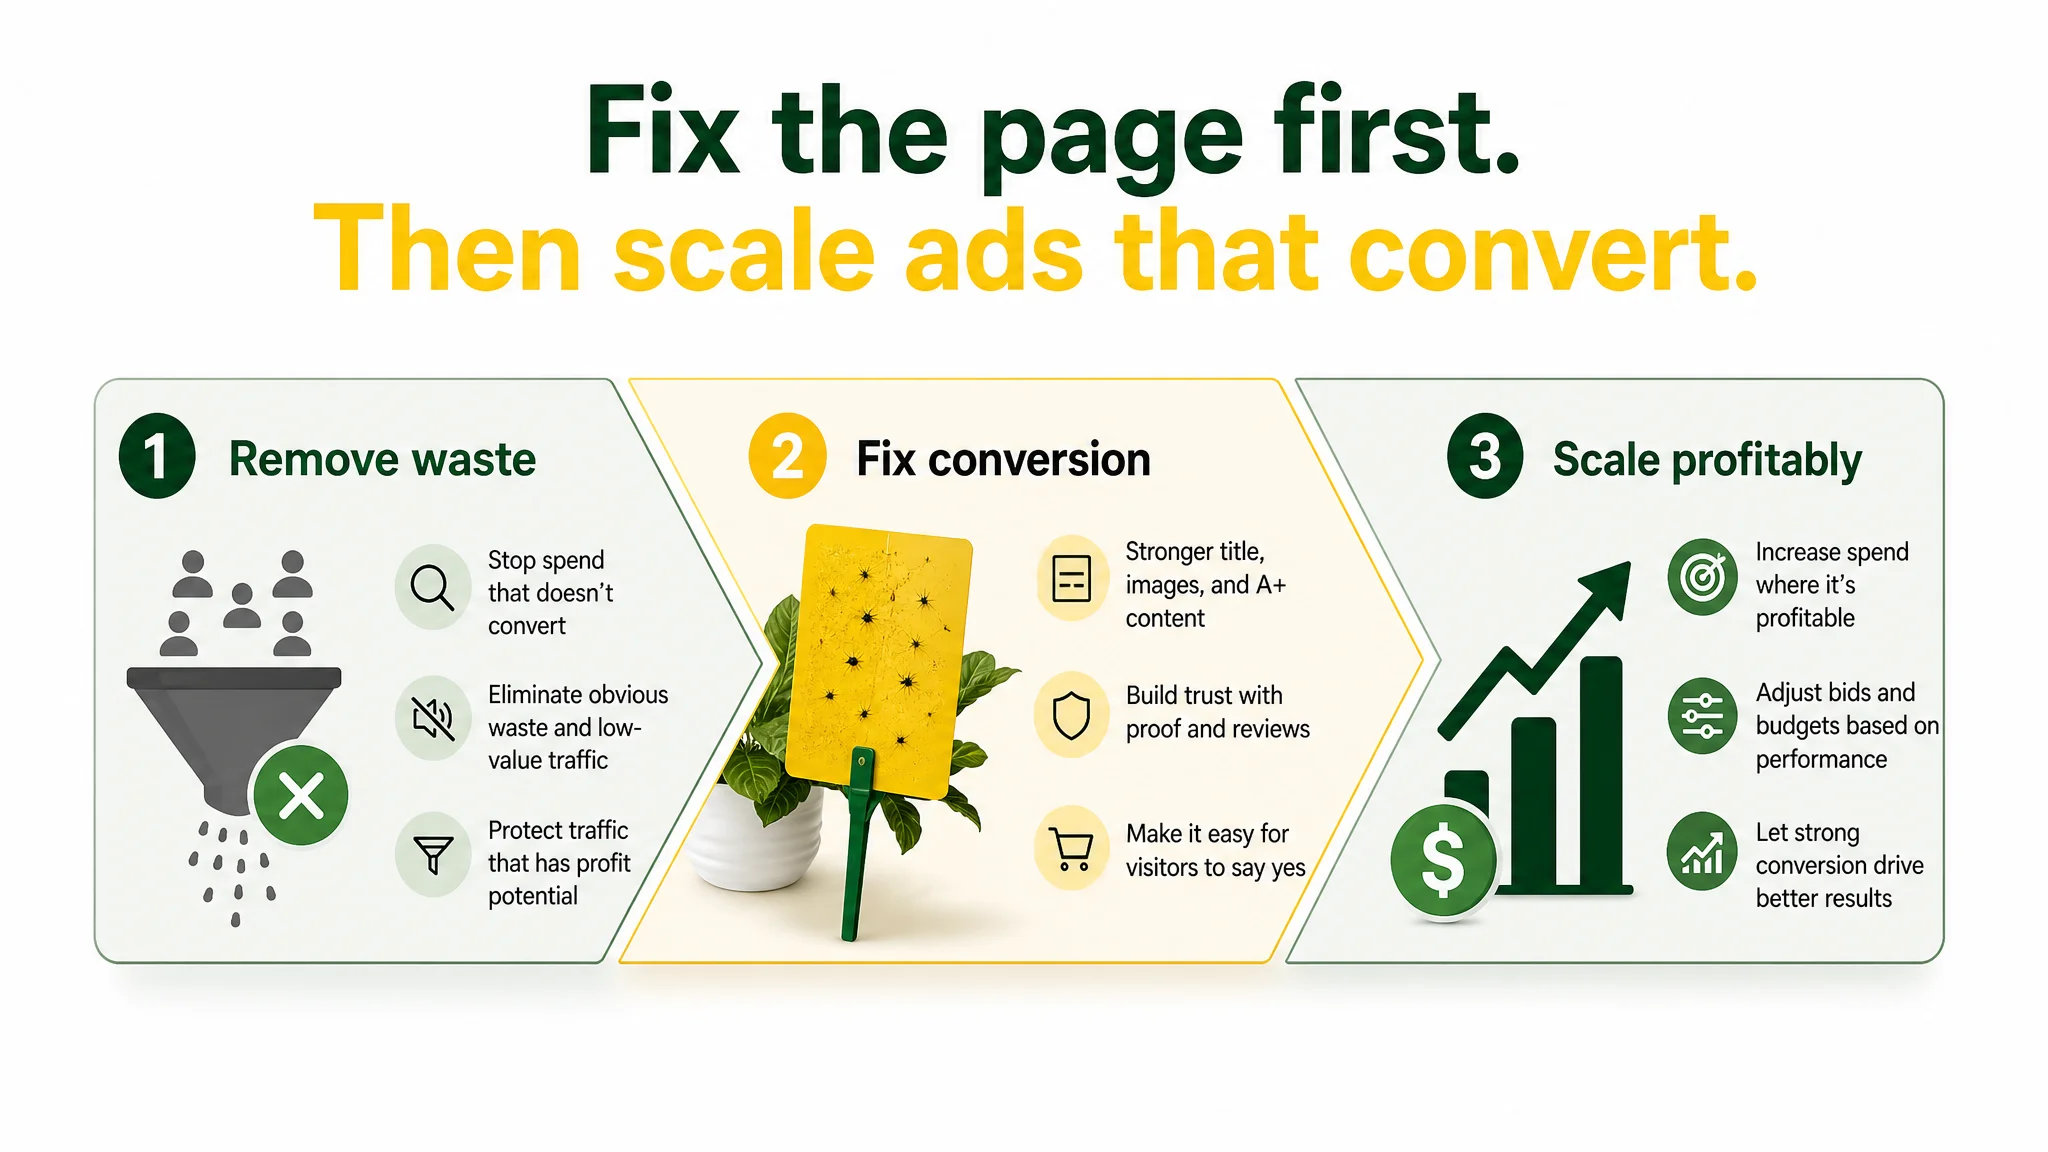
Use ACoS as one control input in a profit-based Amazon ads operating system, not as the final objective. Work through the sequence below before cutting another bid:
- Calculate break-even ACoS from contribution after all variable costs, then set a target ACoS that preserves the profit margin you intend to keep.
- Measure TACoS alongside ACoS so ad efficiency is evaluated against total Amazon revenue, including organic sales.
- Remove provable waste using the Search Term Report and campaign data; do not cut traffic simply because its ACoS is high.
- Fix conversion problems in the listing before increasing spend, since stronger CVR can improve attributed sales without requiring more clicks.
- Derive bids from target ACoS, average order value, and conversion rate rather than suggested bids or ranking ambition.
- Reallocate spend and placement modifiers toward placements producing profitable orders.
- Protect load-bearing spend that may support valuable sales and organic demand; test before starving it.
- Re-check ACoS, TACoS, CVR, and profit after the relevant attribution window closes, not immediately after a change.
The gnat-trap diagnosis makes the sequence practical. The seller first assumed that ads needed more aggressive optimization because traffic was arriving without enough orders. A matched listing comparison showed that the page itself was weaker in title logic, A+ proof, and visual trust, even though it looked complete at a glance. Repairing those gaps was necessary before additional traffic could be evaluated fairly. The same reasoning applies across categories: a listing that appears “good enough” may still be the main constraint behind high ACoS and flat orders.
Profit determines which ACoS is acceptable—not the other way around.