

Introduction
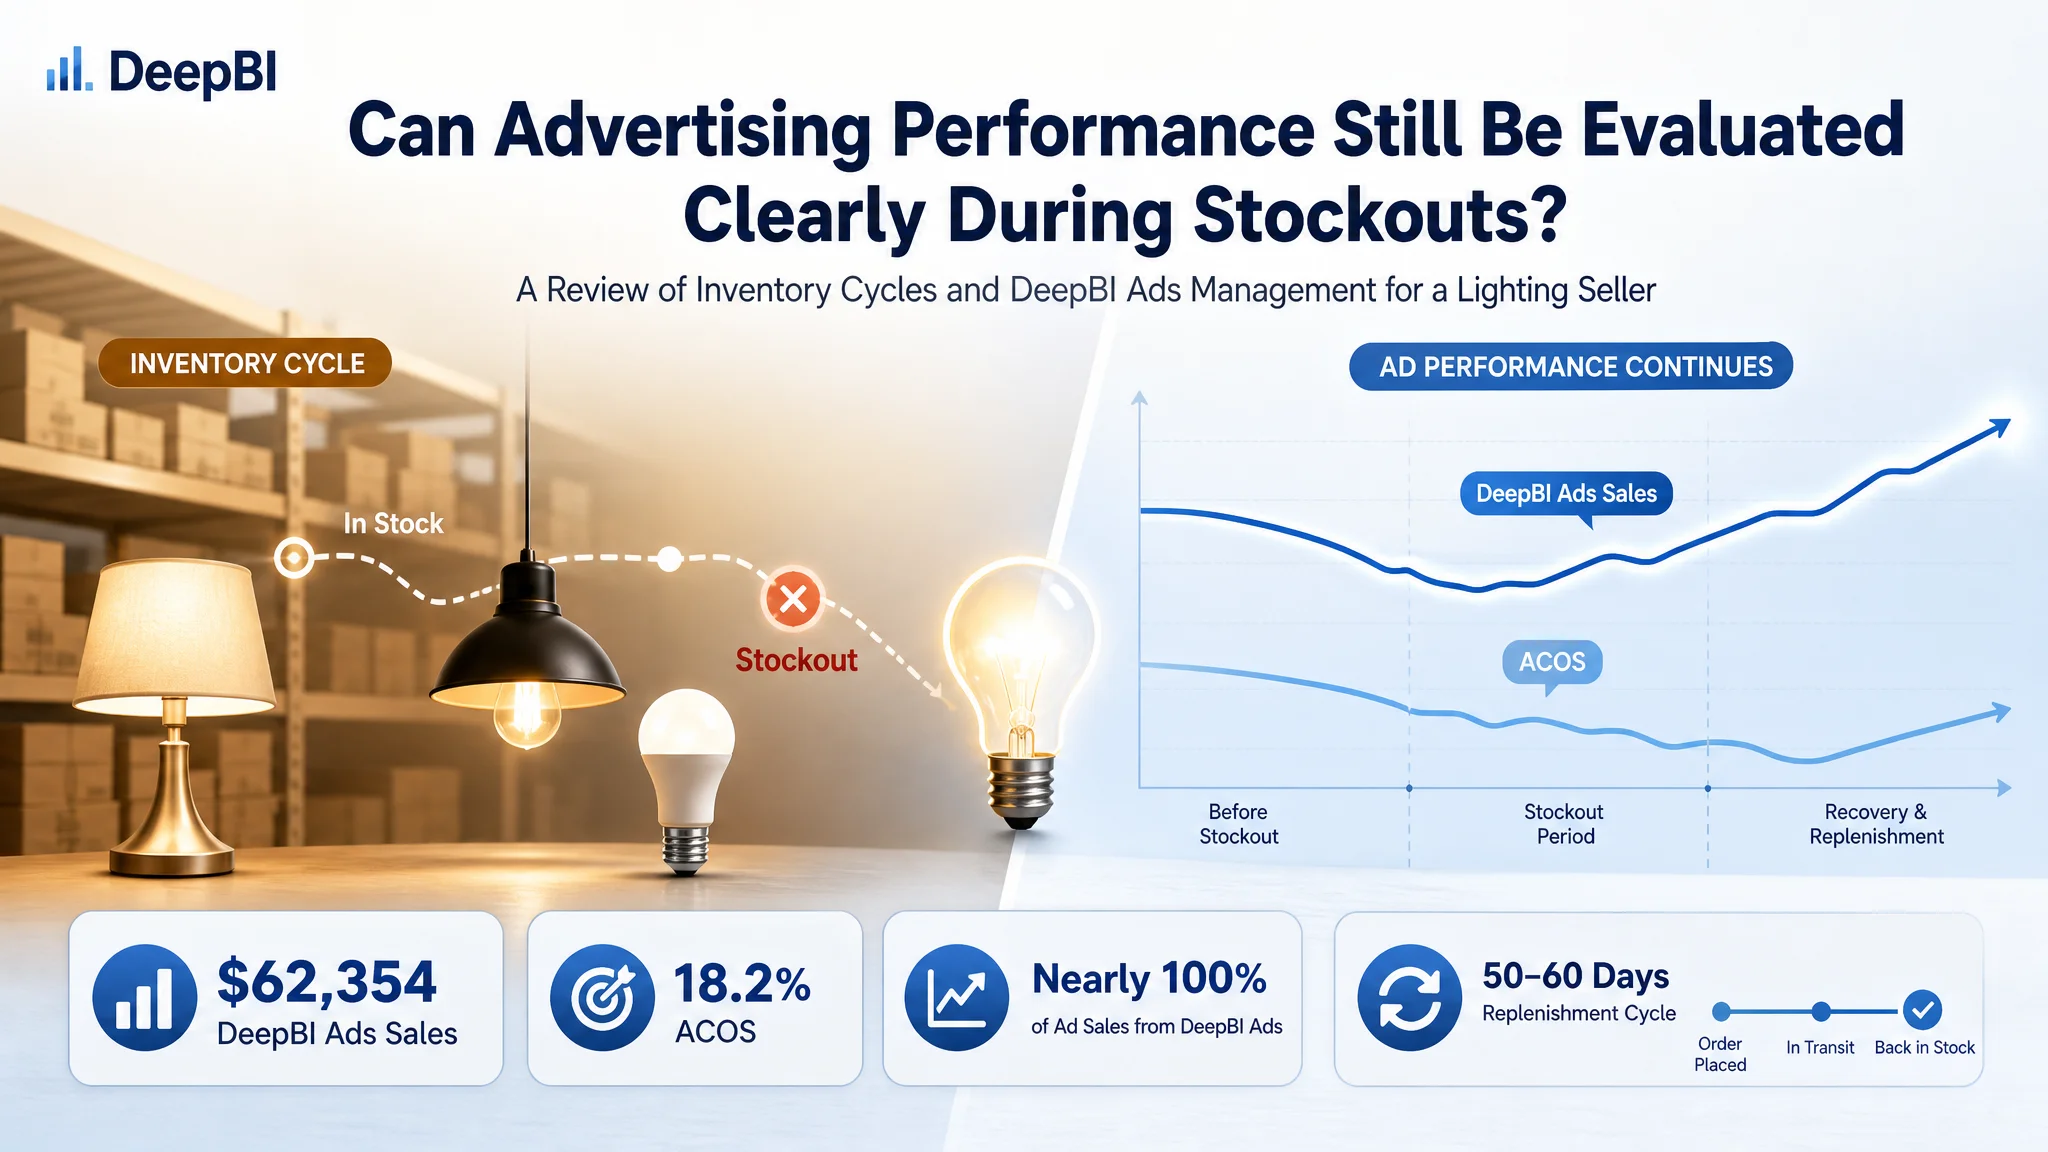
For large products such as lighting fixtures, replenishment cycles can easily take 50–60 days. Many sellers face the same dilemma: advertising performed well and sales were growing in the previous months, but once a stockout occurs or replenishment is in transit, sales fluctuations appear immediately. At that point, is advertising no longer effective, or is inventory holding performance back?
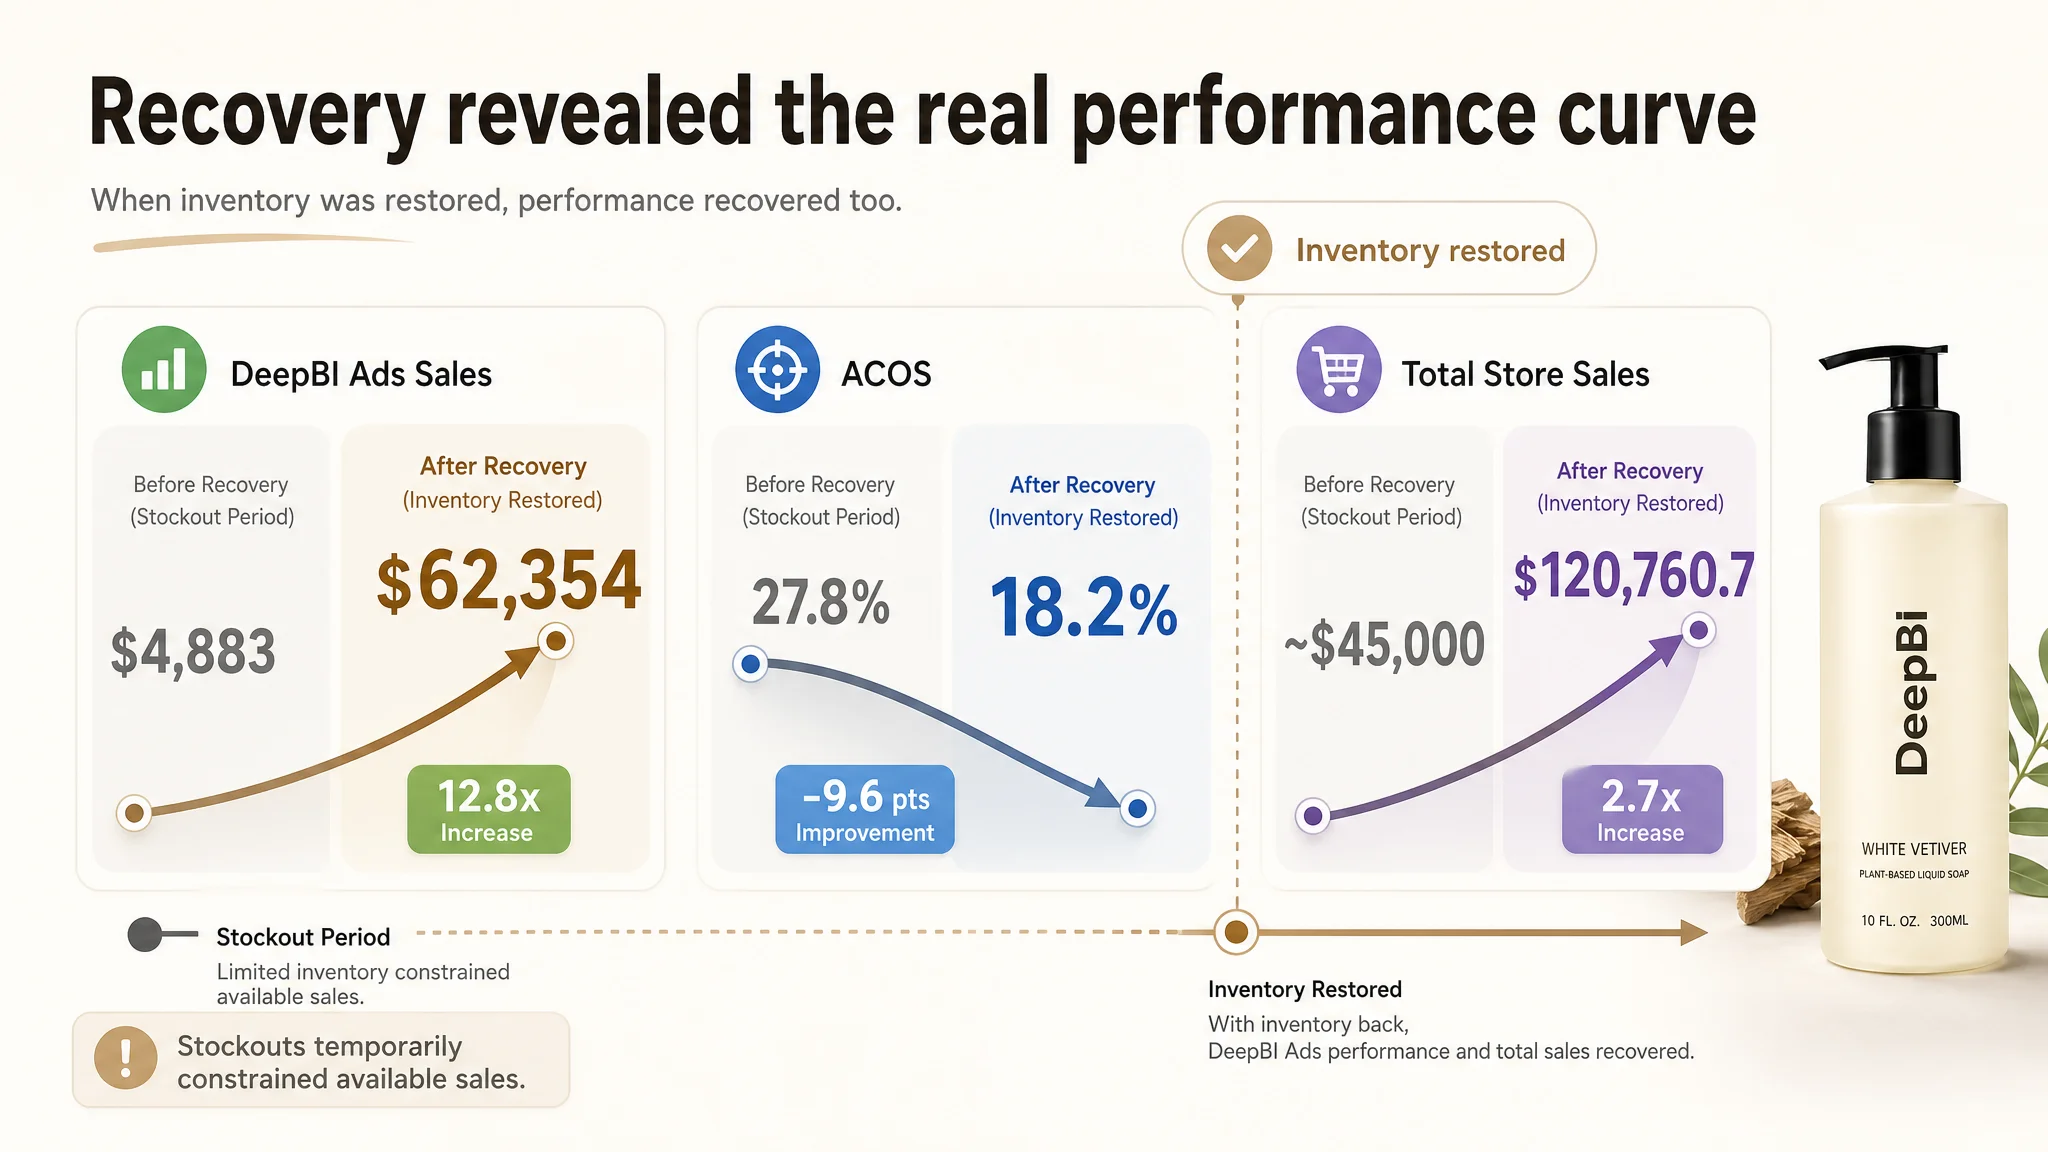
This article reviews the case of an Amazon US seller specializing in lighting products. After adopting DeepBI Ads management, the seller’s DeepBI Ads sales increased from 4,883 US dollars to 62,354 US dollars within one year, while ACOS improved from 27.8% to 18.2%, showing a continued growth trend. However, during this process, several individual high-selling child SKUs went out of stock multiple times. Replenishment in transit took as long as 50–60 days, resulting in significant sales fluctuations and hesitation over renewal.
Through the complete timeline of this lighting seller, this article examines three questions: 1) When sales fluctuate, how can sellers distinguish between an advertising problem and an inventory problem? 2) How should advertising budgets be adjusted during stockouts and replenishment-in-transit periods instead of being stopped entirely? 3) Under a long replenishment cycle, how can sellers evaluate advertising’s true capabilities more objectively without making emotional decisions based on short-term ACOS or sales fluctuations?
Customer Background
This is an Amazon US seller specializing in lighting products. The store has more than 100 ASINs available for sale and a complex parent-child variation structure, including both stable mature products and continuously launched new products. The category has several characteristics: relatively high average order values, high CPCs, and intense competition. Achieving stable sales through advertising alone is not easy.
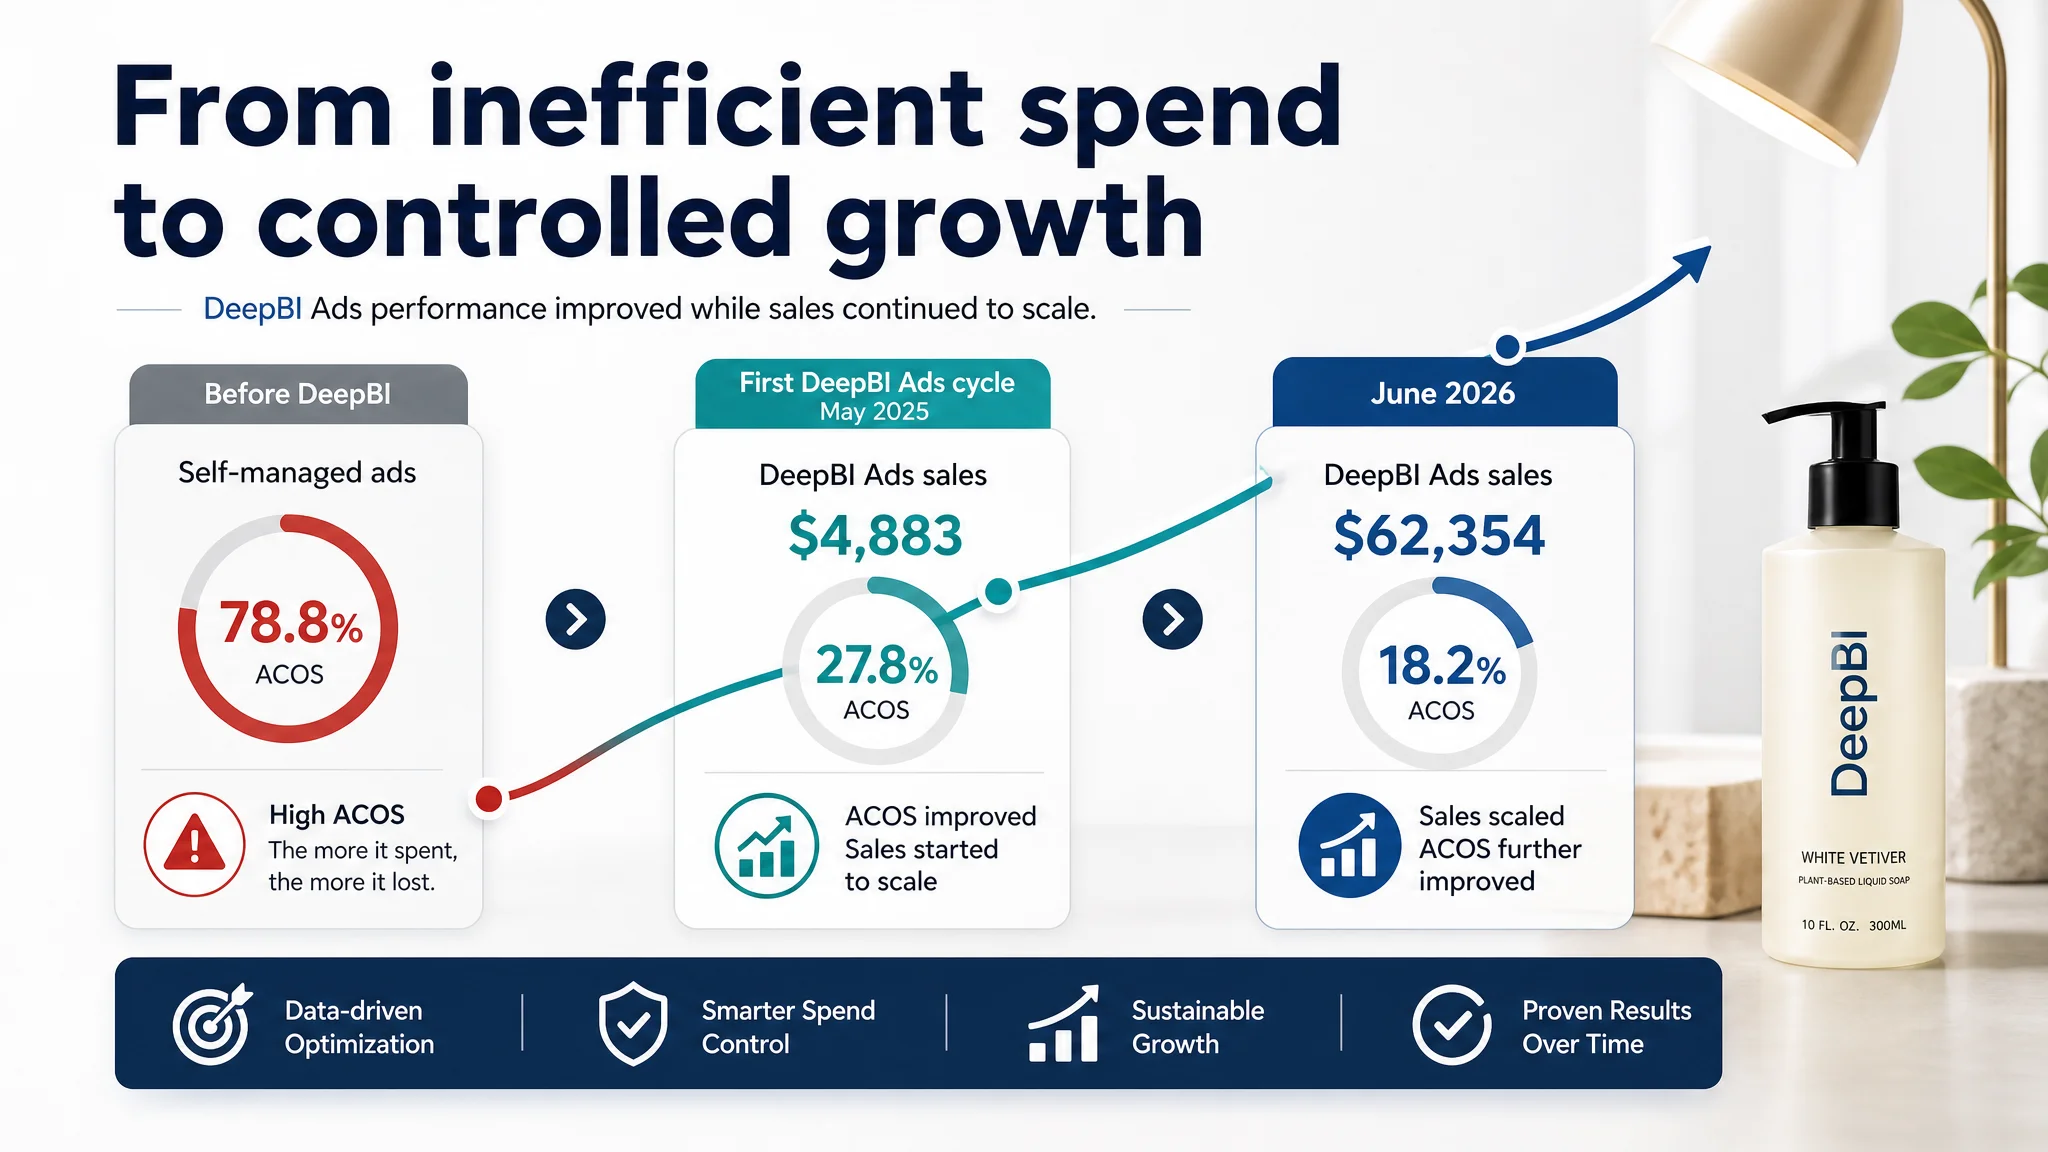
Before adopting DeepBI Ads management, the store’s existing advertising campaigns had an ACOS as high as 78.8%. Advertising was almost in a state of “the more it spent, the more it lost.” The seller did not dare stop advertising, but could not afford continued losses either. After adopting DeepBI Ads in May 2025, the first cycle generated 4,883 US dollars in DeepBI Ads sales, with ACOS falling to 27.8%. Advertising sales then continued to scale, reaching 62,354 US dollars by June 2026, while ACOS further improved to 18.2%.
This seller’s business rhythm had two notable characteristics:
- The inventory replenishment cycle was long, generally requiring 50–60 days;
- Best-selling SKUs contributed significantly to total sales, so once they went out of stock, the impact on total sales and advertising performance was immediately amplified.
Under these conditions, coordinating the advertising rhythm with the inventory cycle became a key variable determining annual performance and confidence in renewal.
The Problem
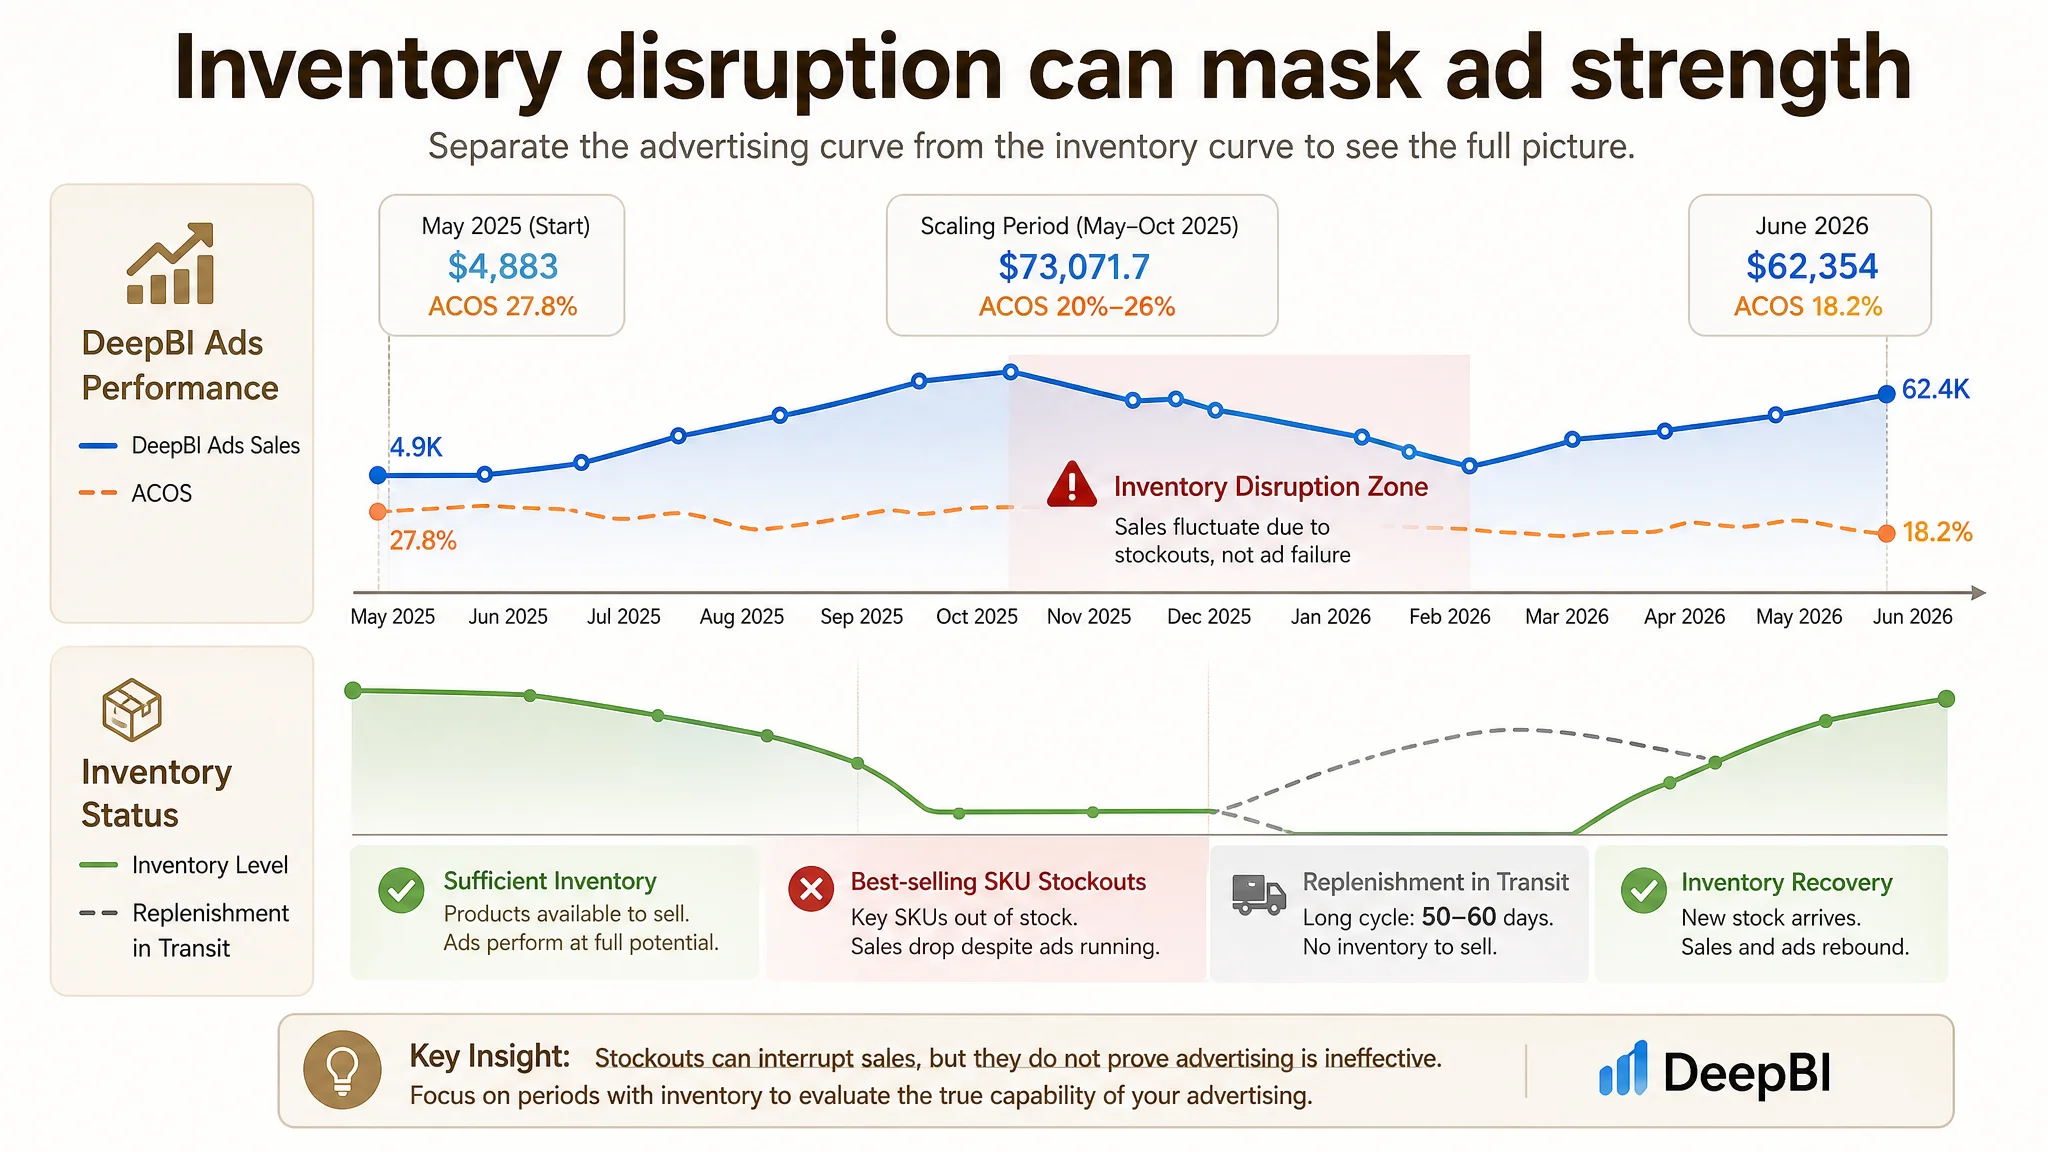
Overall data shows that this lighting seller’s store sales grew significantly over a period of more than one year: from approximately 45,000 US dollars per month during the early service period to nearly 120,000–130,000 US dollars at its peak, ultimately stabilizing above 120,000 US dollars. However, a monthly breakdown reveals a period of “stepped-down” fluctuation in the middle.
The most significant fluctuation occurred around a renewal period:
- During the earlier stage, store sales and advertising sales continued to scale under the influence of DeepBI Ads;
- Subsequently, several best-selling child SKUs went out of stock, causing total sales growth to slow or even decline temporarily;
- During the same period, the seller began to question advertising performance:
- Had ACOS increased?
- Was the sales decline caused by poor advertising performance?
- The seller needed to make a renewal decision while also facing sales pressure caused by replenishment not yet arriving.
Like many sellers, this lighting seller faced three typical questions during the fluctuation period:
1. Sales have declined—is there a problem with advertising, or is it because there is no inventory available to sell?
2. If inventory is tight, should advertising continue? If advertising stops, will organic traffic decline even faster after a stockout?
3. When the data fluctuates at renewal, how should the seller determine whether the tool and team have delivered sufficient value?
If these questions are not clearly distinguished, sellers can easily make one of two extreme choices: immediately cut the budget as soon as ACOS rises, or continue spending simply because money has already been invested, regardless of inventory, resulting in further waste. The real challenge is: How can sellers clearly understand the capability curve of advertising itself when inventory is disrupting performance?
How DeepBI Diagnosed
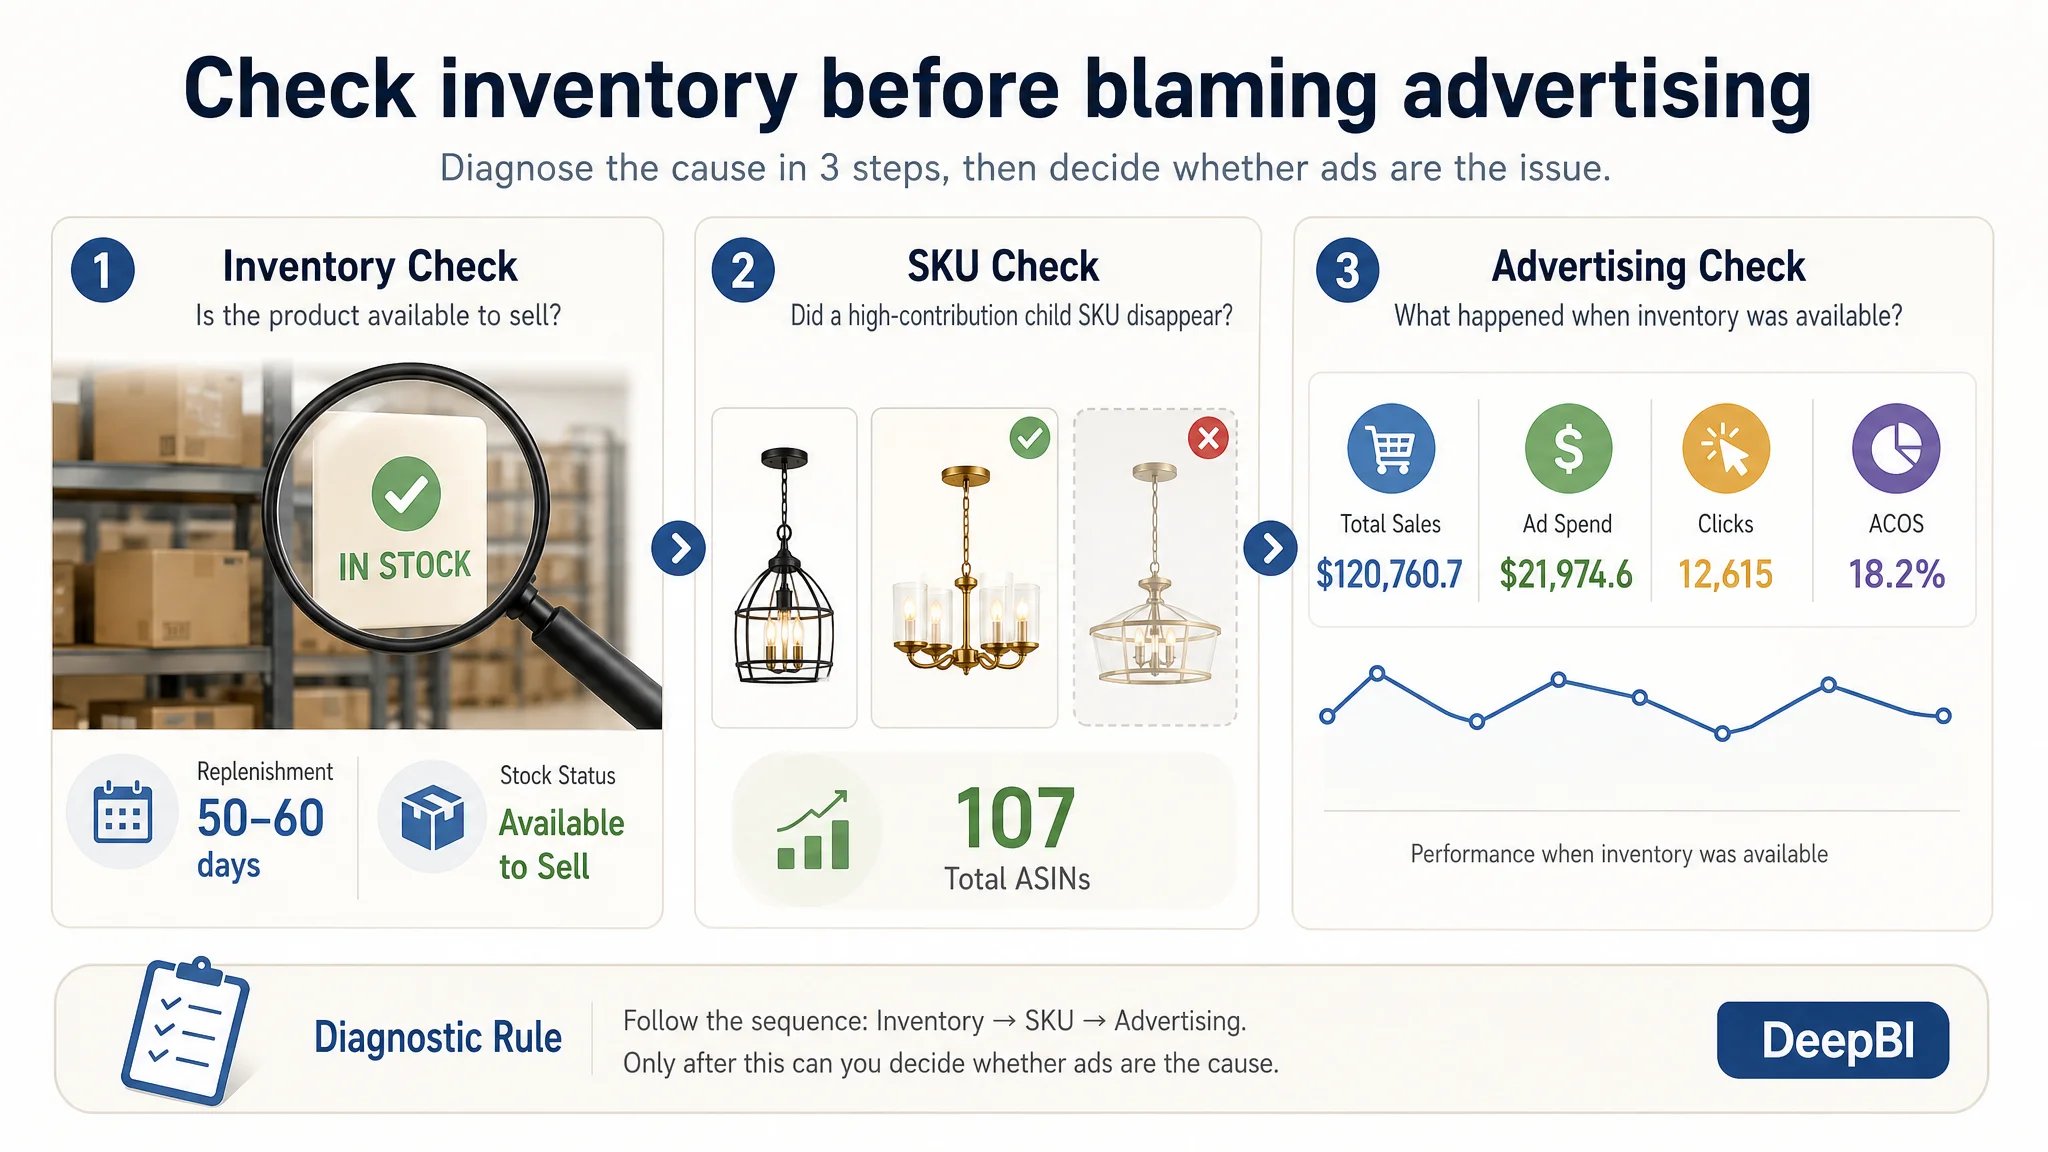
To answer the question “Has advertising actually stopped working?”, operational changes need to be broken down into several quantifiable dimensions and investigated one by one, rather than reaching a conclusion after simply looking at ACOS or sales. For this lighting seller, the diagnostic process generally involved the following steps:
1. Separate the time periods: analyze the growth period and fluctuation period separately
First, store sales and advertising data were organized along the timeline:
- Launch and scaling period: From May 2025 to October 2025, total store sales grew from approximately 45,000 US dollars to 128,832.6 US dollars. DeepBI Ads sales increased from 4,883 US dollars to 73,071.7 US dollars, while ACOS remained stable at 20%–26%.
- Fluctuation and adjustment period: During the subsequent period, store sales growth slowed and a temporary pullback occurred.
- Further growth period: In June 2026, total sales recovered to 120,760.7 US dollars, DeepBI Ads sales reached 62,354 US dollars, and ACOS improved to 18.2%.
2. Separate “advertising performance” and “inventory status” into two dimensions
After confirming the time period in which fluctuations occurred, the data was further divided into:
- Advertising-related metrics: advertising sales, ACOS, clicks, spend, and keyword/ASIN-level performance;
- Non-advertising factors: the availability status of key SKUs, sellable inventory, replenishment in transit, and whether a Listing had been removed or encountered a compliance issue.
The comparison showed that during certain fluctuation periods, the advertising logic itself had not experienced any major abnormality. Instead, some high-contribution child SKUs disappeared from the available-for-sale pool because they went out of stock, narrowing the space for overall sales and advertising to be captured.
3. Focus on best-selling SKUs: identify “who disappeared” rather than assuming “advertising failed”
For this lighting seller, several best-selling child SKUs contributed significantly to total sales. Once these SKUs went out of stock:
- On the advertising side: high-performing, high-conversion traffic entrances suddenly disappeared;
- On the organic traffic side: rankings and related recommendations accumulated through these SKUs could no longer continue converting.
During diagnosis, DeepBI focused on comparing the advertising and sales curves of these key SKUs before and after the stockout. This confirmed that “the sales change was highly correlated with their availability status,” directing the issue toward inventory rather than simply producing the vague conclusion that “advertising ACOS had worsened.”
4. Compare the advertising curve when inventory was available with the recovery after replenishment
To verify advertising’s true capabilities, performance after replenishment arrived also needed to be examined:
- Once replenishment arrived and inventory became relatively sufficient, DeepBI Ads performance was observed again to determine whether it could restore advertising sales and total store sales at a similar ACOS level;
- Data from June 2026 showed that with inventory restored, DeepBI Ads sales rose again to 62,354 US dollars, total store sales reached 120,760.7 US dollars, and ACOS further declined to 18.2%.
This demonstrated that when products were available to sell, advertising capability had not weakened; after strategy optimization, efficiency had actually improved.
Through this analysis, DeepBI helped the seller separate the “advertising performance curve” from the “inventory supply curve,” ensuring that subsequent budget and renewal decisions were based on clear signals rather than subjective impressions.
The Real Problem
After a step-by-step diagnosis based on time periods, SKUs, inventory, and advertising data, it became clear that the lighting seller was not facing a simple “advertising does not work” problem during the fluctuation period. Instead, several operational issues were overlapping.
Problem 1: Stockouts of best-selling child SKUs concealed advertising’s true capabilities
- Cause: Lighting products have long replenishment cycles, and the seller’s inventory strategy for best-selling products was relatively conservative. Once sales exceeded expectations, products could easily sell out ahead of schedule. Replenishment in transit typically took 50–60 days, creating a long “gap period.”
- Impact:
- Best-selling SKUs disappeared from the available-for-sale pool, interrupting existing high-conversion advertising entrances;
- The amount of high-quality traffic that overall advertising could capture decreased, making it appear that “advertising suddenly stopped working”;
- Total store sales declined accordingly, making it easy to mistakenly assume that the advertising tool or team had failed.
- Evidence: During renewal discussions, the service provider clearly pointed out that the recent sales decline was mainly caused by stockouts of several best-selling child SKUs. As inventory recovered, DeepBI Ads sales and total sales rose together, while ACOS actually improved.
Problem 2: The replenishment cycle was disconnected from the advertising rhythm, and budget adjustments lacked foresight
- Cause: During periods of tight inventory and replenishment in transit, the seller had not designed an advance “tighten advertising–scale advertising” rhythm. Decisions were instead based largely on current impressions and short-term ACOS changes.
- Impact:
- When inventory pressure emerged, it might already be too late to adjust the budget smoothly. The seller could only make a sharp, passive contraction, making it difficult to sustain previously accumulated exposure and rankings;
- When replenishment was close to arriving, hesitation to increase the budget could result in missing the window to recapture traffic and affect the ramp-up speed after new inventory arrived.
- Evidence:
- The customer only proposed doubling the budget when inventory had become “relatively abundant”;
- Against the backdrop of a long replenishment cycle, the customer’s hope for a more flexible renewal plan also reflected, from another angle, that the budget rhythm had not been fully aligned with the inventory rhythm.
Problem 3: Equating “sales fluctuations” with “an advertising problem” made decisions prone to emotion
- Cause: In daily operations, many sellers are accustomed to judging advertising performance based on monthly sales and overall ACOS. They rarely interpret these metrics within the broader operational context of inventory, stockouts, replenishment, and Listing status.
- Impact:
- During stockouts or replenishment-in-transit periods, the seller saw declining sales and questioned advertising while overlooking the core fact that there were no products available to sell;
- At key moments such as renewal and budget increases, short-term fluctuations could lead the seller to reject a long-term effective advertising mechanism and interrupt the long-term growth curve;
- Trust in DeepBI Ads fluctuated, making it difficult to establish a truly data-driven long-term management model.
- Evidence:
- During a certain period, the customer requested focused attention on the store’s relatively high ACOS and wanted to clarify the source of the problem;
- At the same time, the customer acknowledged that “ACOS is within the expected range, and the budget can be increased when inventory is relatively abundant,” showing a transition from a pure ACOS perspective toward a combined “advertising + inventory” perspective.
Overall, the core challenge for this lighting seller was not that “advertising did not work,” but rather: How can inventory management, budget strategy, and advertising rhythm be integrated under a long replenishment cycle to reduce data misinterpretation and misjudgment?
Optimization Plan
Once it was clear that “the real problem was not just advertising, but also inventory and advertising rhythm,” optimization was no longer limited to bid adjustments. Instead, it involved systematic coordination around three elements: “inventory–budget–advertising.” Based on this case, the actions can be summarized as follows:
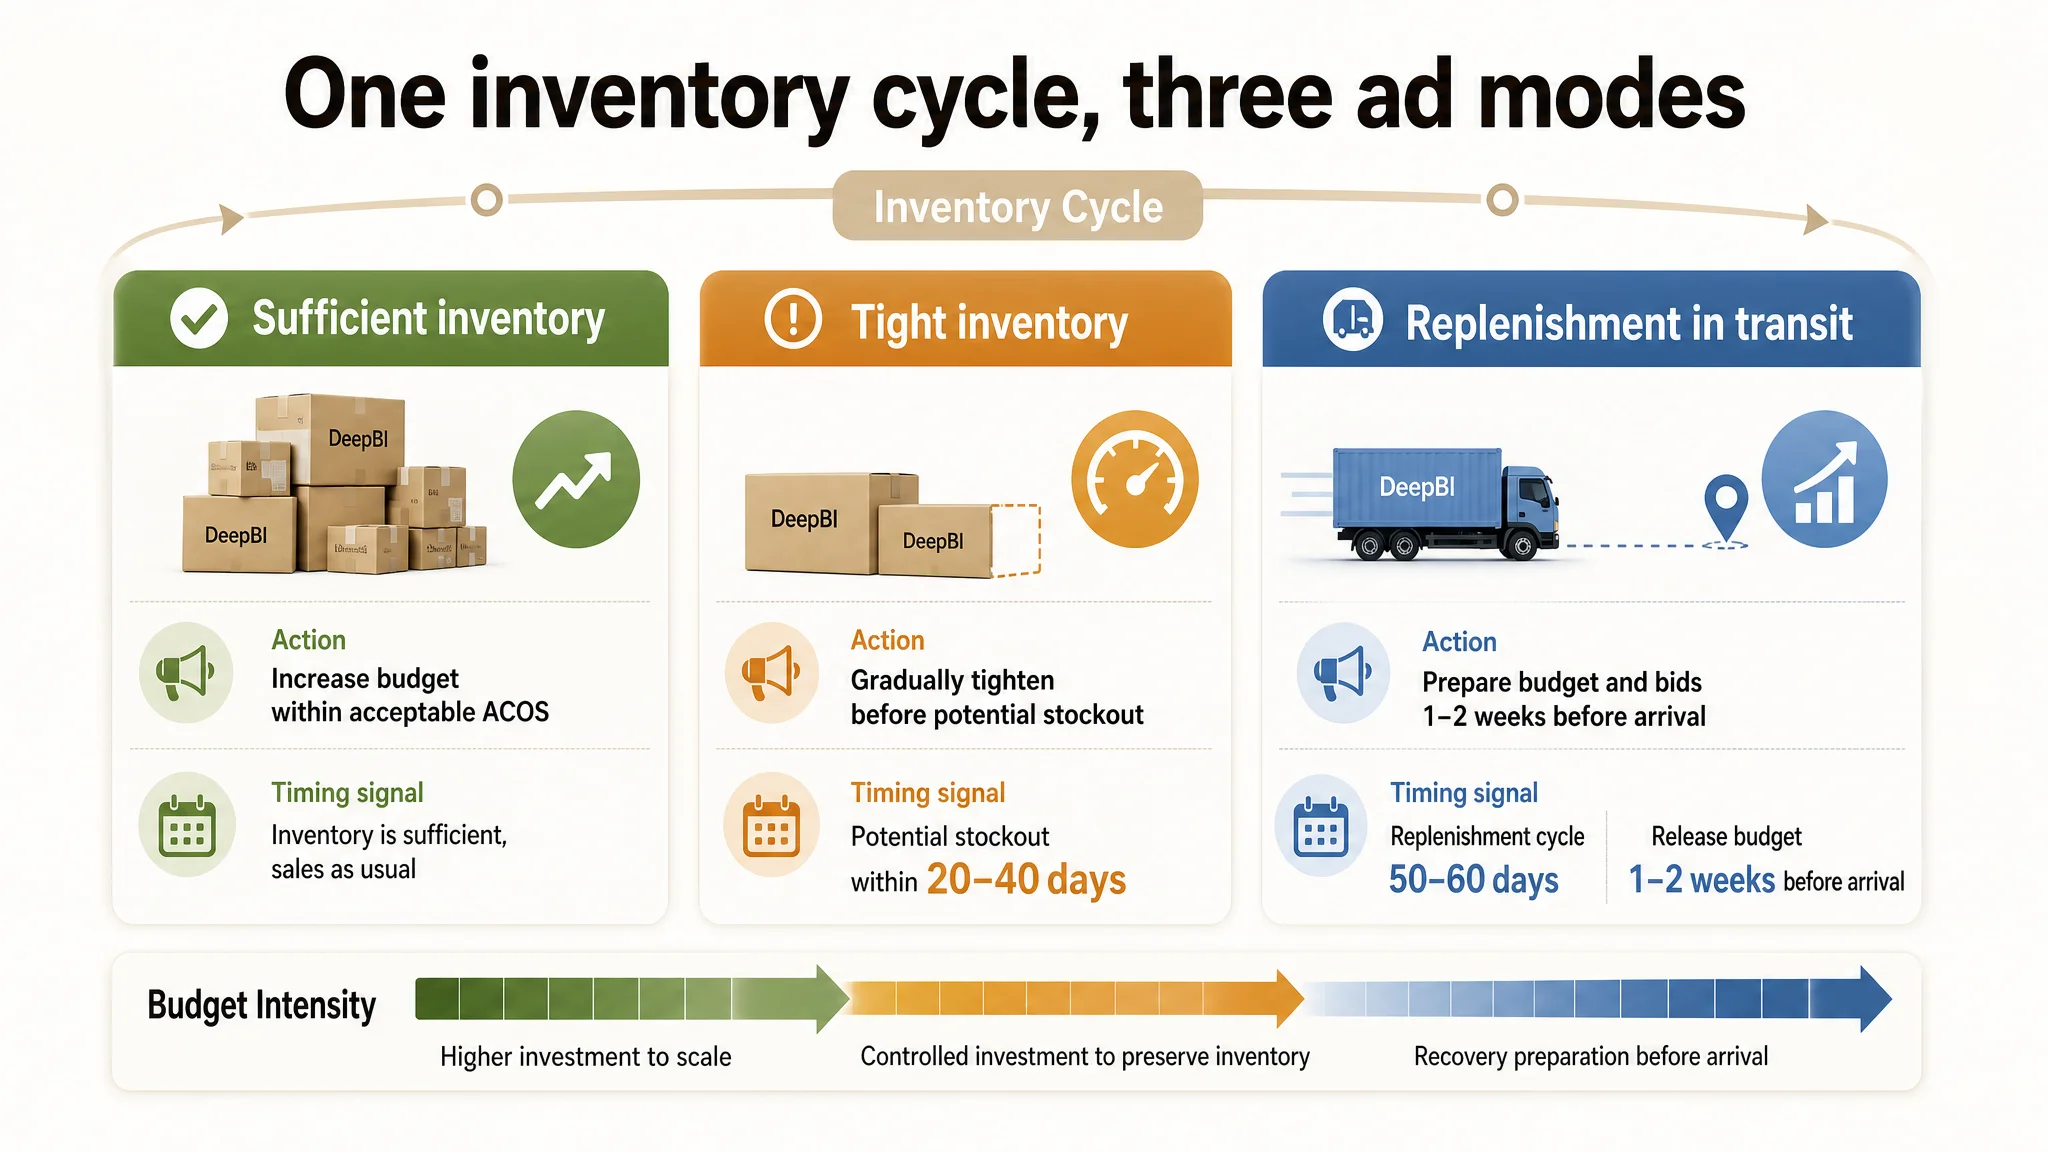
1. Design advertising strategies in stages according to inventory status
Divide the lifecycle of each key SKU into three critical statuses and establish corresponding advertising principles:
- Period of sufficient inventory:
- Within an acceptable ACOS range, appropriately raise the budget ceiling so that DeepBI Ads can capture more traffic;
- For well-performing SKUs, moderately increase bids to expand exposure and raise the share of advertising sales;
- Encourage sellers to proactively request “budget increases” or “budget reservations” during this stage and use their inventory advantage to capture rankings.
- Period of tight inventory (potential stockout within 20–40 days):
- Gradually tighten the budget, especially for SKUs expected to sell out in the short term, and reduce unnecessary high-priced traffic acquisition;
- Shift more exposure toward SKUs with relatively sufficient inventory and healthy margin structures, avoiding a situation in which the last available units are sold through advertising but no inventory remains to fulfill demand;
- Shift the focus of ACOS monitoring from whether the absolute value is high or low to whether it has significantly deteriorated or exceeded the safe margin threshold.
- Stockout or replenishment-in-transit period:
- For ASINs that are already out of stock, ensure that advertising spending stops;
- For products whose replenishment is about to arrive, loosen budgets and bids 1–2 weeks in advance to prepare for a rapid ranking recovery after replenishment;
- Adjust the overall advertising goal from “extreme ACOS control” toward “balancing ACOS and recovery speed.”
2. Build a key-SKU list and inventory alert mechanism together with the seller
In advertising structure and operational communication, place particular emphasis on the following:
- Have the seller provide, or work with the service provider to identify, a list of key SKUs that contribute significantly to total sales and have long replenishment cycles;
- Communicate budget adjustment strategies before the inventory of these SKUs enters a tight range, rather than responding passively after a stockout occurs;
- In the DeepBI Ads management dashboard, coordinate campaign grouping and budget tiers so that traffic allocation can be adjusted according to inventory strategy.
3. Use data to reconstruct advertising’s true capabilities when inventory is available
At key moments such as renewal and budget adjustments, DeepBI focuses on helping sellers with two tasks:
- Extract advertising curves from periods when inventory was sufficient and products were available to sell, showing the sales and organic traffic lift generated by advertising under similar budget and ACOS ranges;
- Compare the curves during stockouts and replenishment-in-transit periods to clearly identify which fluctuations were caused by inventory and which details represented opportunities for advertising optimization.
This type of analysis means sellers do not have to focus only on “overall monthly ACOS.” Instead, they can see what level this advertising system could approximately achieve if inventory were not holding it back.
4. Set a budget cadence that matches the replenishment cycle
Considering the seller’s practical constraint that replenishment requires 50–60 days, provide more actionable budget-planning recommendations:
- When replenishment is first ordered, do not immediately make a sharp budget cut. Instead, design a gradual tightening path based on the expected arrival date;
- During the 1–2 weeks before replenishment is expected to arrive, release budget and CPC in advance to create favorable conditions for ramping up after new inventory arrives;
- For cash flow and renewal planning, treat advertising investment and replenishment investment as part of the same cash-flow curve rather than viewing “ACOS” and “inventory costs” as completely separate matters.
Through these optimizations, advertising was no longer an “isolated spending tool,” but a “traffic control valve” connected to inventory rhythm and operational decision-making.
Results
After completing the diagnosis and coordinated adjustments above, the lighting seller’s performance can be observed from three dimensions:
1. Recovery and renewed growth in total sales and advertising sales
- During the first cycle after adopting DeepBI Ads, DeepBI Ads sales were 4,883 US dollars, with ACOS at 27.8%;
- During the scaling period from June to October 2025, DeepBI Ads sales increased to 73,071.7 US dollars, driving total store sales to 128,832.6 US dollars in October 2025;
- After a period of sales fluctuation caused by stockouts of best-selling SKUs, inventory recovered and realigned with the advertising rhythm. In June 2026, total store sales recovered to 120,760.7 US dollars, while DeepBI Ads sales reached 62,354 US dollars.
2. Continued improvement in advertising efficiency
- Throughout the service period, DeepBI Ads ACOS gradually improved from 27.8% in the first cycle to 18.2%, an improvement of nearly 10 percentage points;
- Despite inventory disruptions, ACOS remained controllable at approximately 20% over the medium and long term, ultimately achieving both lower ACOS and higher advertising sales;
- Compared with the early stage of self-managed advertising, when ACOS was as high as 78.8%, overall advertising efficiency underwent a fundamental transformation.
3. A more advanced understanding of the relationship between advertising and inventory
- The seller gradually moved from focusing solely on whether advertising ACOS was high to proactively mentioning information such as “we can increase the budget when inventory is higher” and “replenishment is in transit for 50–60 days” during communication;
- In renewal and budget decisions, the seller no longer simply attributed temporary sales fluctuations to advertising, but first asked: “Was inventory holding us back during this period?”
- Ultimately, the seller established a basic rhythm of “scaling confidently when inventory is sufficient and tightening confidently when inventory is tight,” allowing DeepBI Ads management to capture most of the store’s advertising sales over the long term and in a stable manner.
These results show that even with long replenishment cycles and a high risk of stockouts for best-selling SKUs, connecting inventory rhythm with advertising strategy can not only enable a more objective evaluation of the true capabilities of the advertising tool and team, but also continuously scale total sales and advertising sales while keeping ACOS under control.
Case Summary
The experience of this lighting seller is representative of many Amazon sellers: long replenishment cycles, stockouts of best-selling products, fluctuating advertising performance, and then forced hesitation between “continuing to advertise” and “stopping advertising” when making renewal or budget decisions.
A complete review reveals three key conclusions:
1. The real question is not simply whether “advertising is good,” but whether inventory and advertising rhythm are aligned. This seller’s sales fluctuations and ACOS changes were highly correlated with stockouts of several best-selling child SKUs. When products were available to sell, DeepBI Ads demonstrated the ability to continuously scale sales while reducing ACOS.
2. The truly effective approach is not rigid ACOS control, but staged budget management based on inventory status. Increase budgets and CPC when inventory is sufficient, gradually tighten them when inventory is tight, and treat stockouts and replenishment in transit differently. This allows advertising to serve inventory turnover rather than become a cost center working against inventory.
3. The ultimate result is improved operational stability and decision-making confidence. On one hand, total store sales increased from approximately 45,000 US dollars to more than 120,000 US dollars over a period of more than one year, DeepBI Ads sales grew from 4,883 US dollars to 62,354 US dollars, and ACOS decreased from 27.8% to 18.2%. On the other hand, the seller learned to view fluctuations through the combined lens of “advertising + inventory,” reducing the decision-making risks of cutting budgets, stopping advertising, or hesitating over renewal due to misjudgment.
The shift from “suspecting that advertising had stopped working” to “recognizing that inventory was holding performance back” reflects more than a change in advertising tools. It represents an upgrade in operational thinking—from viewing data in isolation to understanding the entire business chain.
Key Takeaways for Sellers
Takeaway 1: When sales fluctuate, ask “Do we have inventory?” before asking “Is advertising working?” When you see store sales decline and ACOS rise, do not immediately blame advertising. First check:
- Whether best-selling SKUs are available for sale and have sufficient sellable inventory;
- Whether replenishment is in transit and its expected arrival date;
- Whether the Listing has any policy risks or has been removed.
Only after confirming that products are available to sell and the Listing is operating normally should you evaluate whether the advertising strategy needs optimization. This prevents advertising from being blamed unfairly and helps identify the real problem.
Takeaway 2: Design a “cadence schedule” for advertising during the replenishment cycle. For sellers whose replenishment requires 40–60 days, consider planning the advertising rhythm as follows:
- When replenishment is first ordered: Based on existing inventory and estimated sales velocity, determine in advance when to begin tightening the budget instead of waiting until inventory is nearly depleted to make rushed adjustments;
- When replenishment is close to arriving: Loosen the budget and moderately increase bids at least 1–2 weeks in advance to capture traffic and support the ramp-up after new inventory arrives;
- When a stockout is unavoidable: Ensure that advertising for out-of-stock ASINs no longer continues to burn money, and allocate the budget to SKUs that still have inventory and good potential.
Treating the advertising budget as a “metronome” that works with inventory is more effective than repeatedly fighting fires after the fact.
Takeaway 3: To evaluate advertising’s true capabilities, examine the curve during periods with inventory rather than one month’s ACOS. Whether or not you use DeepBI Ads management, you can evaluate performance as follows:
- Extract periods when inventory was sufficient and products were available to sell, and examine the sales and ACOS levels advertising achieved during those periods;
- Separate data from stockout and replenishment-in-transit periods and analyze their impact on the overall curve independently;
- When renewing, switching tools, or adjusting budgets, use performance during periods with inventory as the primary basis for evaluating advertising capability instead of allowing one month’s overall ACOS to dictate the decision.
This way, even amid unavoidable inventory fluctuations, you can still see the true ceiling and optimization potential of the advertising system and make more rational long-term decisions.