

1. Introduction
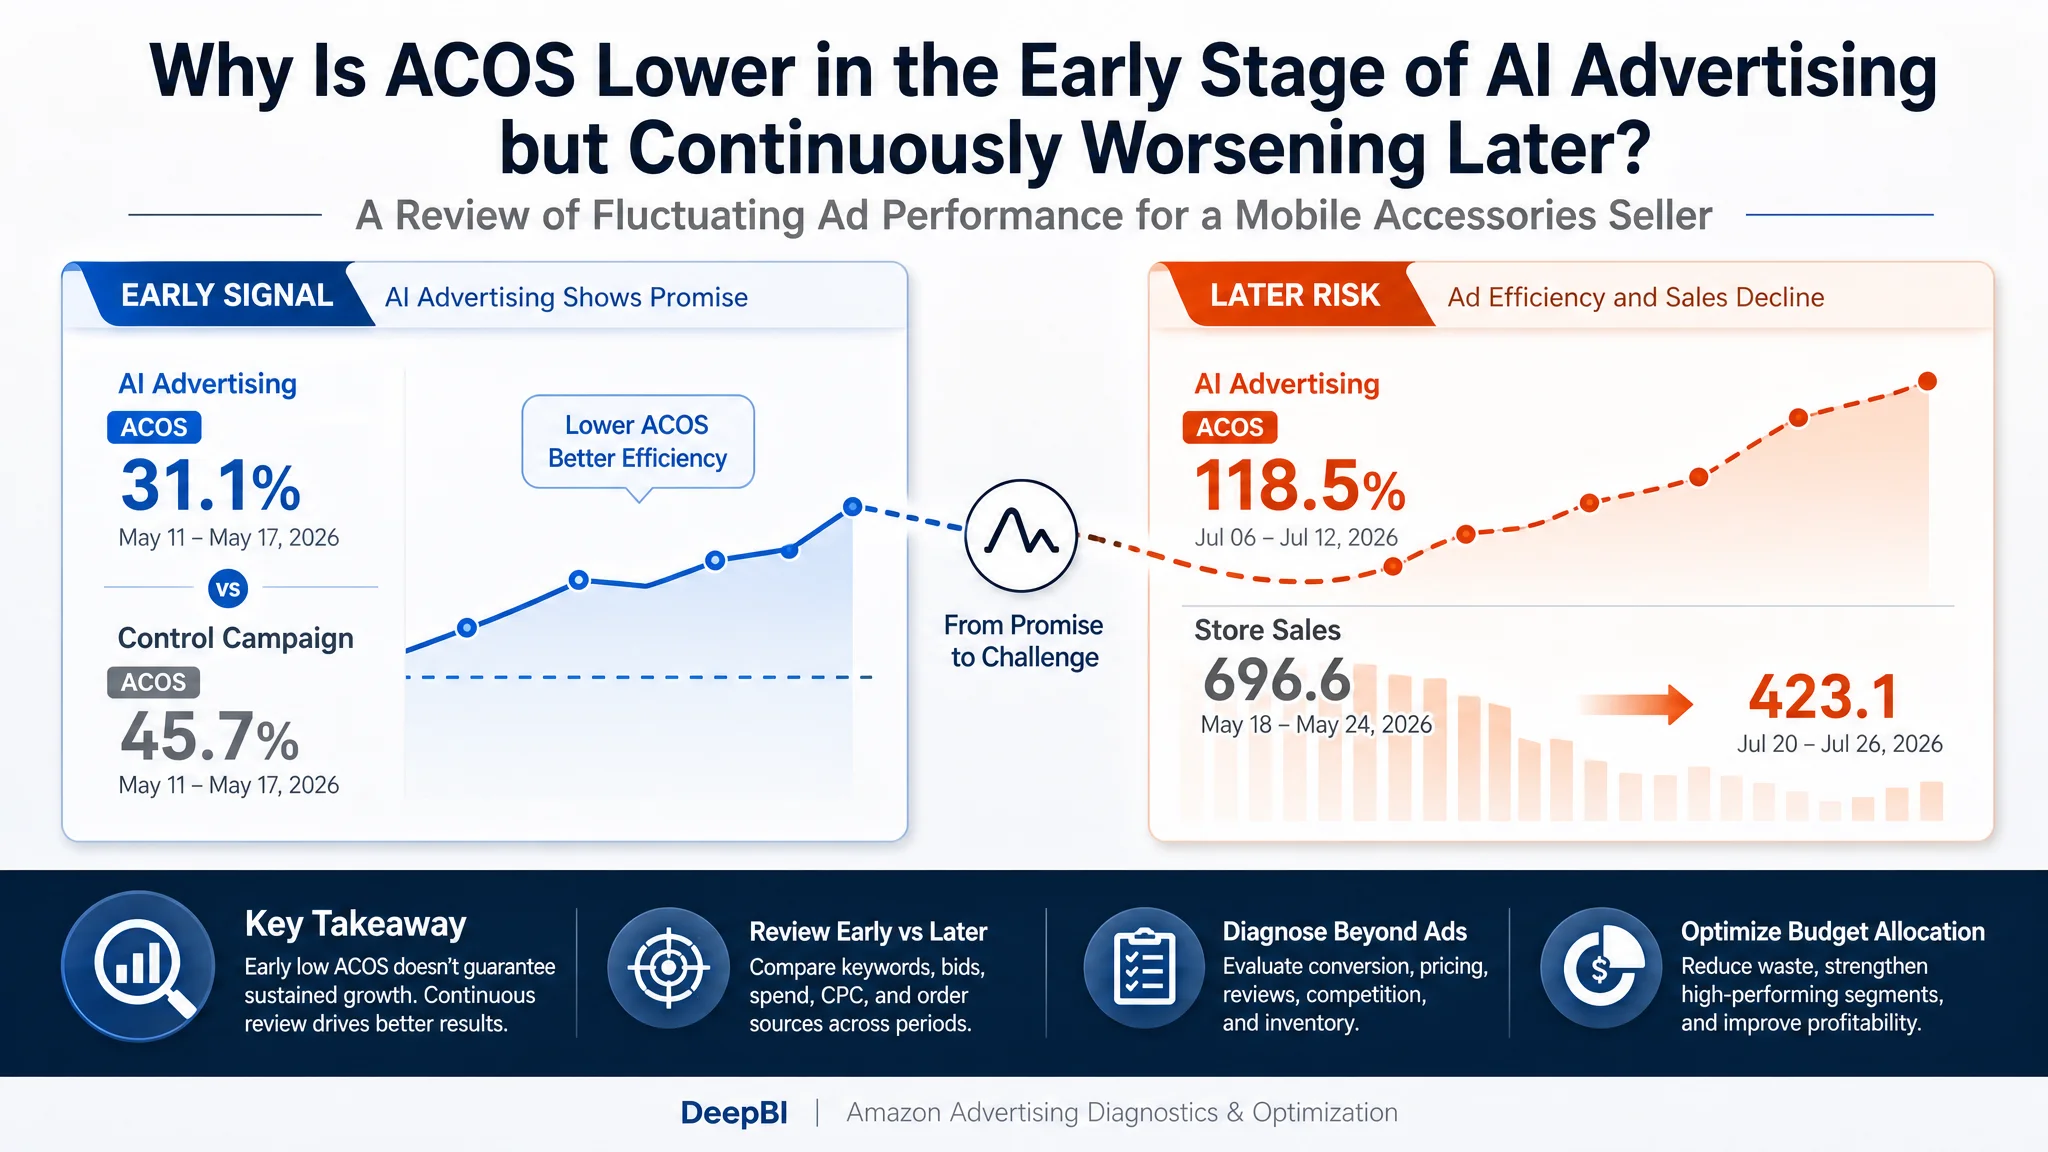
For many Amazon sellers, a low ACOS when an advertising tool first starts running does not mean that the store has already established a stable growth model. A mobile accessories seller on the US marketplace operated 2 products. In the early stage, AI advertising achieved periodic results that were lower than or close to those of the control advertising campaign. However, ad ACOS continued to worsen later, reaching as high as 118.5%, while total store sales also declined from a period high of 696.6 to lower levels such as 203.0 and 254.0. This case did not produce sustained growth results that could be publicly claimed, but it presents a common issue: Why do ads become increasingly unprofitable? Is the problem caused by advertising, or by the Listing, price, reviews, competitive environment, and inventory? By breaking down different periods, advertising methods, and product operating conditions, sellers can avoid making incorrect decisions based solely on a single ACOS metric.
2. Customer Background
The seller operated in the US market of a cross-border e-commerce platform, mainly selling mobile accessories, with 2 products in the store. In May 2026, the customer began using an AI advertising system. The initial goals were mainly twofold: first, to improve advertising efficiency; and second, to reduce manual bid adjustments and verify whether automated advertising could improve store performance.
The early data showed some positive signals. From May 11 to May 17, 2026, AI advertising sales were 237.9, with an ACOS of 31.1%, lower than the 45.7% of the control advertising campaign during the same period. From May 18 to May 24, AI advertising ACOS was 37.2%, close to the control campaign's 37.6%. From June 8 to June 21, AI advertising ACOS was 42.8% and 31.2%, respectively, also outperforming the control campaign during the corresponding periods.
However, these figures represented performance during specific periods only and could not prove that AI advertising had continuously improved store growth. Subsequently, both store sales and advertising efficiency fluctuated significantly, requiring the customer to reassess why the advertising method that performed well in the early stage failed to continue delivering the same results later.
3. The Problem
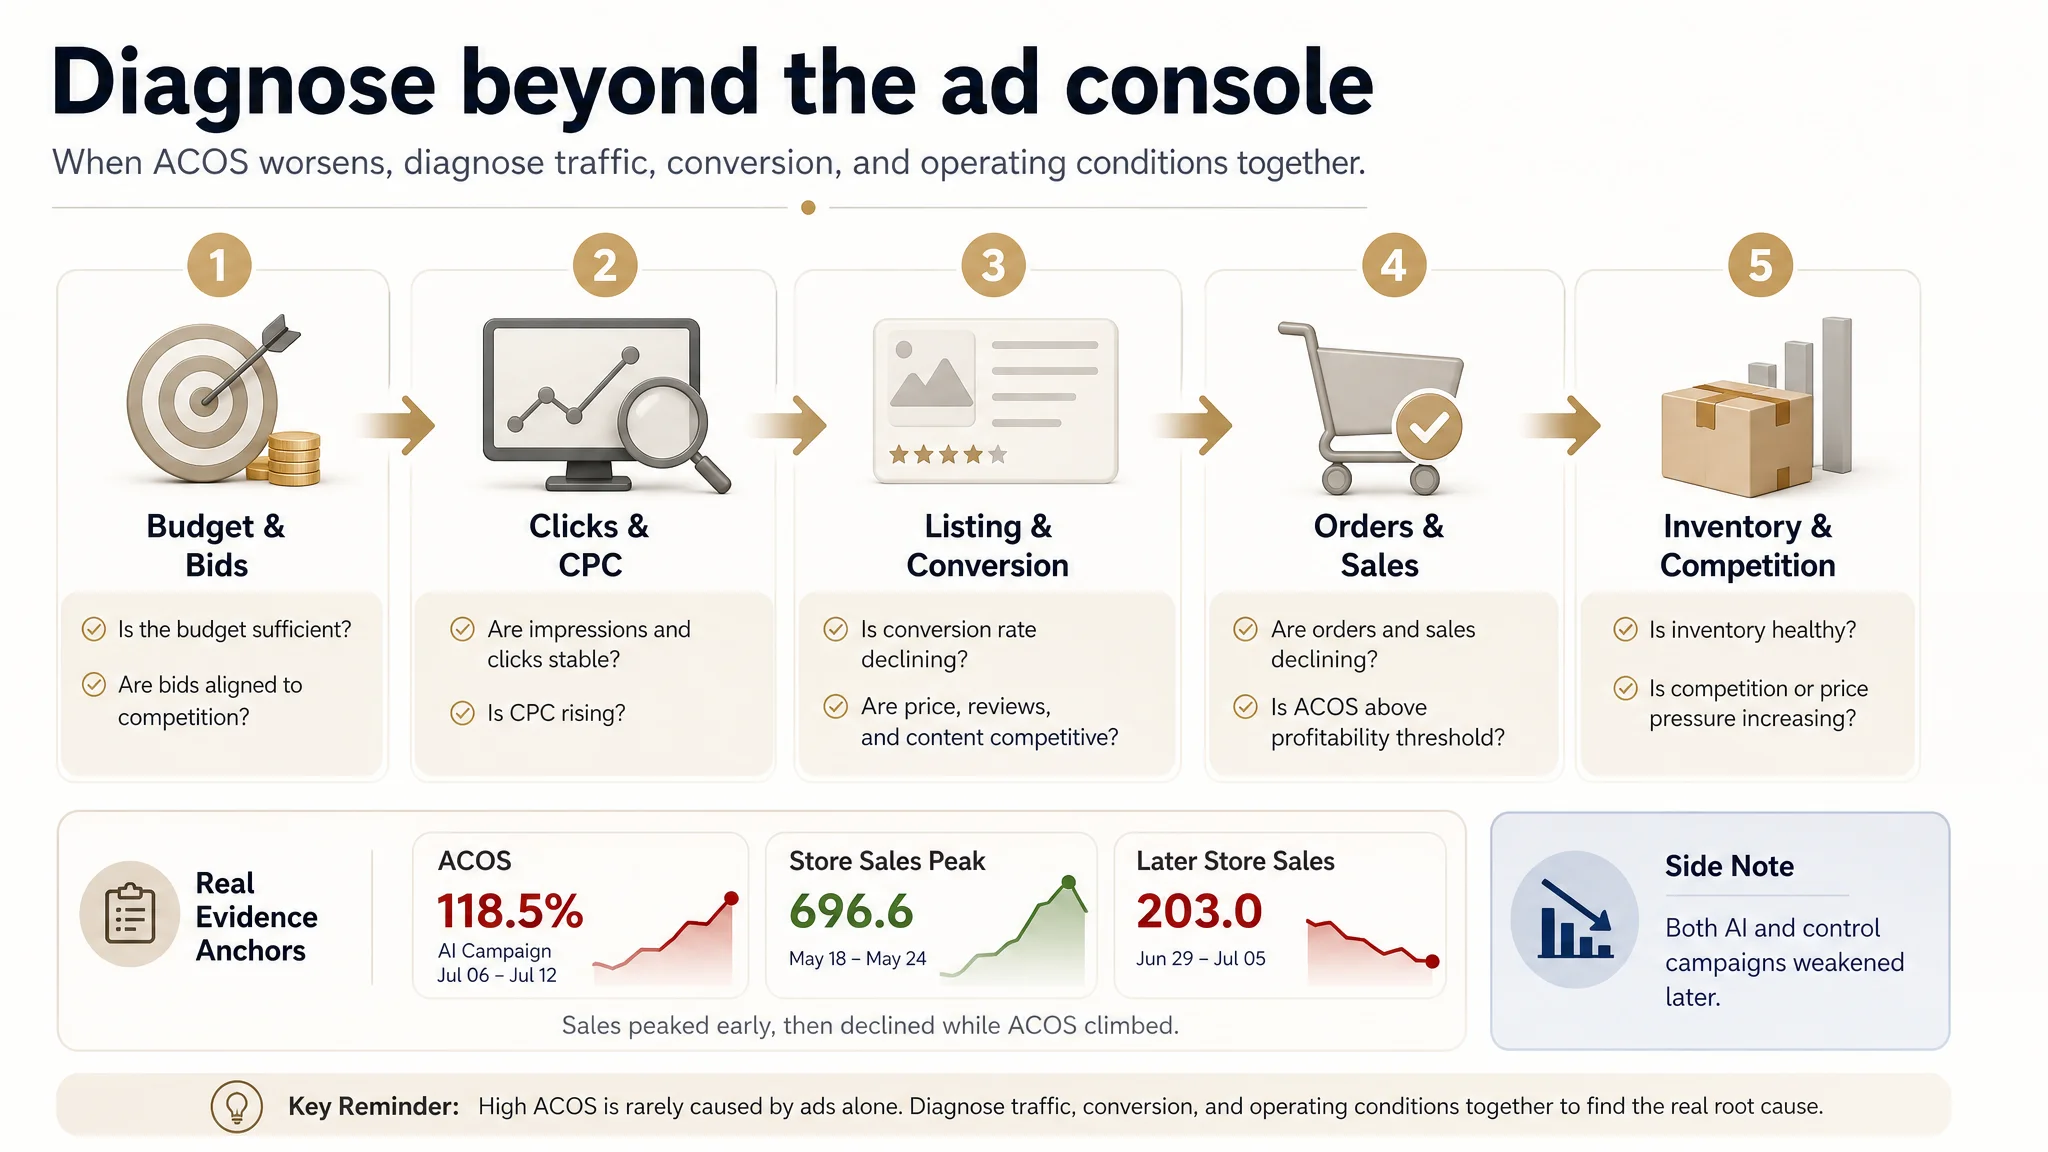
The problem did not begin with a single keyword or one particular bid adjustment. Instead, it was reflected in the combined changes in sales and advertising efficiency.
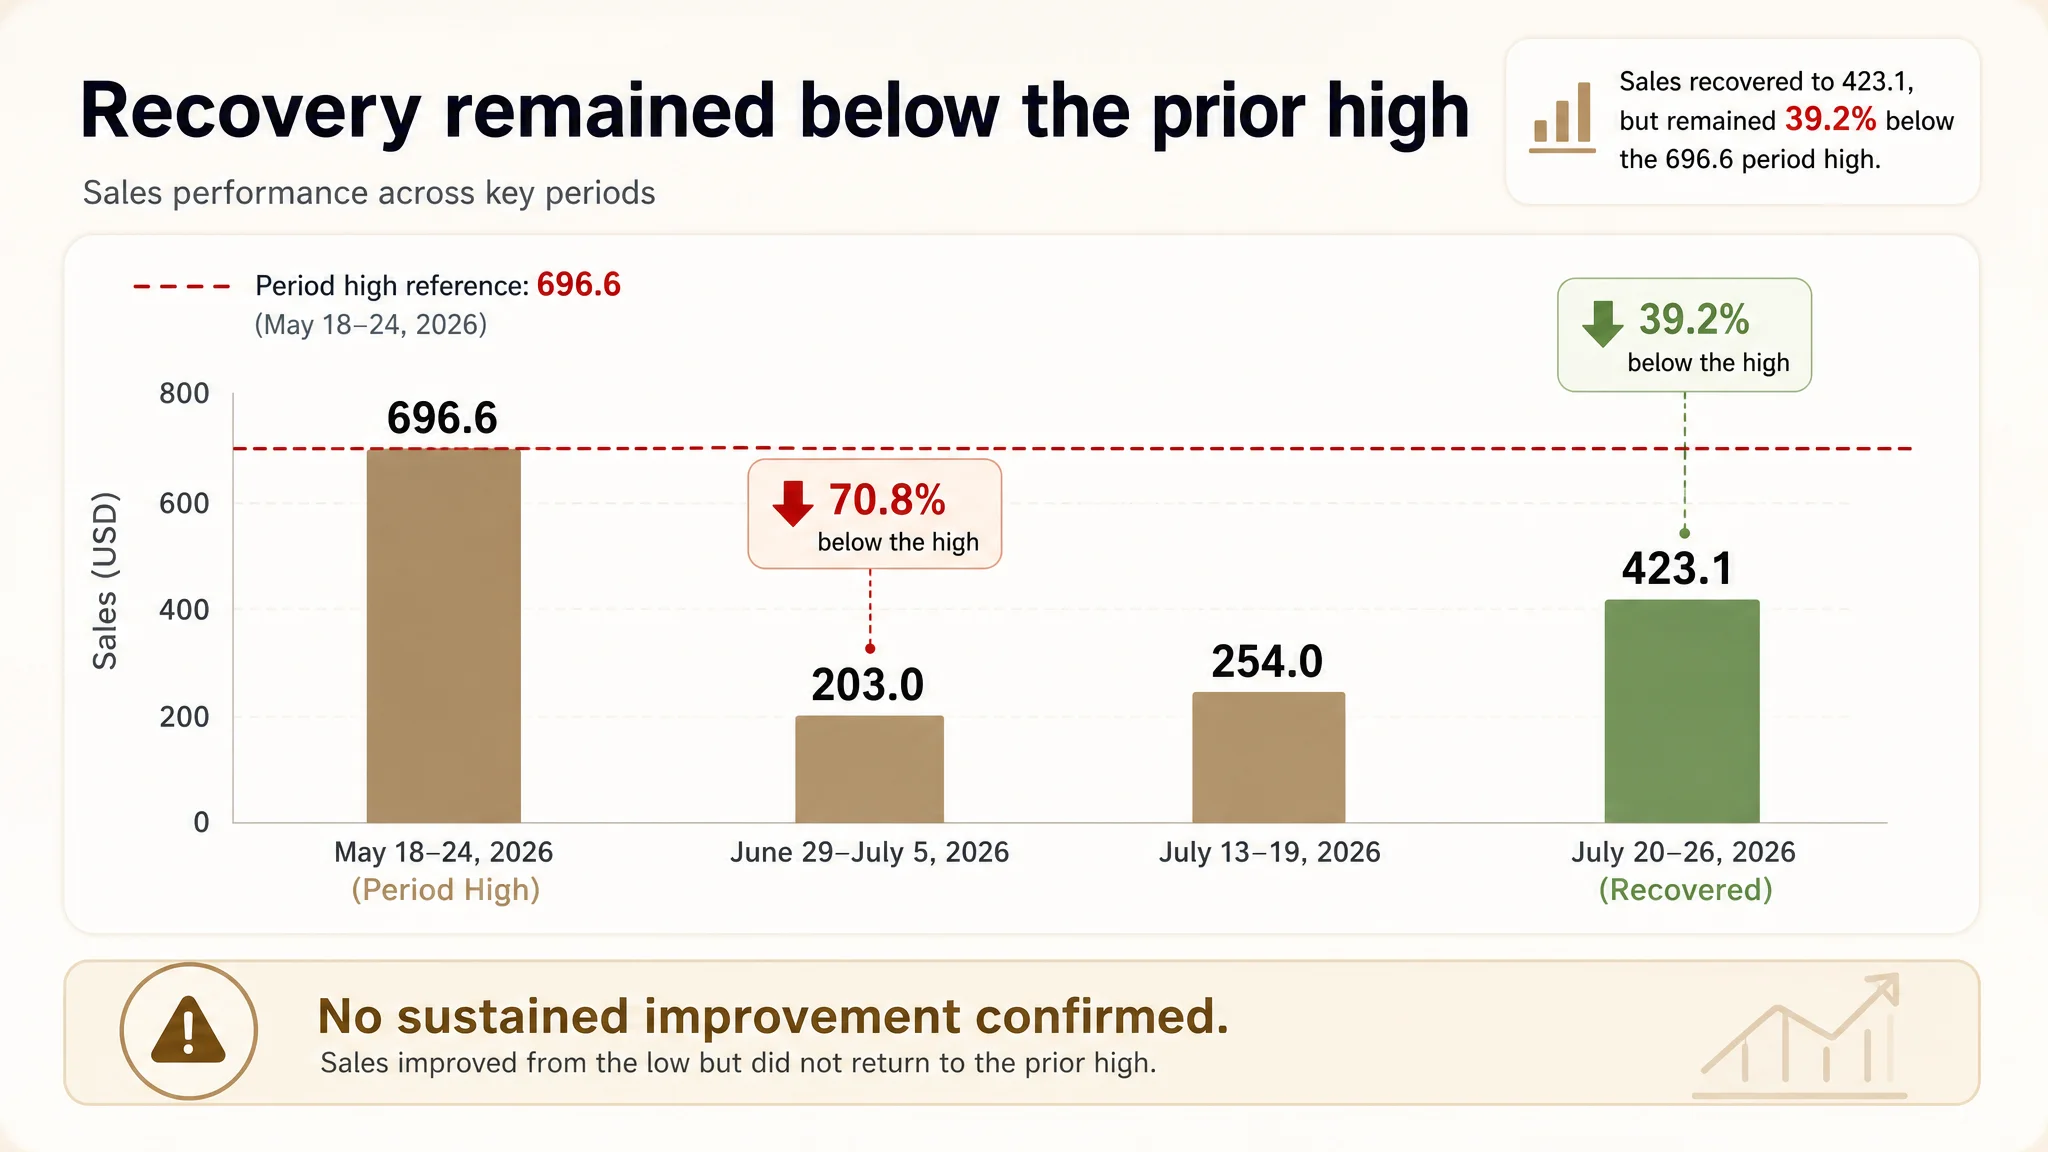
First, total store sales reached a period high of 696.6 from May 18 to May 24, 2026. After that, overall performance gradually weakened. Total sales were 203.0 from June 29 to July 5 and 254.0 from July 13 to July 19. Sales recovered to 423.1 from July 20 to July 26, but remained below the earlier high of 696.6.
Second, AI advertising ACOS changed from periodically acceptable to clearly out of control:
- From May 11 to May 17, 2026, AI advertising ACOS was 31.1%;
- From May 18 to May 24, 2026, AI advertising ACOS was 37.2%;
- From June 1 to June 7, 2026, AI advertising ACOS rose to 86.0%;
- From June 22 to June 28, 2026, AI advertising ACOS was 87.1%;
- From July 6 to July 12, 2026, AI advertising ACOS further increased to 118.5%.
When ACOS exceeds 100%, ad sales are no longer sufficient to cover the advertising spend itself. For sellers, this usually means that ads are consuming budget without generating enough orders. It was also during this period that several common questions arose: Did AI automated bidding cause the problem? Was the budget allocation unreasonable? Should the ads be paused immediately?
However, the case contained another important signal: the control advertising campaign also experienced declining efficiency during the same period. This indicated that the problem might not have been caused solely by the settings of one advertising method. If both AI advertising and the manual or control campaign deteriorate at the same time, the results alone cannot prove that automated advertising caused the losses. Product conversion, price, reviews, the competitive environment, and inventory also needed to be examined.
4. How DeepBI Diagnosed
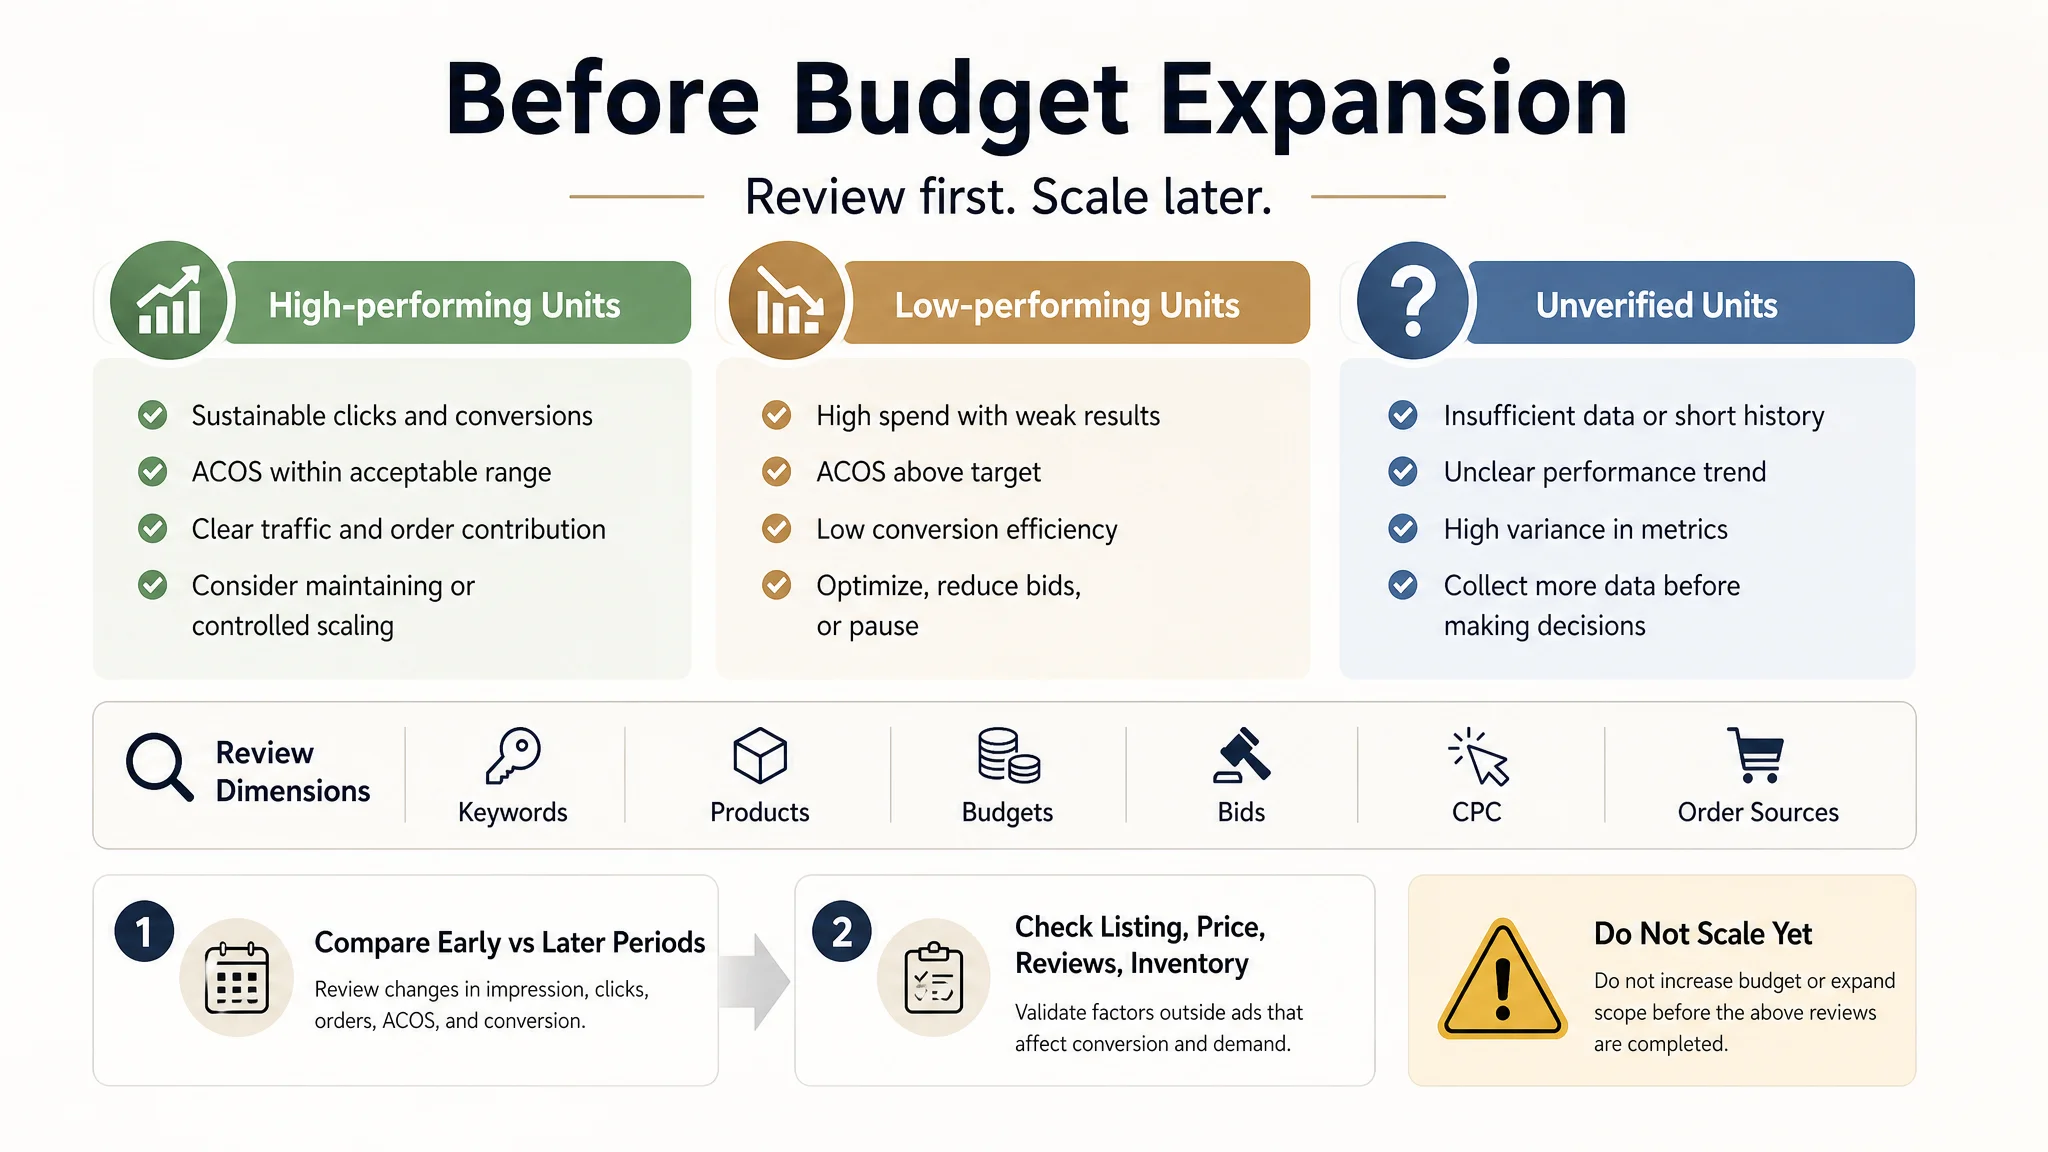
When faced with high Amazon ACOS and declining sales, DeepBI did not immediately provide a single conclusion such as increasing bids or pausing ads. Instead, it first compared the effective periods in the early stage with the deteriorating periods later on to identify where the abnormality occurred.
1. First, determine whether store sales and advertising efficiency changed in tandem.
DeepBI compared sales of 696.6 from May 18 to May 24, 2026, with subsequent periods of 203.0, 254.0, and 423.1, while observing the increase in AI advertising ACOS from 31.1% and 37.2% to 86.0%, 87.1%, and 118.5%. This helped determine whether the issue was simply an increase in advertising costs or whether overall store demand and conversion were also changing.
2. Then compare AI advertising with the control advertising campaign.
In the early stage, AI advertising ACOS was lower than the control campaign in some periods, such as 31.1% versus 45.7%. In other periods, AI advertising was close to or better than the control campaign. However, the control campaign also became less efficient later. Therefore, it was necessary to avoid attributing every issue to AI advertising and to further determine whether common product or market factors existed.
3. Continue breaking down the data by advertising structure and product.
The next step was to review keywords, products, budgets, bids, CPC, and order sources across different periods to determine whether the increase in ACOS was caused by a small number of advertising units or whether both products were experiencing conversion problems overall. The current records did not provide specific keywords, ASINs, or individual product changes, so it was not possible to directly identify a particular keyword or product as the primary cause.
4. Review advertising data together with the Listing, price, reviews, competition, and inventory.
If clicks continued but orders declined, the issue might have occurred on the product page or during the conversion stage. If both impressions and clicks declined, traffic, bids, and the competitive environment required further attention. If inventory was insufficient or the product's sellable status was abnormal, continuing to increase the advertising budget could amplify inefficient spending.
5. Finally, establish period-based validation instead of evaluating a single result.
Early low ACOS could only serve as an observation period and could not prove continuous improvement. DeepBI needed to compare high-performing periods, deteriorating periods, and periods after subsequent adjustments in sequence, validating whether ad sales, ACOS, total store sales, and order sources improved. Based on the current materials, complete follow-up improvement data had not yet been established.
5. The Real Problem
Problem 1: Early low ACOS was mistakenly considered replicable
Reason: AI advertising performed well in some early periods, but these figures reflected advertising results during specific time periods only. They did not yet demonstrate that automated advertising had established a stable model for keyword, product, and budget allocation.
Impact: If the seller used early ACOS figures such as 31.1% and 37.2% to decide that the budget could continue to be expanded, changes in market demand, competition, and product conversion might be overlooked. This could result in increased budget without a corresponding increase in orders later.
Evidence: From May 11 to May 17, 2026, AI advertising ACOS was 31.1%, compared with 45.7% for the control campaign during the same period. However, from June 1 to June 7, 2026, AI advertising ACOS had risen to 86.0%, and from July 6 to July 12, it further reached 118.5%.
Problem 2: The deterioration in advertising efficiency may not have been caused by a single advertising tool
Reason: Both AI advertising and the control advertising campaign became less efficient later, indicating that common factors such as product conversion, price, reviews, the competitive environment, or inventory might also have been involved. The current materials did not complete a step-by-step validation of these factors, so it was not possible to simply conclude that AI advertising had failed.
Impact: If the seller attributed the entire problem to AI advertising, they might only pause or adjust the ads without resolving issues related to Listing conversion, product competitiveness, or sellable status. If the true obstacle was at the conversion end, reducing the ad budget would not restore organic orders.
Evidence: The records clearly showed that the control advertising campaign also experienced declining efficiency during the same period. At the same time, total store sales fell from the period high of 696.6 to 203.0 and 254.0, indicating that the problem might have affected overall operations rather than a single advertising campaign only.
Problem 3: A complete review by period, product, and order source was lacking
Reason: The current data showed changes in sales and ACOS, but did not yet provide continuous, detailed evidence for keywords, products, budgets, bids, CPC, Listing, price, reviews, and inventory.
Impact: Without breakdown data, it was difficult for the seller to answer key questions such as which budgets were generating inefficient spending, which product was dragging down overall ACOS, and whether the decline in sales occurred on the traffic side or the conversion side. As a result, it was also difficult to formulate a clearly bounded budget adjustment plan.
Evidence: What could be confirmed was that AI advertising ACOS later reached 86.0%, 87.1%, and 118.5%, while store sales also remained below the earlier high of 696.6. However, this was not sufficient to confirm the respective responsibility of specific keywords, products, or Listing factors.
6. Optimization Plan
Based on the confirmed observations, the optimization priority should not be to immediately expand the budget. Instead, the seller should first control risks, complete the necessary evidence, and then determine budget allocation.
Advertising Optimization
1. Review advertising performance by separating the early high-performing periods from the later deteriorating periods, and compare keywords, products, budgets, bids, CPC, and order sources.
2. Manage high-performing advertising units, low-performing advertising units, and units that cannot yet be evaluated separately, avoiding the use of overall ACOS to conceal localized waste.
3. Focus on inefficient spending during periods when ACOS exceeded 100%, first confirming whether the budget was concentrated in advertising units with no orders or clearly insufficient conversion.
4. Observe AI advertising and the control campaign simultaneously to avoid making a single attribution solely because AI advertising data deteriorated.
Listing and Conversion Checks
1. Check whether the product page's main image, title, bullet points, description, and core selling points still match target search intent.
2. Compare ad clicks with order changes to determine whether traffic remained available while orders declined, or whether impressions and clicks themselves had already decreased.
3. Recheck changes in price, reviews, and competing products. An increase in CPC cannot necessarily be solved through bid adjustments, and when product competitiveness is insufficient, increasing traffic may only increase waste.
Organic Traffic and Operating Status Checks
1. Check changes in ad orders and organic orders to determine whether the decline in sales was accompanied by a decrease in organic traffic.
2. Verify product inventory and sellable status to avoid increasing advertising traffic while inventory is insufficient or the product status is abnormal.
3. Include changes in competitor prices, reviews, and search results in the period-based review to avoid misinterpreting external competitive changes as advertising strategy problems.
Service and Validation Actions
At this stage, the value of DeepBI was to help the seller break down a sudden increase in ACOS into a list of verifiable questions and determine the next action based on data changes, rather than directly promising to reduce ACOS. Subsequent steps should establish continuous observation periods while recording ad sales, ACOS, total store sales, conversion rate, organic orders, and inventory status. Only after the results of multiple periods following the adjustments have been validated can the seller determine whether the optimization was effective.
7. Results
What can currently be confirmed is the change in the problem, not a final improvement result.
- Total store sales reached a period high of 696.6 from May 18 to May 24, 2026;
- Sales were 203.0 from June 29 to July 5, 2026, a decrease of 493.6 from 696.6, or approximately 70.8%;
- Sales were 254.0 from July 13 to July 19, 2026, a decrease of 442.6 from 696.6, or approximately 63.5%;
- Sales recovered to 423.1 from July 20 to July 26, 2026, but were still 273.5 below 696.6, or approximately 39.2% lower;
- AI advertising ACOS increased from 31.1% from May 11 to May 17, 2026, to 118.5% from July 6 to July 12, 2026, an increase of 87.4 percentage points;
- From June 1 to June 7 and June 22 to June 28, 2026, AI advertising ACOS was 86.0% and 87.1%, respectively, both significantly higher than in the early periods.
Therefore, this case had not yet entered the complete performance validation stage. It could not be presented as a success case in which DeepBI helped the customer achieve sustained growth, continuously reduce ACOS, or recover sales. The current conclusion was that advertising efficiency and store sales had both fluctuated significantly. Further joint diagnosis of advertising, Listing, price, reviews, competition, and inventory was required to identify the true factors dragging down performance.
8. Case Summary
The core issue for this mobile accessories seller was not simply whether AI advertising was good or bad. Rather, there was a clear disconnect between the early period of low ACOS and the later period of high ACOS.
In the early stage, AI advertising achieved an ACOS of 31.1%, lower than the control campaign's 45.7%, and was also close to or better than the control campaign during some periods. However, later AI advertising ACOS rose to 86.0%, 87.1%, and 118.5%. The control campaign also deteriorated during the same period, while total store sales remained below the period high of 696.6.
This showed that evaluating whether Amazon advertising is effective cannot be based on a single period, tool, or ACOS figure. The truly effective approach is to place sales, advertising efficiency, advertising structure, product conversion, organic orders, price, reviews, the competitive environment, and inventory within the same diagnostic framework, and then validate the results of adjustments over consecutive periods.
9. Key Takeaways for Sellers
Takeaway 1: Early low ACOS does not mean that the advertising model is stable
Strong performance from automated or manual advertising during certain periods only shows that the traffic, competitive, and conversion conditions were well matched at that time. Sellers should continue monitoring multiple periods and should not expand the budget or assume that the advertising strategy is mature based solely on one low ACOS result.
Takeaway 2: When advertising is unprofitable, first determine whether the problem is with the ads or the Listing
If clicks have not decreased significantly but orders and conversion rate have declined, sellers should prioritize checking the Listing, price, reviews, product selling points, and competitive environment. If impressions, clicks, and CPC change at the same time, keywords, bids, and budget allocation should be examined further. Advertising problems and Listing problems need to be distinguished through data breakdowns rather than intuition.
Takeaway 3: AI advertising optimization requires comparable validation periods
To determine whether Amazon advertising optimization is effective, sellers need to compare ad sales, ACOS, total store sales, organic orders, and conversion performance before and after adjustments, while also observing AI advertising and the control campaign. Only when consistent changes appear across multiple consecutive periods can sellers determine whether budget allocation or advertising strategy has genuinely improved operating results.
For sellers experiencing high Amazon ACOS, declining ad sales, or increasingly unprofitable advertising, the most important first step is neither to blindly increase the budget nor to immediately shut down all ads. Instead, they should first identify the level at which the problem occurred: budget, keywords, product, Listing, conversion, inventory, or the competitive environment.