

1. Introduction
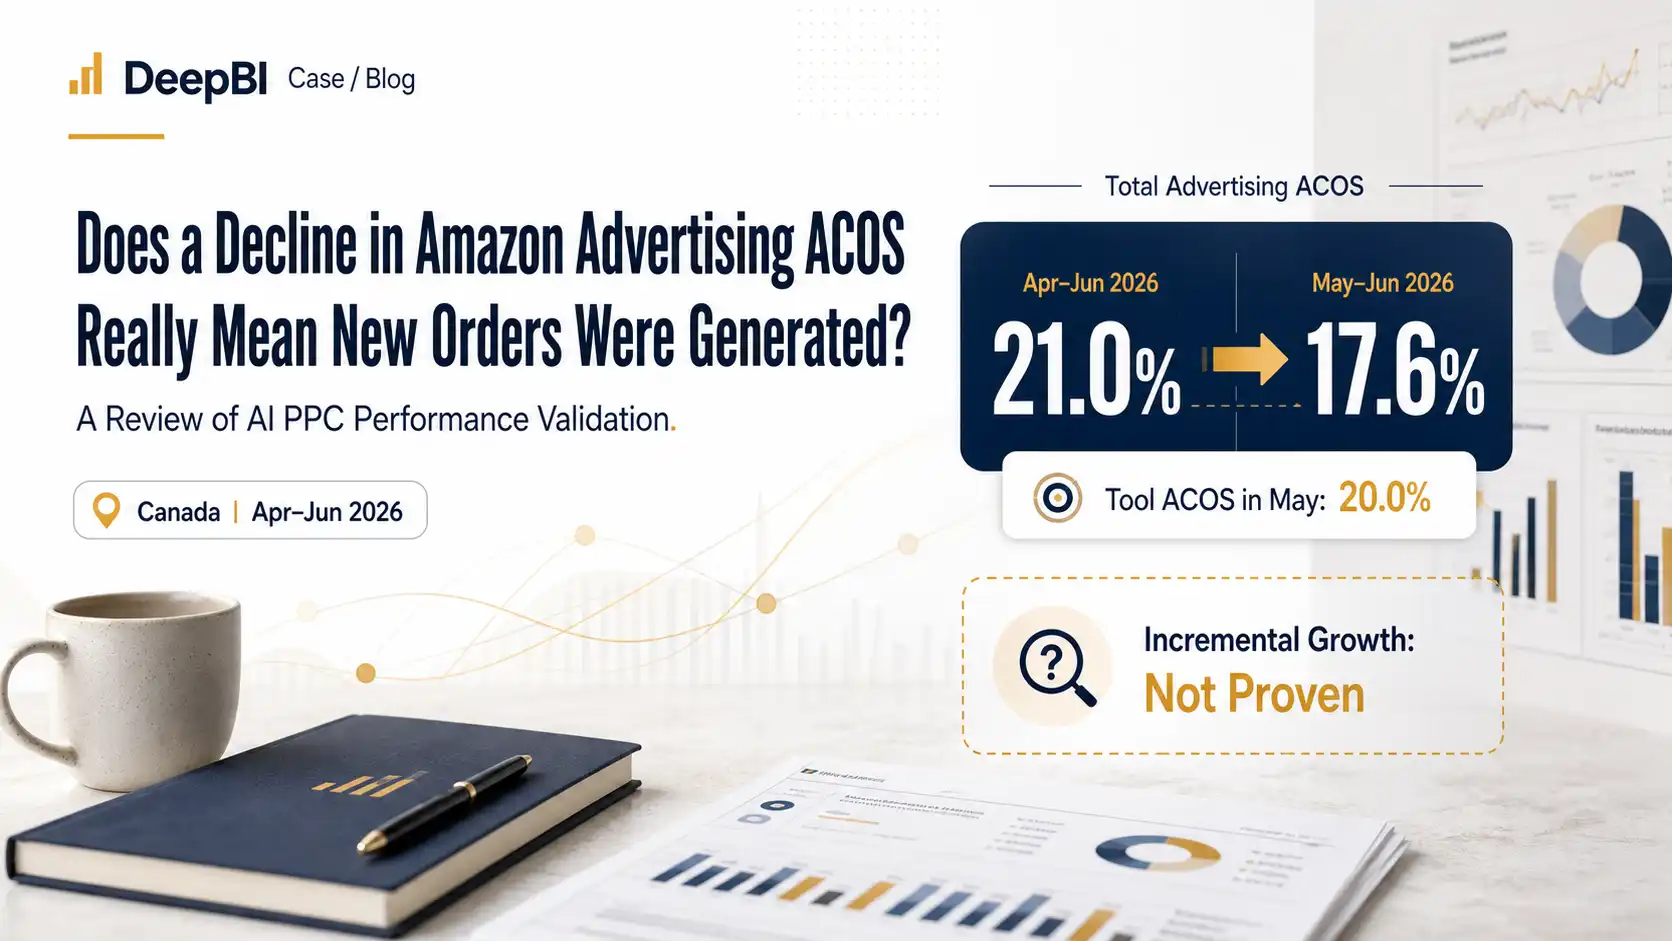
Ads have generated sales, and ACOS has remained low. Does that necessarily mean the campaigns have driven true growth? A mobile accessories seller on a European marketplace had approximately 90 active ASINs. After launching AI Ads, the seller generated approximately 7.38万 in sales in June, with an ACOS of approximately 4.0%; in the first half of July, AI Ads generated approximately 4.00万 in sales, with an ACOS of approximately 3.8%. However, the customer still could not confirm whether these orders were entirely incremental or whether existing ad orders had simply shifted between campaigns. The customer also could not determine whether the ads had genuinely increased organic traffic or product profitability. This case shows that evaluating Amazon Ads performance requires more than looking at ad sales and ACOS. It also requires phased validation based on ad attribution, organic sales, key ASINs, inventory changes, and product profitability.
2. Customer Background
 The customer is an Amazon seller of mobile accessories, primarily targeting a European marketplace, with approximately 90 active ASINs in the store. As the scale of store and advertising management expanded, the customer planned to extend the AI advertising tool to multiple stores and countries. Early priorities therefore included multi-store integration, sub-account management, authorization security, and reducing manual operating costs.
After the ads launched and began generating orders, the customer's focus changed. At this point, simply asking whether there were orders was no longer the core issue. The customer was more concerned about four questions:
- Were the orders generated by AI Ads transferred from existing ad orders?
- Did the ads drive changes in organic traffic and organic rankings?
- After ad sales converted to other Listings, were the target products still profitable?
- Could the advertising strategy be adjusted promptly amid business changes such as new product launches, warehouse transfers, and stockouts?
Therefore, this was not simply a question of whether the ads were effective. It was a question of how to attribute incremental ad performance, organic traffic, and product profitability.
3. The Problem
 Ad Sales Looked Strong, but Incrementality Could Not Yet Be Confirmed
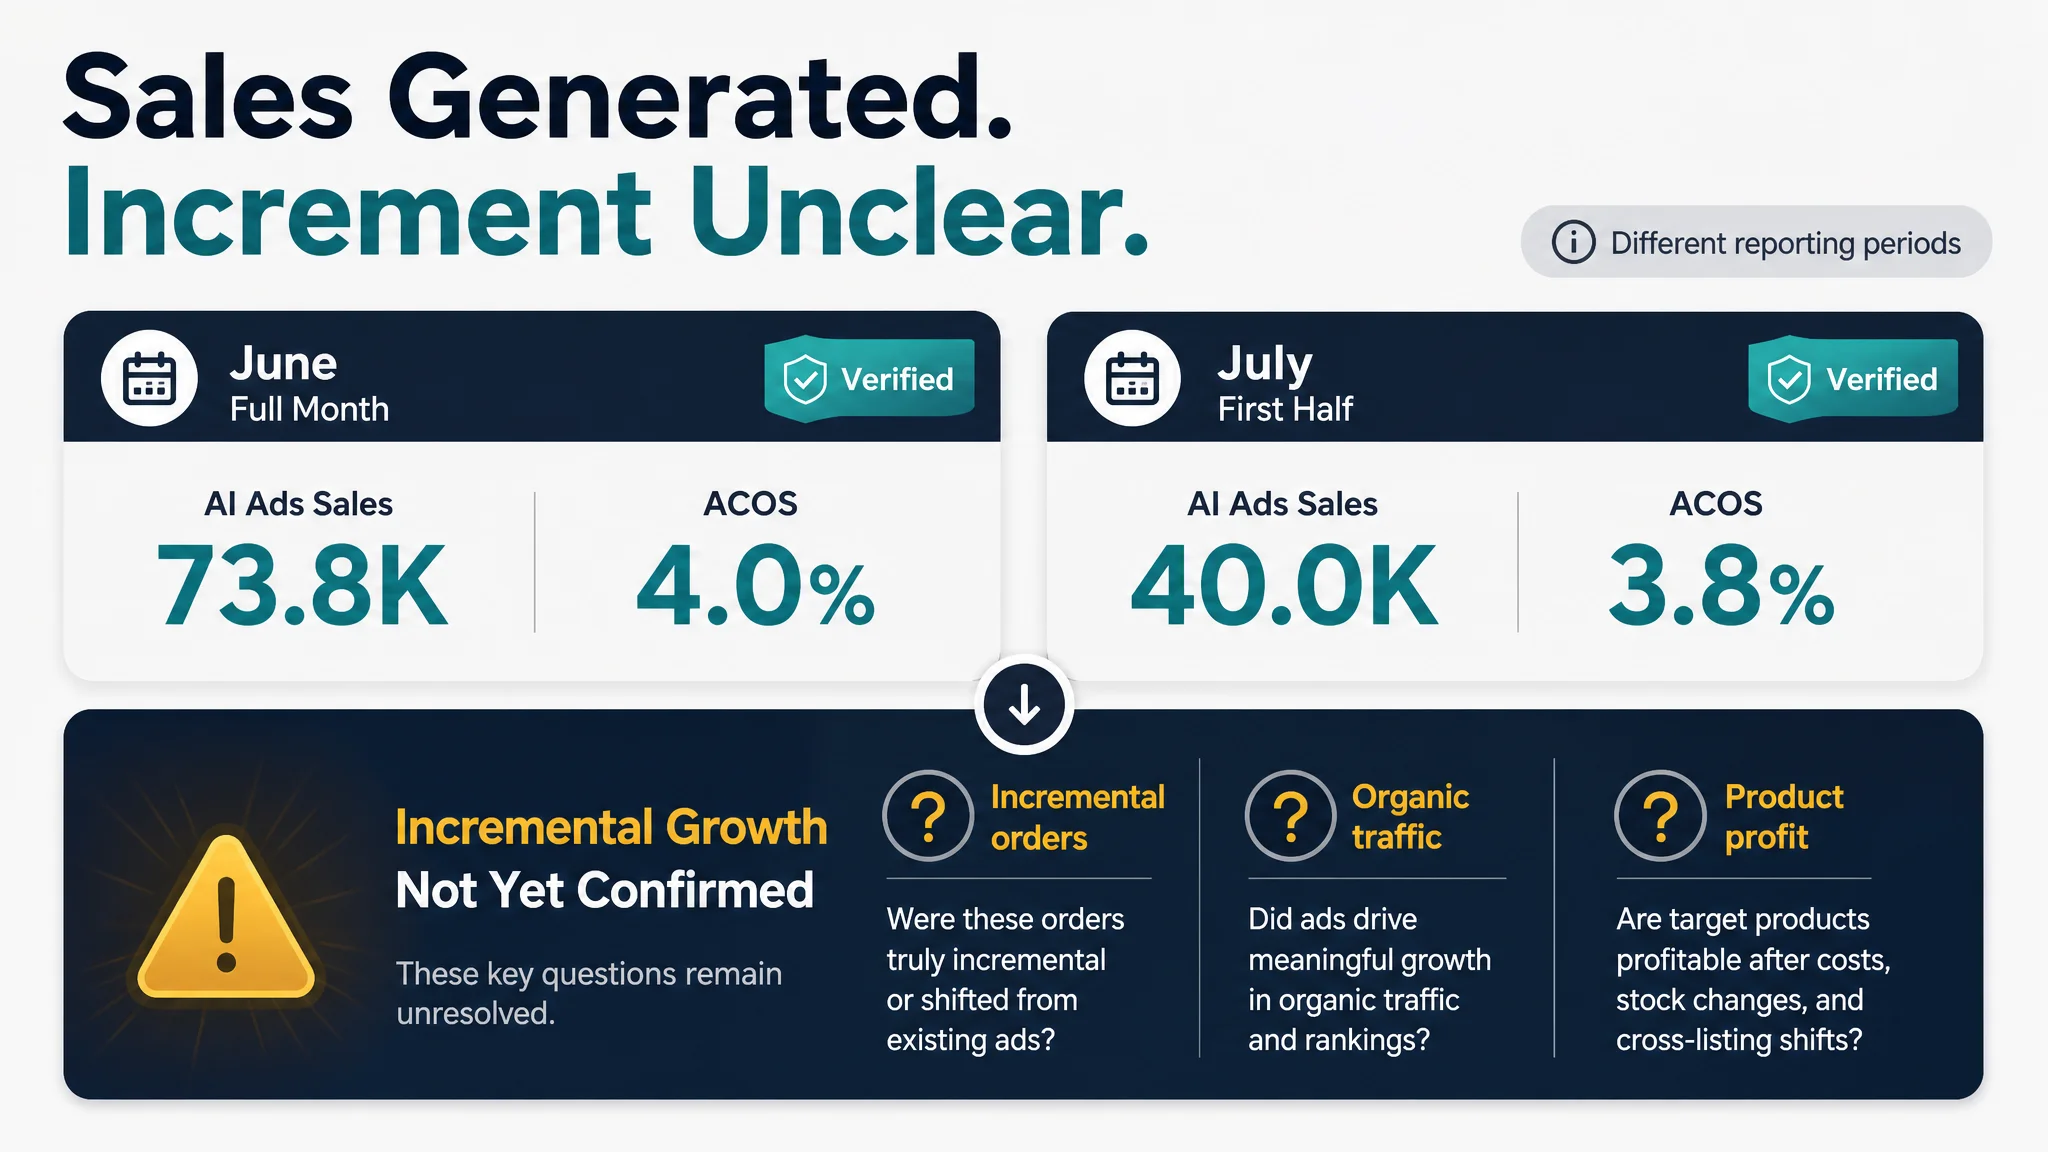
In the full month of June, the store generated approximately 47.25万 in sales, while AI Ads generated approximately 7.38万 in sales, with an ACOS of approximately 4.0%. In the first half of July, the store generated approximately 21.68万 in sales, while AI Ads generated approximately 4.00万 in sales, with an ACOS of approximately 3.8%. On the surface, the data showed that AI Ads had already generated orders and that campaign efficiency was relatively stable.
However, for the seller, ad sales did not equal incremental sales. The customer needed to answer several additional questions: Without this group of AI Ads, would these orders still have been generated through the original advertising campaigns? If sales from the original campaigns decreased while AI Ads sales increased, did the store actually gain more total orders? If orders shifted from one Listing to another, how should total store sales and product profitability be calculated?
This is also the real concern many sellers face when asking whether Amazon Ads are taking credit for orders: the advertising reports show conversions, but the store's overall business performance may not have improved to the same extent.
A Low ACOS Cannot Directly Prove Improved Profitability
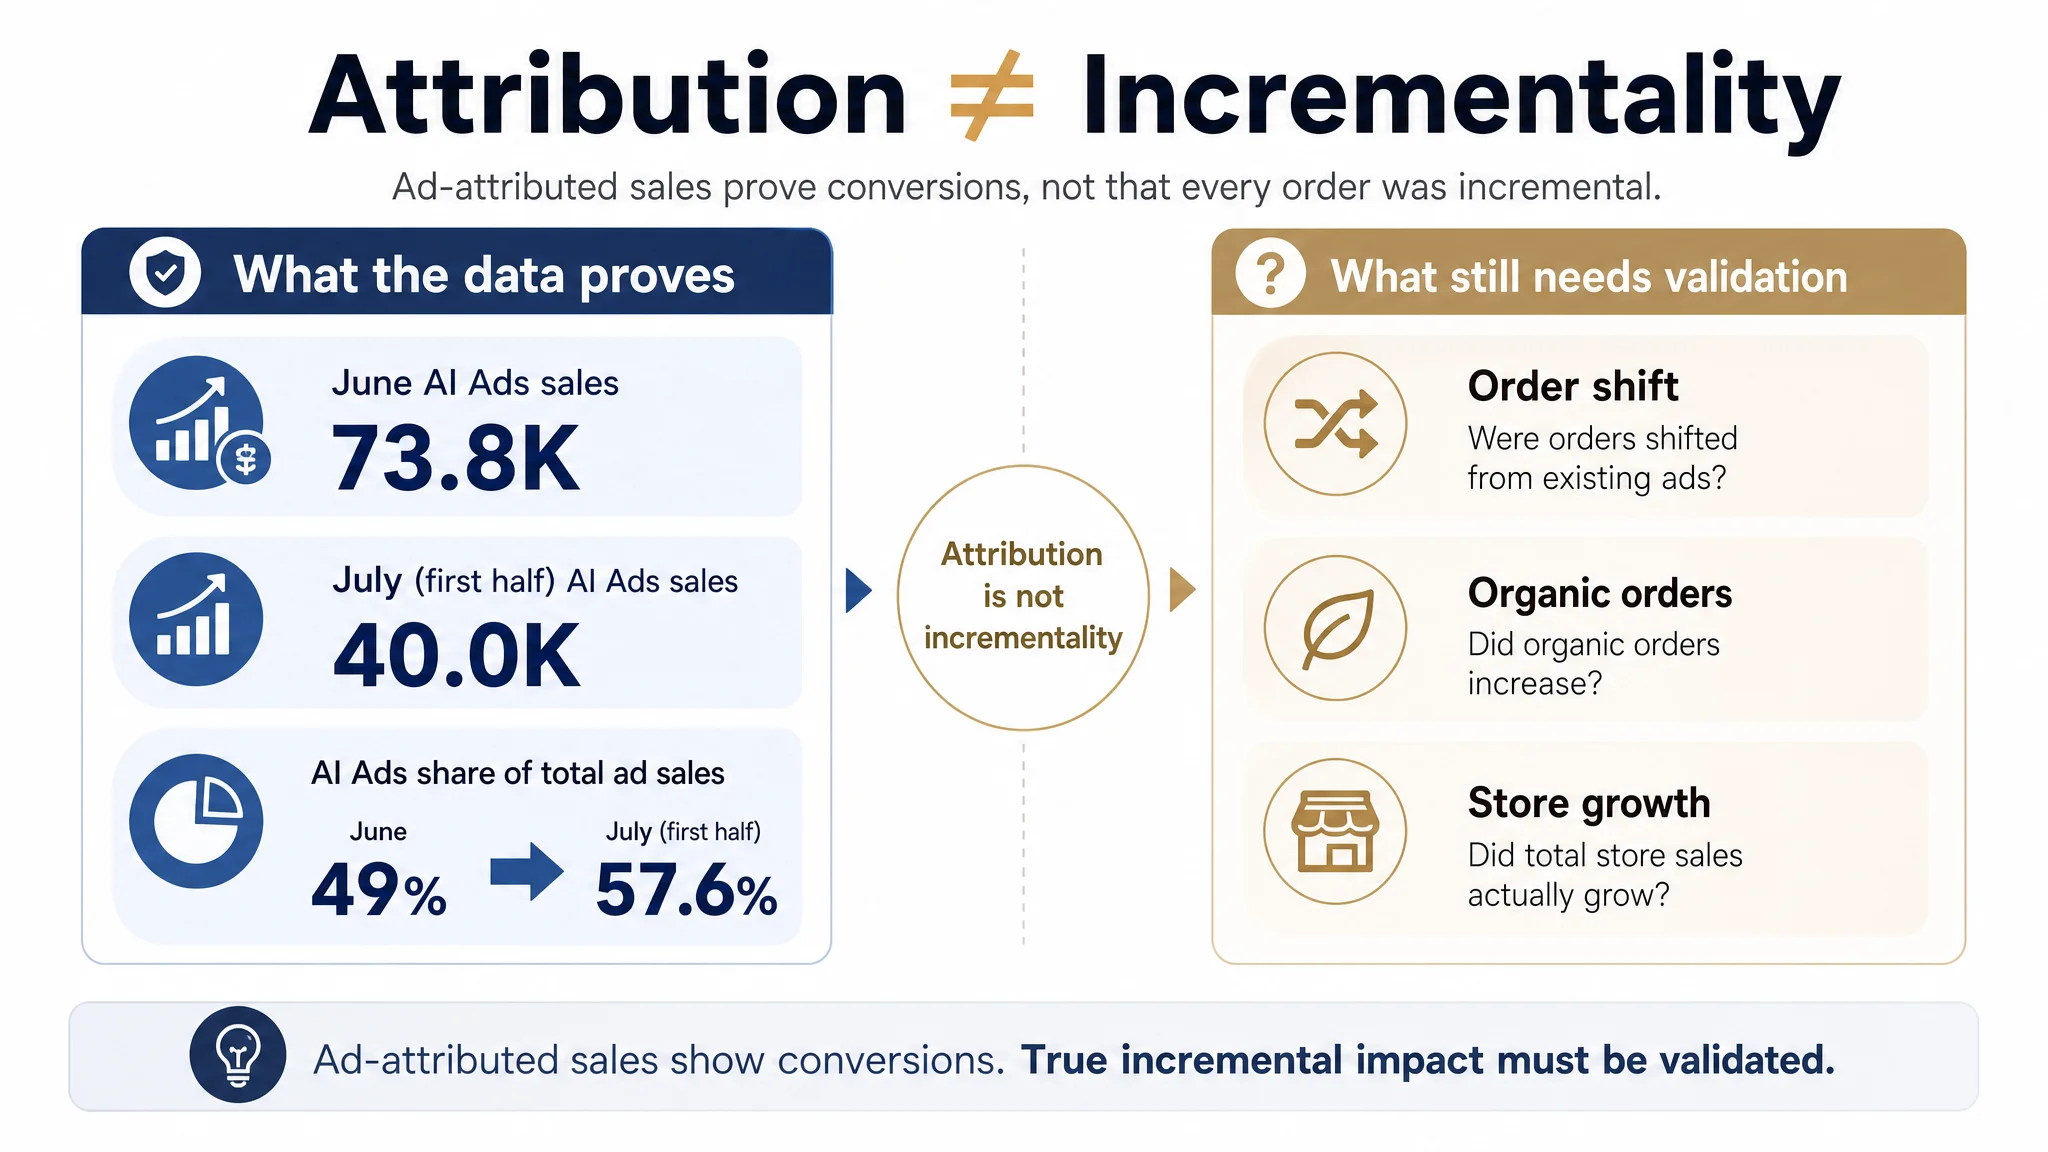
AI Ads had an ACOS of approximately 4.0% and 3.8% across the two reporting periods. During the same periods, the share of AI Ads sales in total ad sales increased from approximately 49% in June to approximately 57.6% in the first half of July. These figures show that AI Ads generated sales and that campaign efficiency remained relatively stable during the periods observed.
However, ACOS only reflects the relationship between ad spend and attributed ad sales. It cannot independently determine whether a product is profitable. Mobile accessory products may be affected by procurement costs, storage costs, warehouse transfer costs, promotional discounts, and cross-Listing conversions. If ad orders ultimately go to a Listing with lower margins, or if the target product goes out of stock, a low ACOS does not necessarily mean that product-level profitability has improved.
A Stable Organic Sales Share Does Not Prove Organic Traffic Growth
The share of organic sales in the customer's store was approximately 68% and remained stable overall. This indicates that organic sales continued to represent an important part of the store's sales, but “remaining stable” and “being driven to grow by ads” are two different conclusions.
To answer whether Amazon Ads drive organic traffic, it is also necessary to examine organic orders, organic sales, organic keyword rankings, and changes in non-ad conversions for key ASINs before and after the campaigns. The current information is insufficient to prove significant organic traffic growth. Therefore, a stable organic sales share alone cannot be attributed to AI Ads.
4. How DeepBI Diagnosed
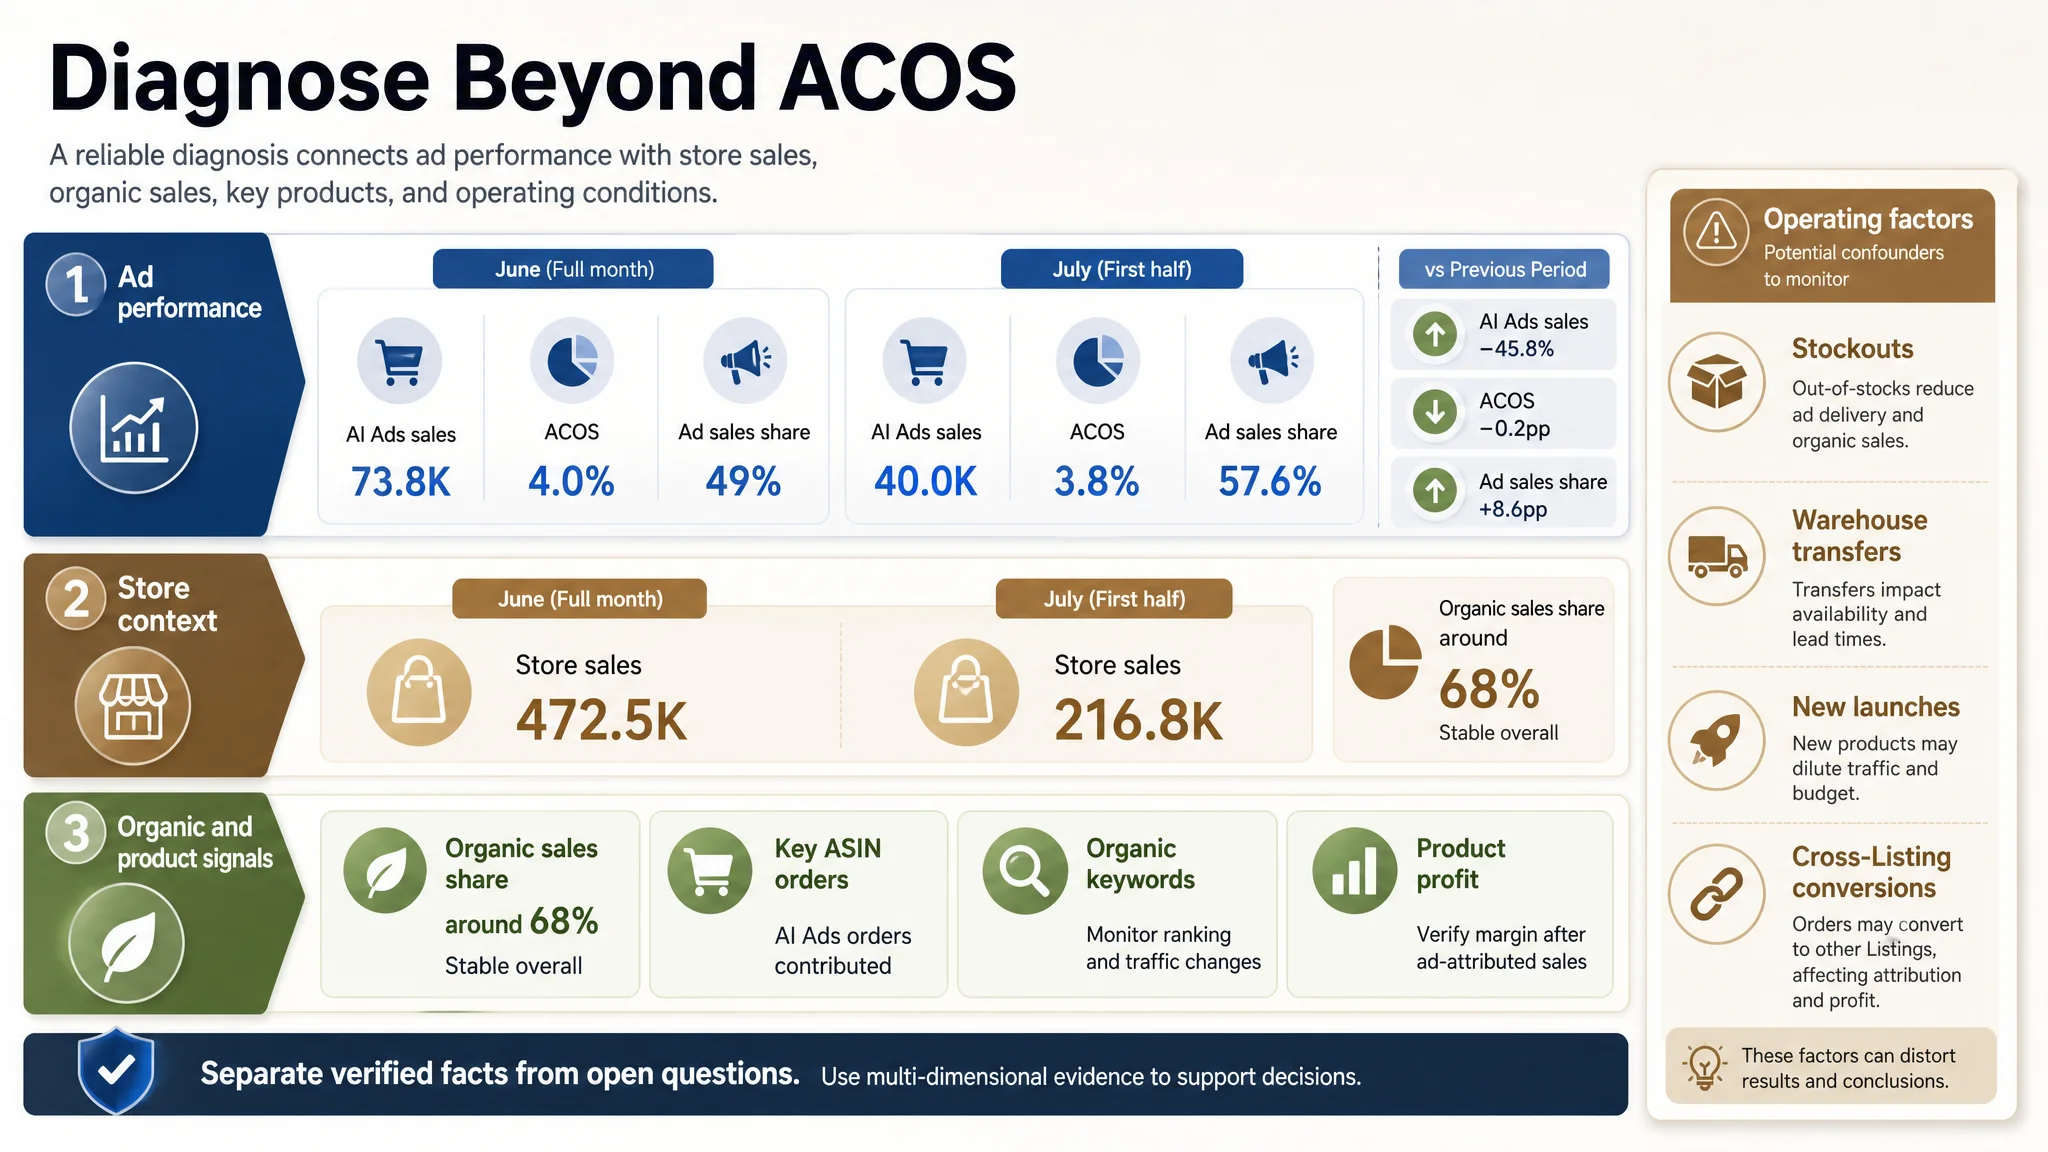 DeepBI did not equate a low ACOS directly with advertising success. Instead, it broke down the situation in the following order: overall ad performance, the store as a whole, key products, and operational interfering factors.
1. First, review overall ad performance. Compare AI Ads sales, ACOS, and the share of AI Ads sales in total ad sales for the full month of June and the first half of July to confirm whether AI Ads had generated an observable contribution in orders.
2. Then distinguish the reporting periods. The June data covers a full month, while the July data covers only the first half of the month. Sales for the two months cannot be directly compared on a month-over-month or year-over-year basis. The diagnosis retained each reporting period's original scope to avoid misinterpreting mid-month data as a full-month trend.
3. Examine the relationship between ad sales and total store sales. Observe AI Ads sales together with store sales and the original ad sales structure to determine whether total store sales, total ad sales, and organic sales changed in sync when AI Ads sales increased.
4. Review the attribution targets of ad orders. Focus on whether orders were concentrated in the originally advertised ASINs, whether cross-Listing conversions occurred, and whether AI Ads sales might simply represent a redistribution among existing advertising channels.
5. Check the operating status of key ASINs. Separately flag products affected by stockouts, warehouse transfers, new product launches, or inventory changes. If an ASIN could not maintain stable supply during a key period, its ad data would not be suitable for directly evaluating changes in organic traffic or profitability.
6. Finally, return to the Listing and profitability levels. When ad performance is abnormal, do not assume that the issue is solely an advertising problem. Also review the Listing's conversion foundation, product price, inventory status, and actual costs. Only by evaluating ad data, organic sales, and product operating conditions within the same framework can the underlying issue be identified as a campaign, Listing, supply, or profitability-structure problem.
5. The Real Problem
 Problem 1: Ad Orders Could Not Be Confirmed as True Incremental Orders Based on Ad Reports Alone
Reason: AI Ads sales are measured according to an advertising attribution framework and do not automatically prove that these orders would not have occurred without AI Ads. Existing advertising campaigns, organic traffic, and different Listings may all involve order transfers.
Impact: If all attributed ad sales are treated as incremental sales, the actual contribution of AI Ads may be overstated, affecting decisions on renewal, expansion, and budget allocation.
Evidence: AI Ads sales were approximately 7.38万 in June and approximately 4.00万 in the first half of July. The share of AI Ads sales in total ad sales increased from approximately 49% to approximately 57.6%. These figures prove that AI Ads generated sales, but they are not sufficient to prove that all orders were incremental.
Problem 2: A Stable Organic Sales Share Does Not Mean Organic Traffic Has Grown
Reason: The organic sales share is affected by multiple factors, including total store sales, ad sales, product rankings, inventory, and Listing conversion. Even if the share remains stable, the overall structure may simply not have changed significantly for the time being.
Impact: If a stable organic sales share is mistakenly interpreted as organic growth driven by advertising, it will be impossible to accurately evaluate actual changes in organic keywords, organic rankings, and non-ad orders.
Evidence: The store's organic sales share remained stable at approximately 68%, but there is currently no complete evidence proving significant organic traffic growth, improved organic keyword rankings, or that organic orders were entirely driven by AI Ads.
Problem 3: A Low ACOS Does Not Mean Product-Level Profitability Has Improved
Reason: ACOS only relates ad spend to attributed ad sales and does not account for product costs, storage and warehouse transfer costs, promotional discounts, or other operational factors. Some products were also affected by stockouts, warehouse transfers, and cross-Listing conversions.
Impact: Ads may appear efficient, while the target products may still lack clear profitability due to high costs, unstable inventory, or order transfers. Without breaking the analysis down to key ASINs, ad optimization may become disconnected from actual business objectives.
Evidence: AI Ads had an ACOS of approximately 4.0% in June and approximately 3.8% in the first half of July. However, the available information is insufficient to prove an improvement in product-level profitability. Stockouts, warehouse transfers, and cross-Listing conversions also increased the complexity of ad attribution and profitability evaluation.
6. Optimization Plan
 Advertising Optimization: From Focusing on ACOS to Evaluating Overall Contribution
The advertising strategy adjustment and phased data synchronization have been completed. The analysis now focuses not only on the ACOS of individual campaigns, but also on AI Ads sales, the share of ad sales, total store sales, the organic sales share, and orders from key ASINs.
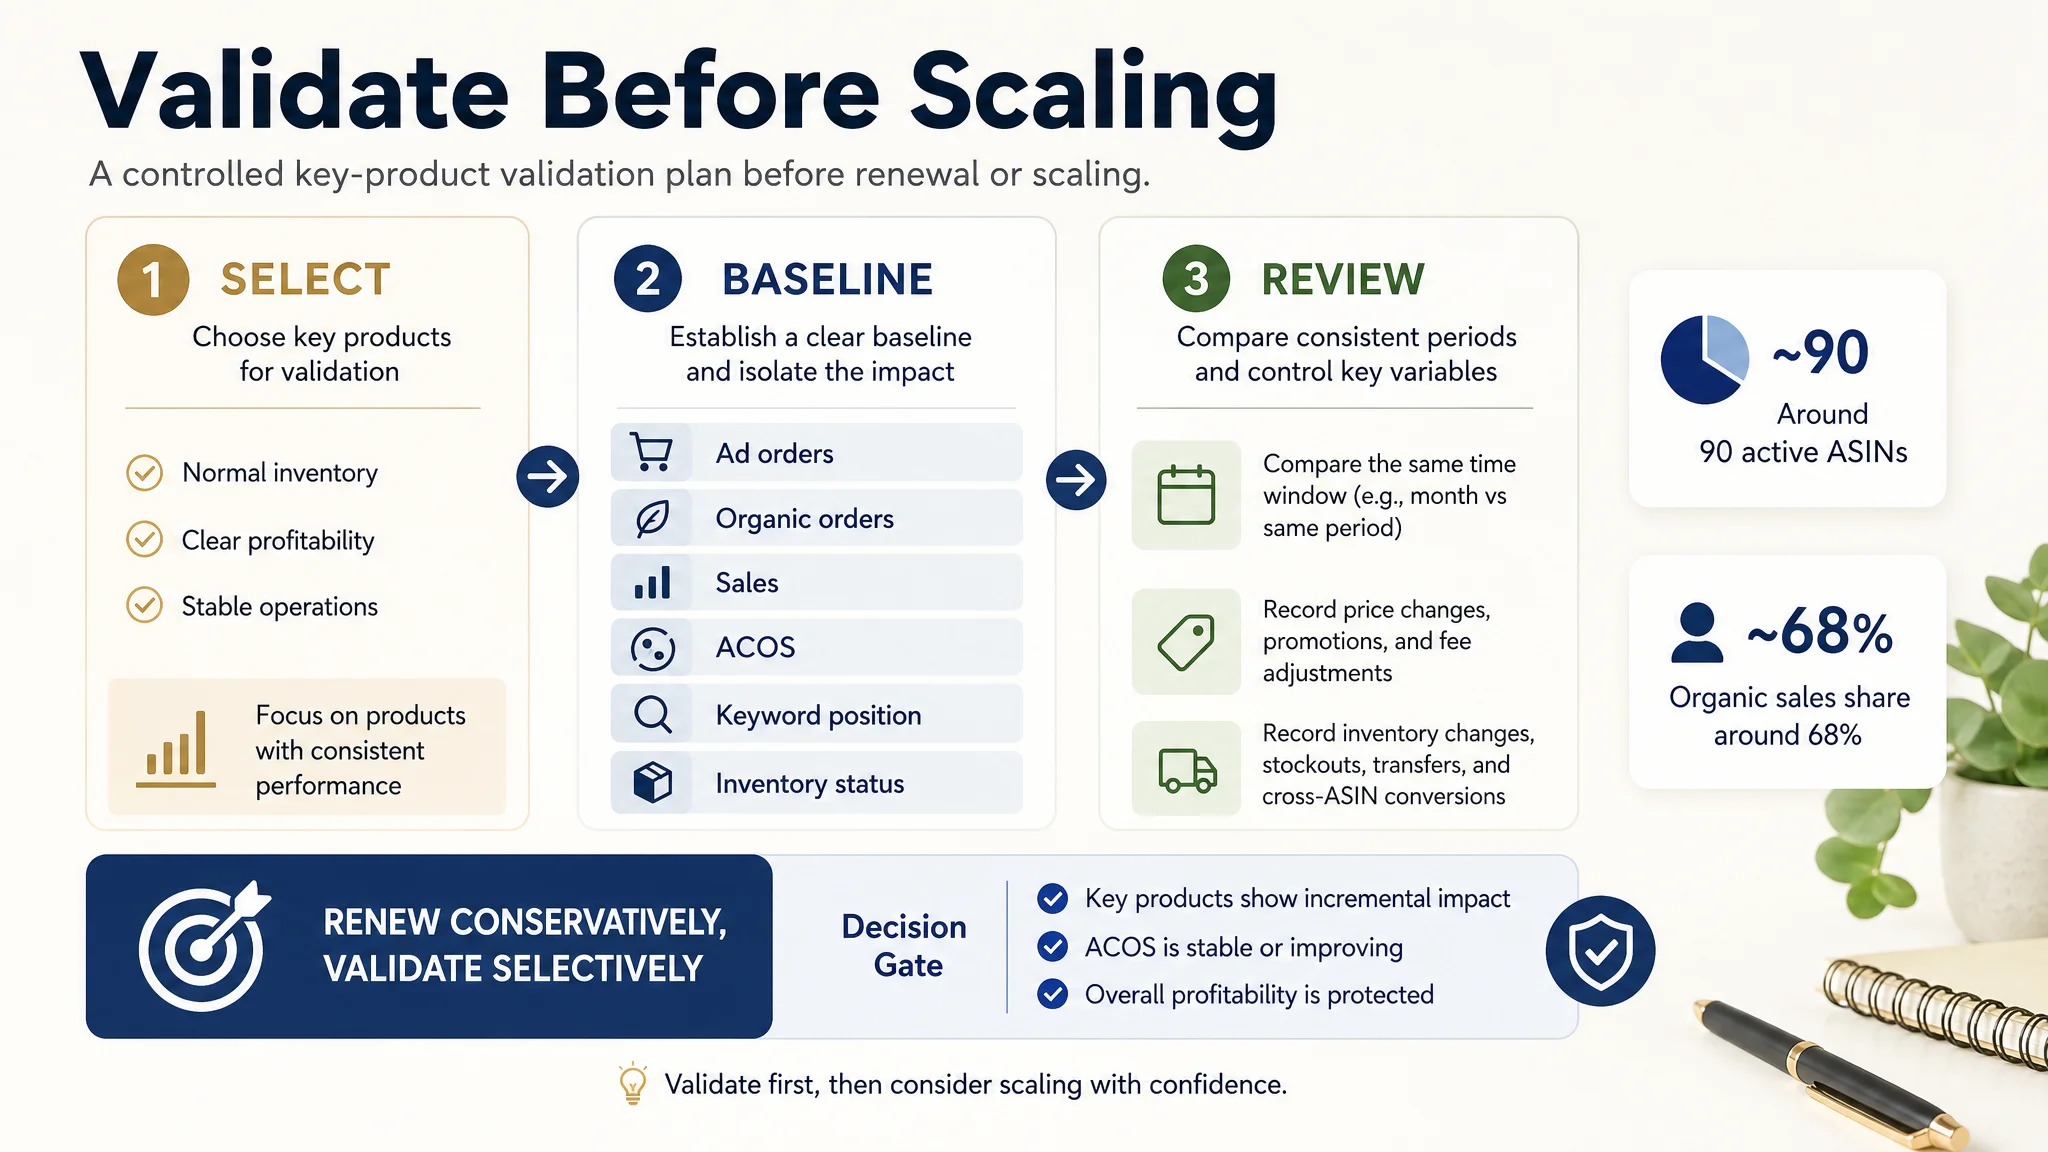
The next step should prioritize key products with normal inventory, clear margins, and stable operating performance. Establish a baseline before and after campaign launch, and separately record ad orders, organic orders, sales, and ACOS to avoid interference from stockouts, warehouse transfers, and cross-Listing conversions.
Listing Optimization: First Determine Whether the Issue Is Advertising-Related
The current information does not provide sufficient evidence that specific Listing optimizations have been completed and that their results have been validated. Therefore, the results cannot be attributed to Listing changes. In actual diagnosis, first check whether the main image, title, bullet points, price, reviews, and inventory are stable. Then determine whether a conversion-rate issue is caused by the Listing or by the quality of advertising traffic.
If ads generate clicks but insufficient conversions, first assess the Listing's ability to convert visitors. If Listing conversion remains stable but traffic is insufficient, further analyze keywords, ad structure, and bidding strategy. Advertising issues and Listing issues must be validated separately; a single ACOS metric cannot replace this analysis.
Organic Traffic Strategy: Establish Verifiable Metrics
Whether ads drive organic traffic cannot be determined by subjective impressions. In the next period, track the organic sales share, organic orders, organic keyword changes, and organic ranking trends for key ASINs, while recording inventory status and price changes at the same time. Only when organic metrics show stable changes across comparable periods, and factors such as stockouts and warehouse transfers have been ruled out, is it appropriate to discuss the potential impact of advertising on organic traffic.
Service Actions: Reduce Uncertainty in Data and Operations
DeepBI has completed product training, multi-store integration guidance, and the handling of authorization and management exceptions, helping the customer establish a foundation for observing advertising data across stores. Going forward, a “conservative renewal + key product validation” approach is more appropriate than directly expanding the campaign scope before incremental sales and profitability have been fully reviewed.
7. Results
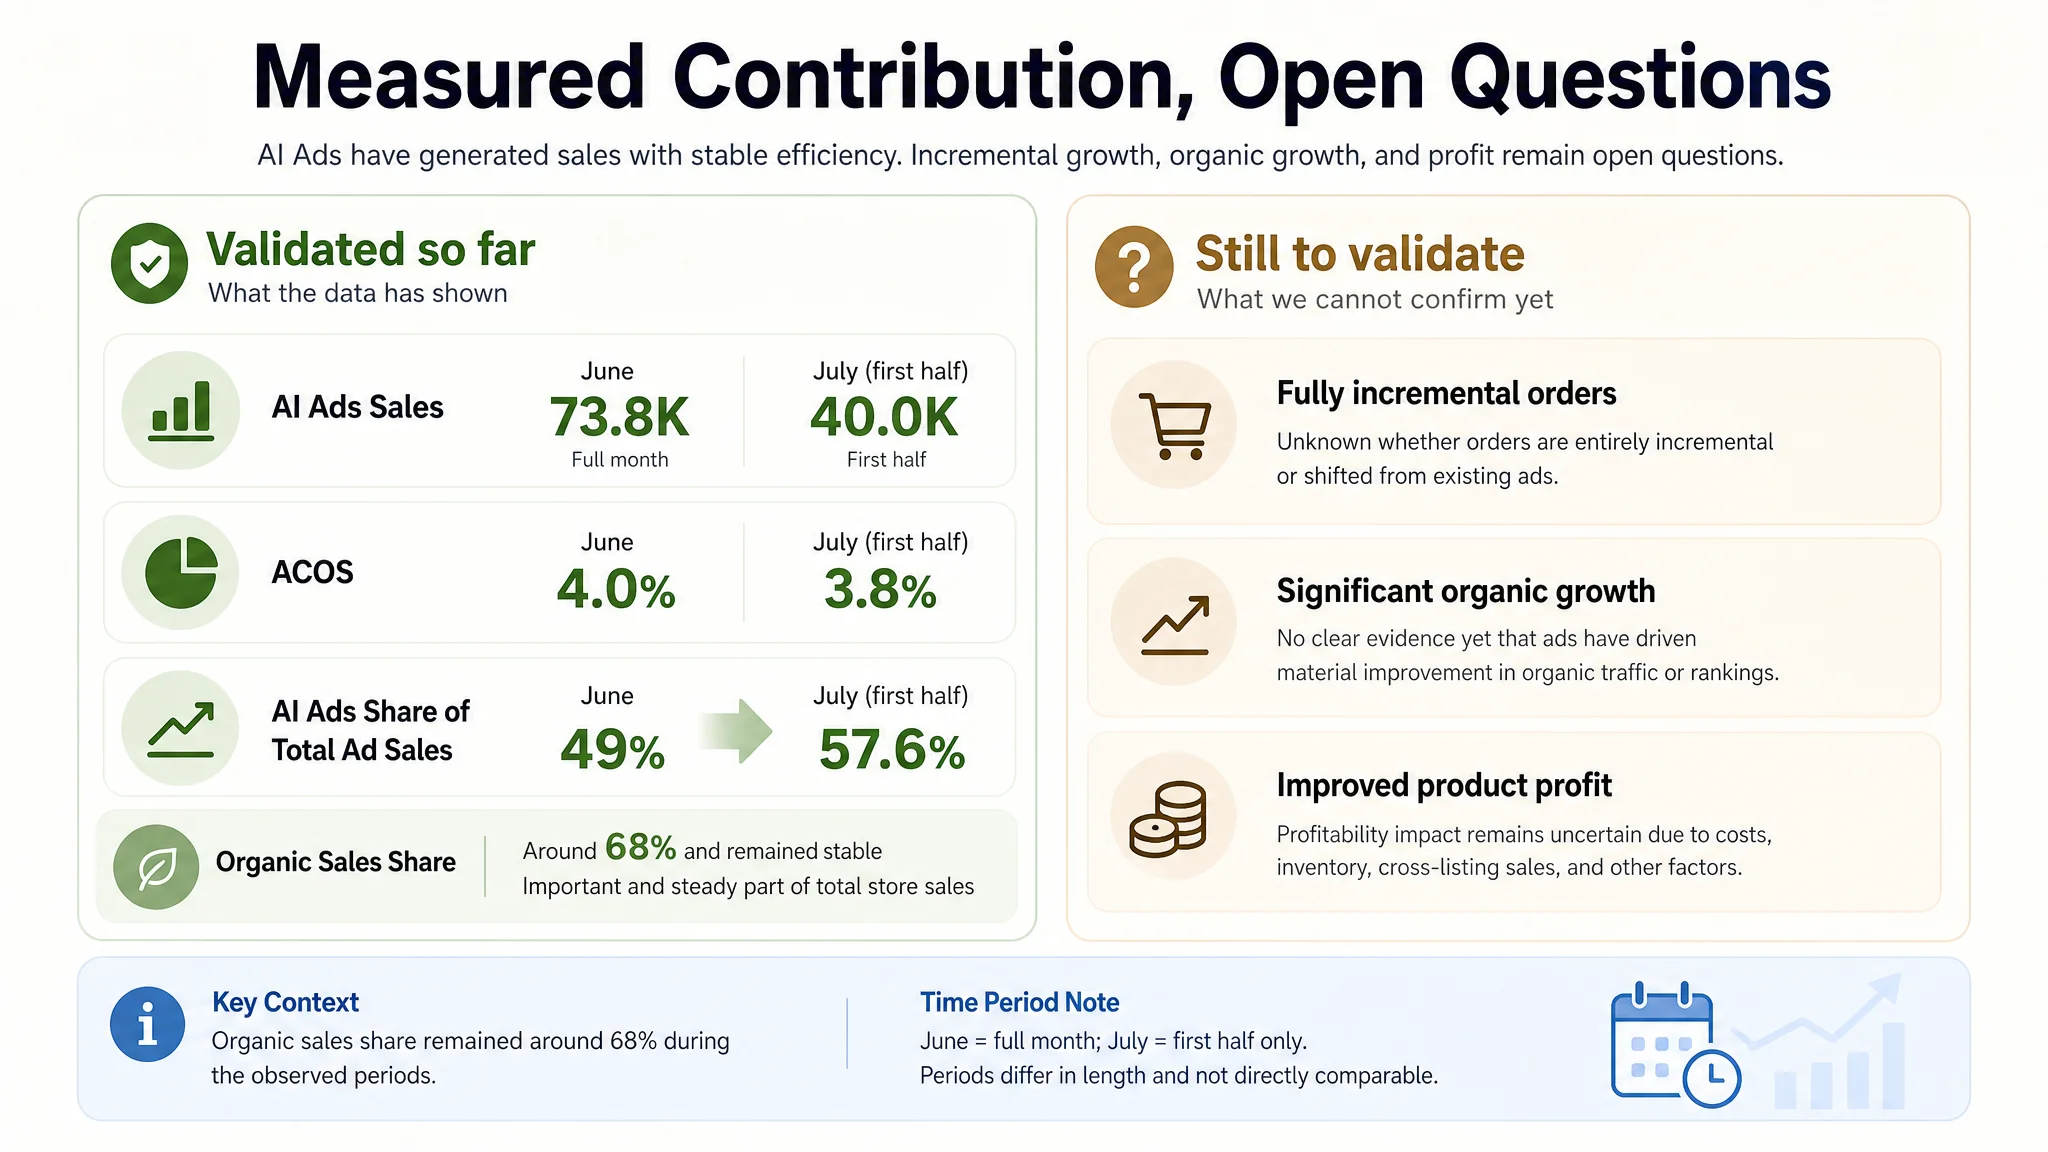
Based on the phased data analysis completed so far, AI Ads have generated a quantifiable sales contribution:
- Full month of June: AI Ads sales were approximately 7.38万, with an ACOS of approximately 4.0%, accounting for approximately 49% of total ad sales;
- First half of July: AI Ads sales were approximately 4.00万, with an ACOS of approximately 3.8%, accounting for approximately 57.6% of total ad sales;
- Overall store sales: Approximately 47.25万 in the full month of June and approximately 21.68万 in the first half of July; the two periods cannot be directly compared as full months;
- Organic sales share: Remained stable at approximately 68%.
These changes verify two points. First, AI Ads have generated orders, with phased ACOS remaining within approximately 4%. Second, the share of AI Ads sales in total ad sales has increased.
However, the following conclusions have not yet been fully validated: whether the ad orders were entirely incremental, whether they reduced orders from the original advertising campaigns, whether organic traffic grew significantly, and whether the actual profitability of key products improved. Therefore, this case represents a phased validation and should not be interpreted as a case of organic traffic growth or improved profitability.
8. Case Summary
The real issue in this case was not whether AI Ads generated orders, but what those orders added to the store. Ad sales can prove that advertising generated conversions, and ACOS can reflect attributed advertising efficiency, but neither metric alone can prove true incrementality, organic traffic growth, or improved product profitability.
In its diagnosis, DeepBI evaluated advertising data together with overall store sales, organic sales, key ASINs, inventory changes, and cross-Listing conversions. This helped the customer break down “advertising effectiveness” into several questions that could continue to be validated. The current results show that AI Ads have generated sales with stable efficiency, but organic traffic, incremental orders, and profitability still require a subsequent review focused on key products.
9. Key Takeaways for Sellers
Takeaway 1: Do Not Treat Attributed Ad Sales Directly as Incremental Sales
To evaluate incremental orders from Amazon Ads, sellers should at least observe total store sales, original ad sales, AI Ads sales, and organic orders together. If only the sales share of one advertising channel increases, it cannot be directly interpreted as the store gaining an equivalent volume of incremental orders.
Takeaway 2: Determine Whether the Issue Is Advertising or the Listing Based on the Funnel Stage
If there are impressions and clicks but insufficient conversions, the issue may lie with the Listing, price, reviews, or product conversion experience. If there are conversions but insufficient traffic, keywords, ad structure, and budget allocation require closer examination. Identify the problem first, then decide whether to optimize the ads or the Listing.
Takeaway 3: Validate with Key ASINs Before Renewing or Scaling
Select products with normal inventory, clear margins, and stable operations. Define metrics including ad sales, ACOS, ad orders, organic sales share, organic keywords, and product profitability, while distinguishing between full-month and mid-month data. Only after reviewing comparable periods can sellers more reliably evaluate Amazon Ads performance, changes in organic traffic, and true business value.