

Introduction
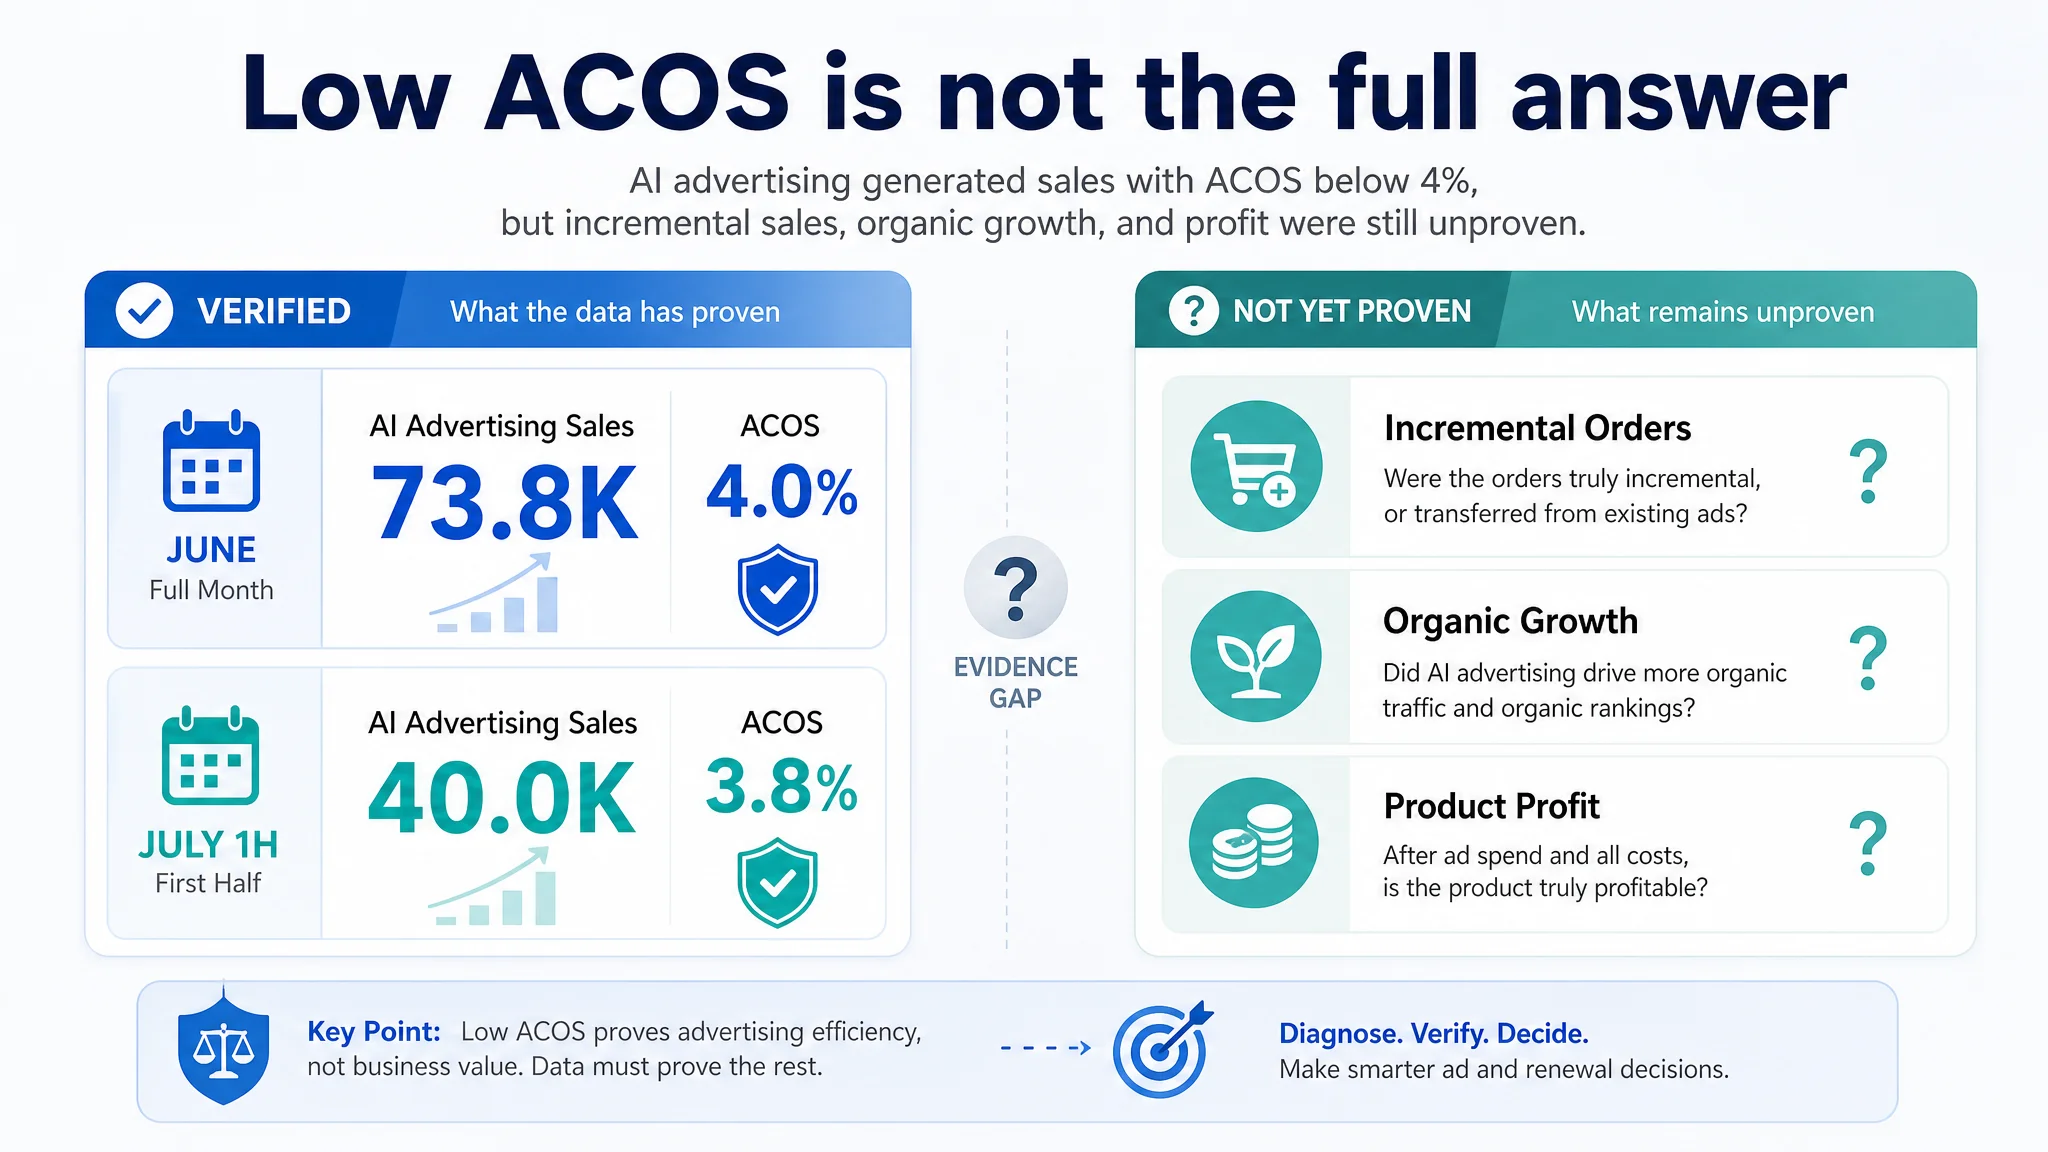
For Amazon sellers, a low ACOS does not necessarily mean that advertising has generated genuine incremental sales. A European mobile accessories seller had approximately 90 active ASINs. After adopting and launching AI advertising, AI advertising generated approximately 7.38万 in sales in June, with an ACOS of approximately 4.0%; during the first half of July, it generated approximately 4.00万 in sales, with an ACOS of approximately 3.8%. However, the customer still wanted to know: Were these orders merely transferred from existing advertising orders? Did the organic sales share improve? After advertising conversions shifted to other Listings, did the target products remain profitable? This case demonstrates how to diagnose what AI advertising has actually improved—and which conclusions have not yet been proven by the data—from multiple perspectives, including ACOS, advertising sales share, organic sales share, ASIN performance, and profit.
Customer Background
This was a European Amazon seller specializing in mobile accessories, with approximately 90 active ASINs in its store. In the early stages, the customer focused on multi-store integration, sub-account management, authorization security, and reducing the cost of manual operations. After advertising was launched and began generating orders, the customer’s business focus changed.
The customer no longer asked only, “Did the advertising generate orders?” Instead, they wanted to understand the actual value of advertising to the overall store operation:
- Were the sales generated by AI advertising entirely incremental orders?
- Did AI advertising take orders away from existing advertising campaigns?
- Did advertising promote organic traffic and organic rankings?
- After an ASIN generated advertising sales, did it remain profitable after deducting advertising costs and other operating costs?
- In situations involving new products, inventory transfers, stockouts, or cross-Listing conversions, could the original advertising data still accurately reflect product performance?
These questions show that the seller had moved from asking whether “advertising can be run” to diagnosing “which business metrics advertising has actually improved.” Reviewing ACOS alone was no longer sufficient to support business decisions such as renewing the service, expanding ad spend, or adjusting product strategies.
The Problem
ACOS Performance Was Good, but the Value of Advertising Could Not Yet Be Fully Confirmed
On the surface, AI advertising maintained a low level of efficiency. In June, the full-month AI advertising sales were approximately 7.38万, with an ACOS of approximately 4.0%; during the first half of July, sales were approximately 4.00万, with an ACOS of approximately 3.8%. Looking only at these two metrics could easily lead to the conclusion that “advertising efficiency is good.”
However, for store operators, ACOS answers only one limited question: What is the ratio of advertising spend to advertising-attributed sales? It cannot directly answer the following questions:
- Were the advertising sales incremental?
- Were advertising orders transferred from existing advertising campaigns?
- Did advertising drive growth in organic orders?
- Which ASINs accounted for the advertising sales, and were the products themselves profitable?
Therefore, the customer’s question was not “Did AI advertising generate sales?” but rather “What incremental value did these sales create for the store as a whole?”
An Increased Advertising Sales Share Did Not Mean Overall Operating Efficiency Had Already Improved
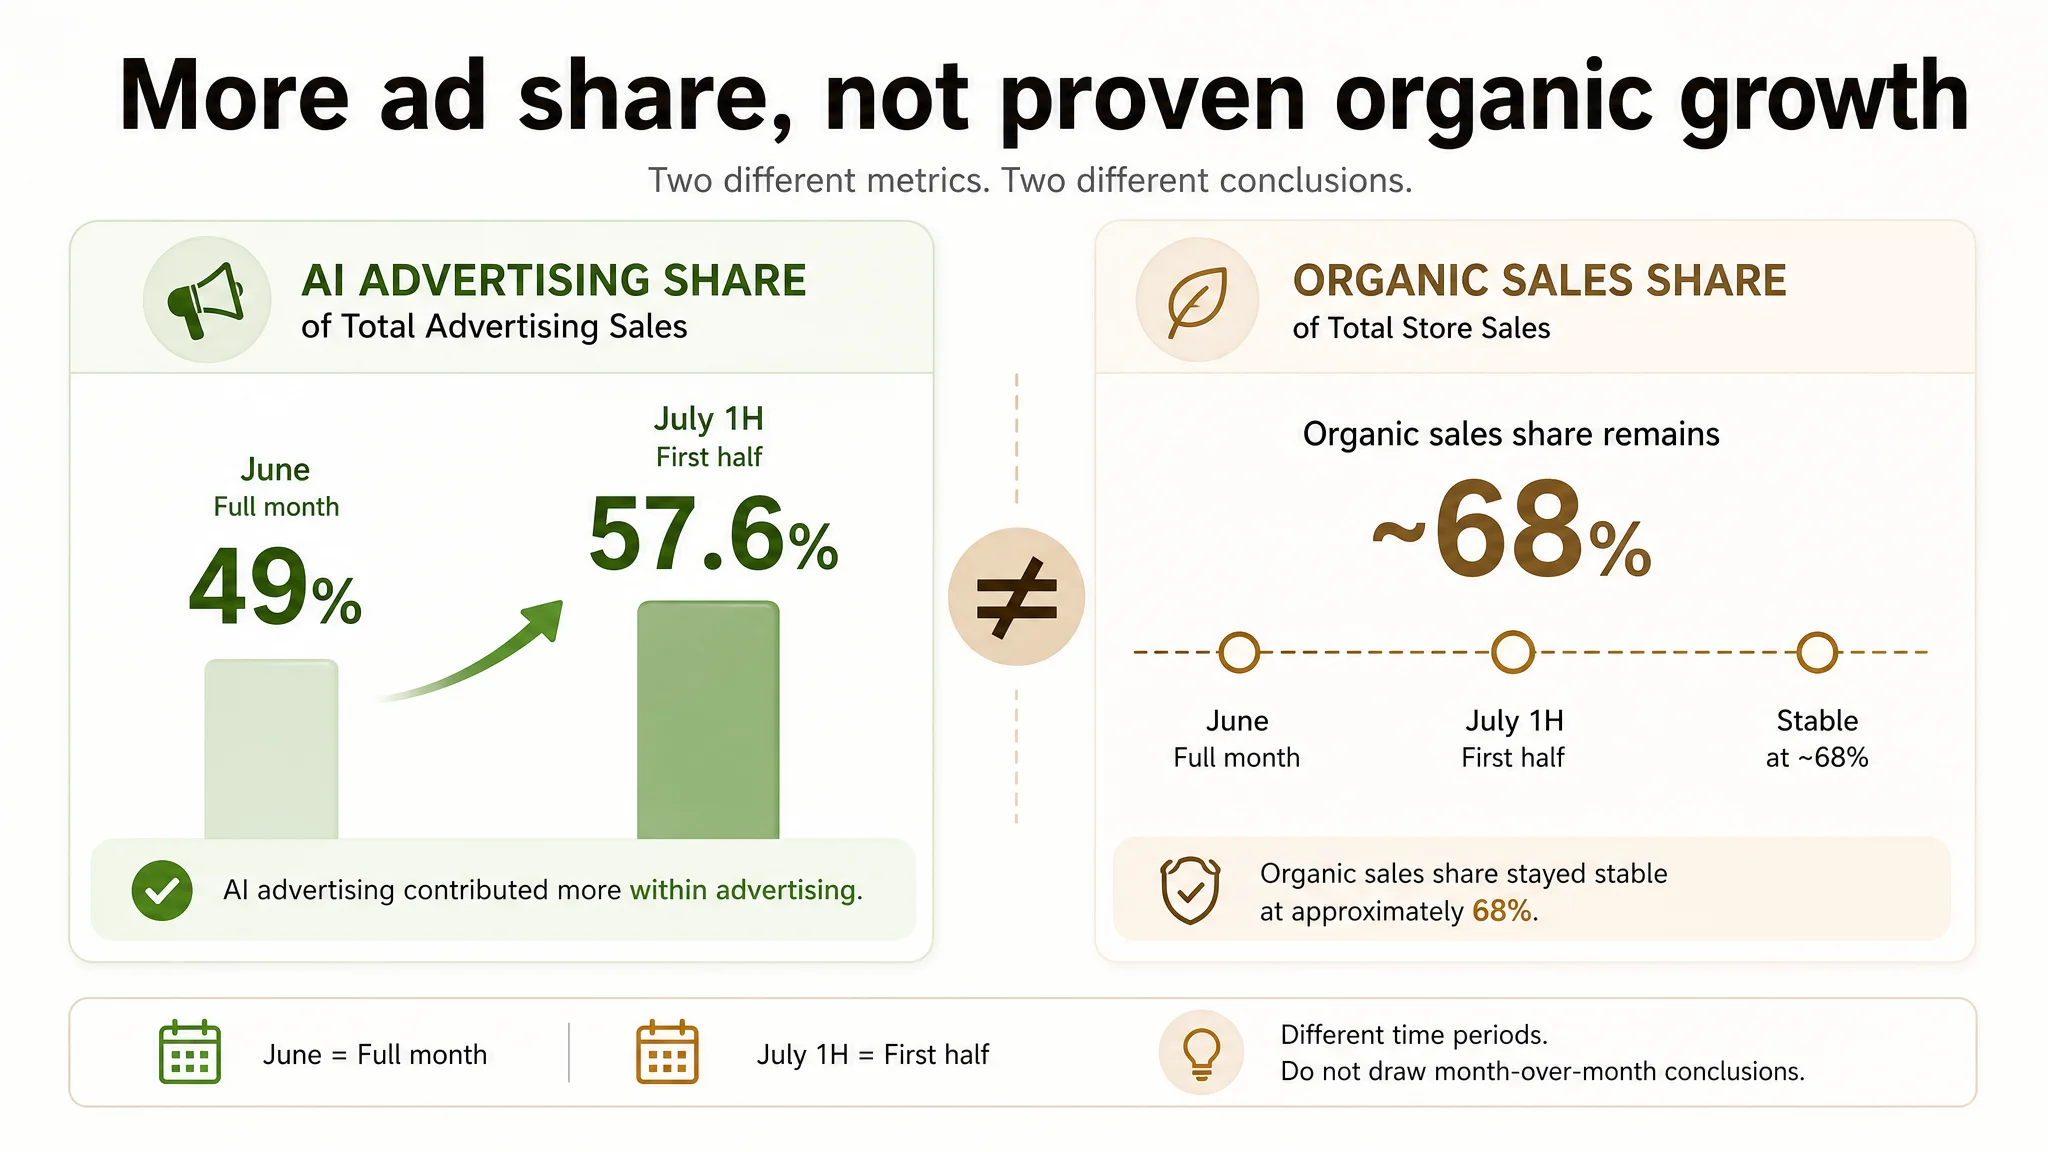
In June, AI advertising accounted for approximately 49% of total advertising sales. During the first half of July, this proportion increased to approximately 57.6%. This indicates that AI advertising contributed more to the store’s advertising sales, while ACOS remained relatively low during the same period.
However, an increased advertising sales share may also result from changes in sales generated by existing advertising campaigns, changes in the ad mix, or differences between statistical periods. In particular, June was a complete month, while July included only the first half of the month. The two periods cannot be used directly to draw month-over-month or year-over-year conclusions.
If an increase in the AI advertising sales share is taken as direct evidence that the store’s overall sales improved by the same magnitude, the boundaries of advertising attribution may be overlooked. Advertising sales share is a metric for evaluating advertising contribution, not direct evidence of organic traffic growth or increased profit.
A Stable Organic Sales Share Could Not Yet Prove That Advertising Had Driven Organic Traffic
The store’s organic sales share remained stable at approximately 68%. This indicates that the store’s organic sales structure had not changed significantly, but it does not prove that AI advertising had generated organic traffic growth.
At least two possibilities could explain a stable organic sales share: first, advertising-driven orders and organic sales may have grown together, keeping the ratio stable; second, advertising sales may have increased while organic sales did not change significantly, leaving the overall structure at a similar level. The organic sales share alone cannot distinguish between these two situations.
In addition, some products were affected by stockouts, inventory transfers, and cross-Listing conversions. Changes in inventory and Listing status can affect ad exposure, order attribution, organic rankings, and product profit assessments. Therefore, what the customer needed was not a single advertising conclusion, but a data-driven diagnostic method capable of eliminating operational interference factors.
How DeepBI Diagnosed
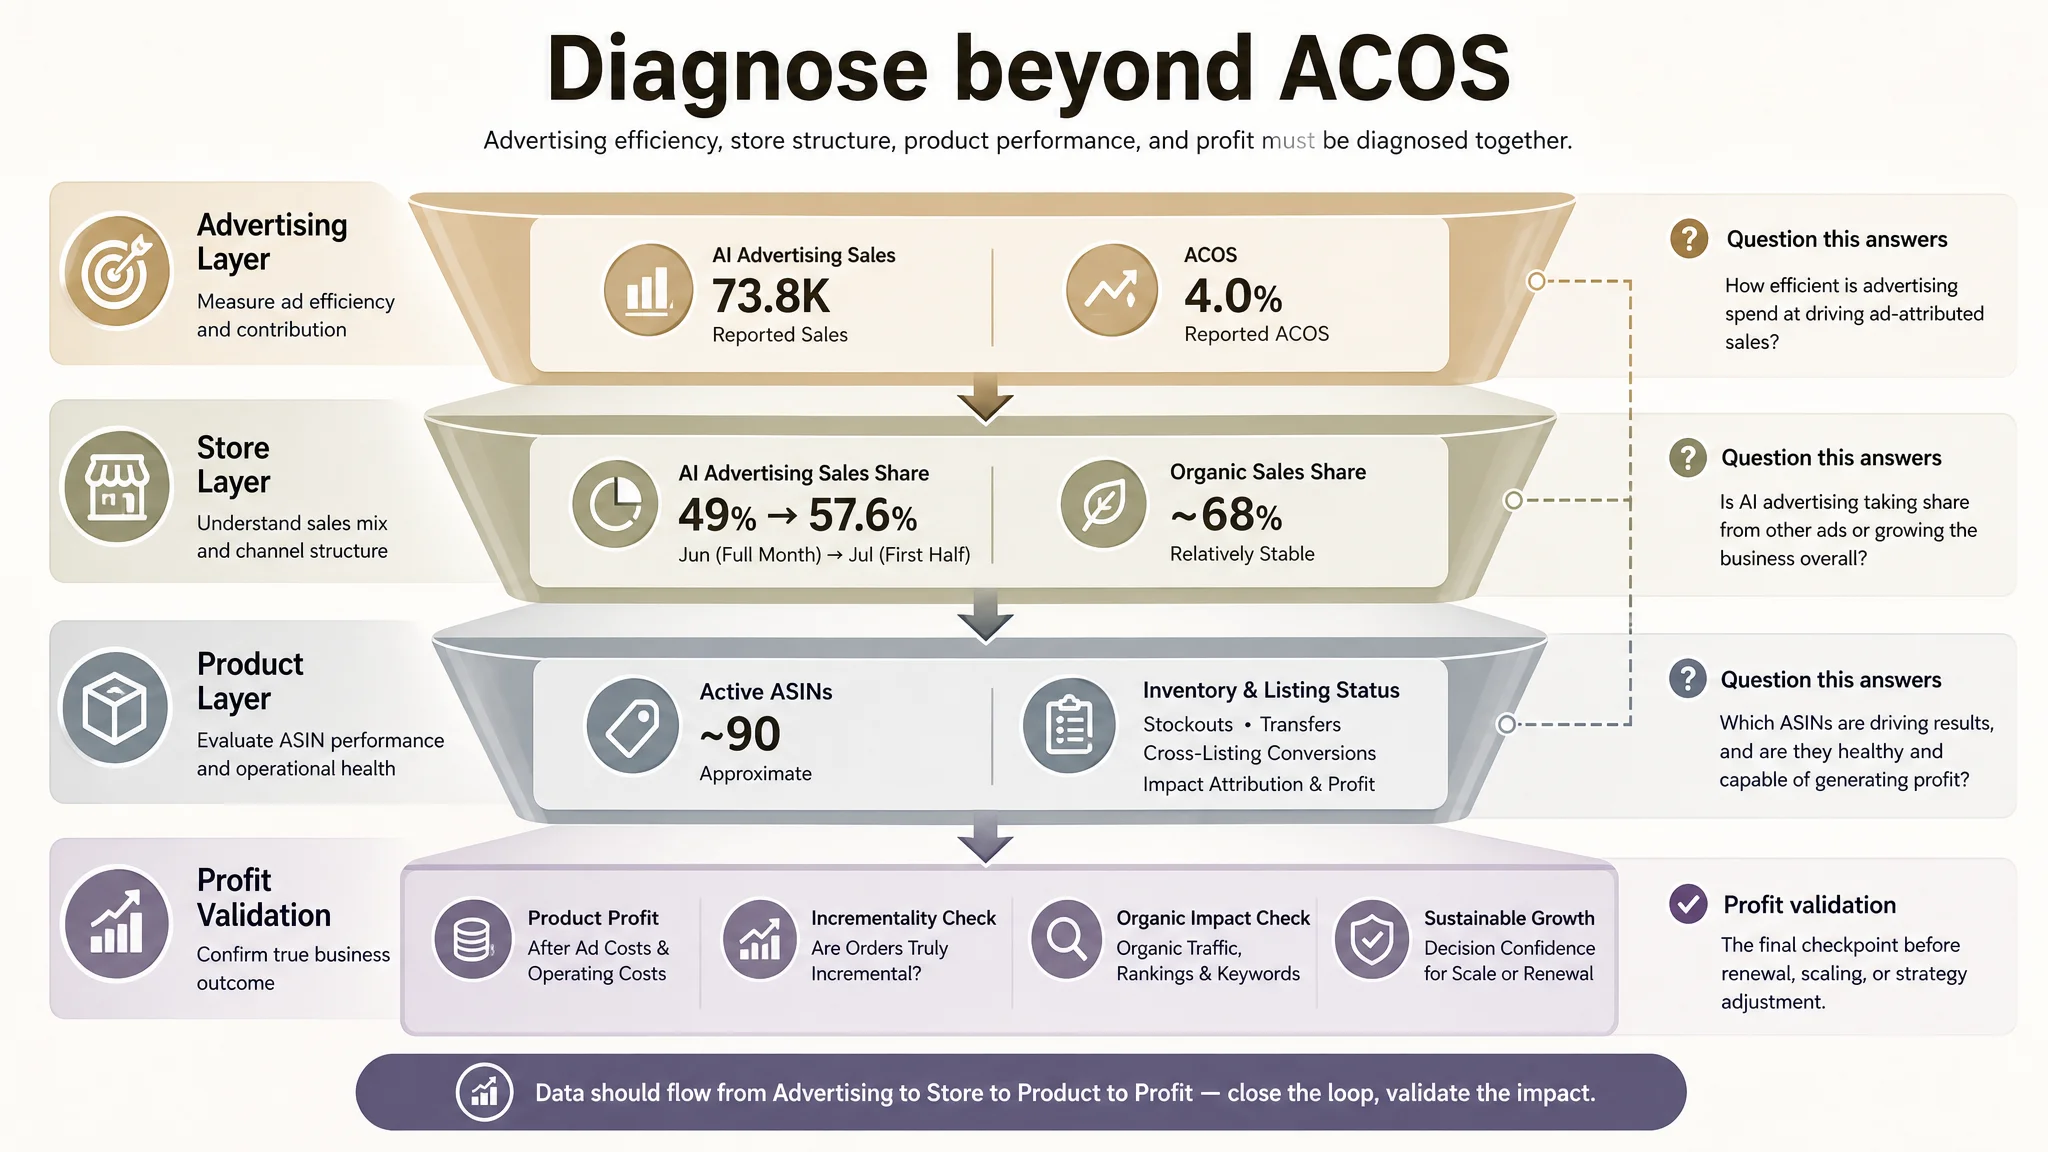
DeepBI did not treat “low ACOS” as the final conclusion. Instead, it placed advertising data, store sales, ASIN performance, organic sales, and operating conditions within the same analytical framework and broke down the problem through the following steps.
1. First Confirm the Statistical Definitions and Time Periods
The first step was to distinguish between full-month and mid-month data and clarify the statistical scope of sales, advertising sales, ACOS, and advertising sales share. In this case, June was a complete month, while July covered only the first half of the month. Therefore, the data could be used to observe performance at a particular stage, but the two periods could not be directly treated as two complete months for year-over-year comparison.
The diagnosis also needed to distinguish among total store sales, advertising sales, AI advertising sales, and organic sales to avoid mixing data with different definitions. Only after the statistical periods were aligned could changes in ACOS and sales shares be interpreted properly.
2. Then Review Advertising Sales Contribution Rather Than ACOS Alone
At the advertising structure level, DeepBI focused on how much sales AI advertising generated, what proportion of total advertising sales it represented, and whether this contribution was concentrated among a small number of ASINs.
In this case, AI advertising generated approximately 7.38万 in sales in June and approximately 4.00万 during the first half of July. Its share of total advertising sales increased from approximately 49% to approximately 57.6%. These figures prove that AI advertising had already generated observable sales and that its contribution to the advertising campaigns during the same periods had increased.
However, this step still could not prove that the orders were entirely incremental. The existing advertising campaigns, key ASINs, and changes in organic sales needed to be reviewed further.
3. Break Down Advertising Orders and Store Orders by ASIN
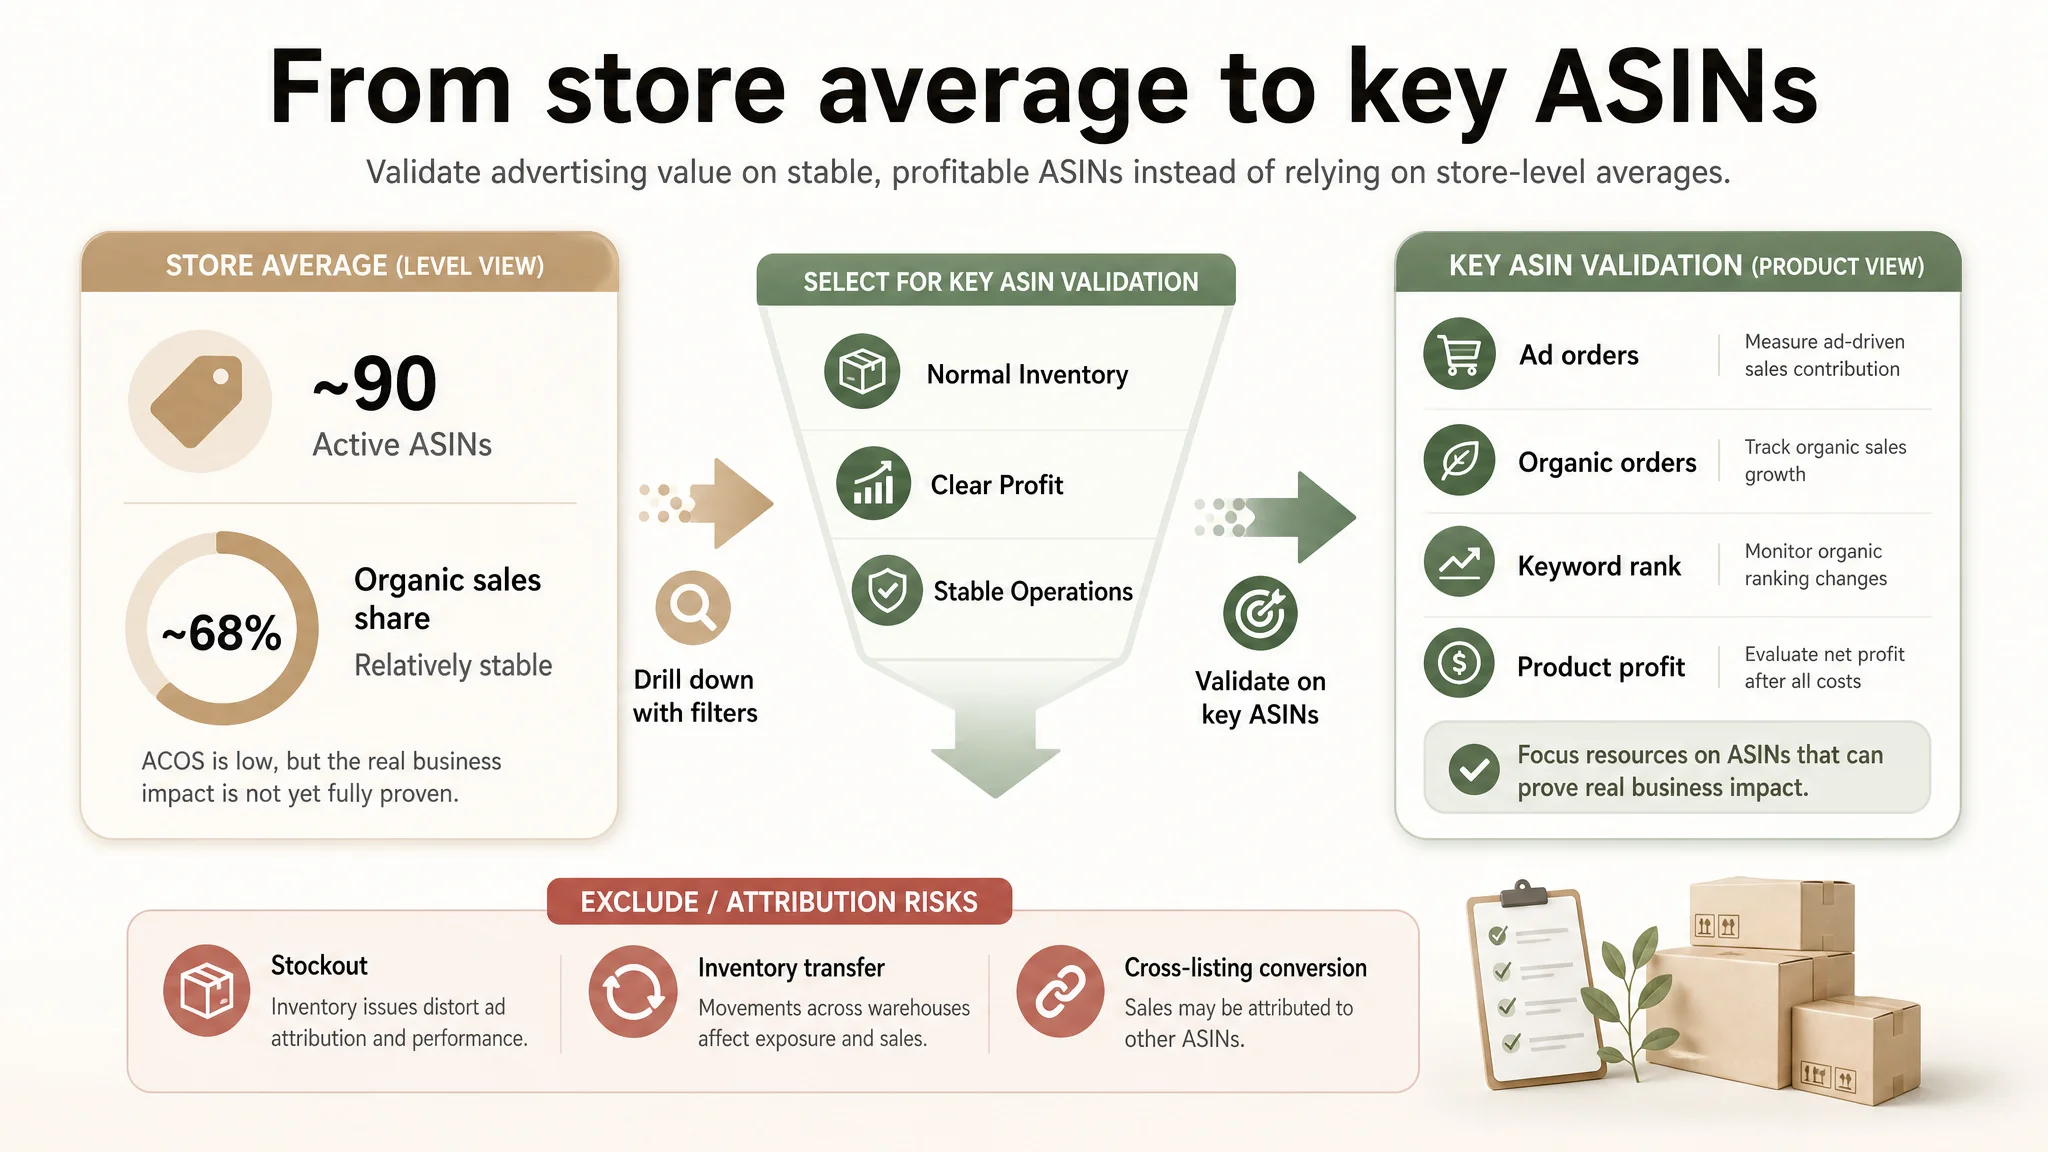
The average ACOS at the store level may conceal differences among products. Therefore, the diagnosis needed to examine the advertising sales, advertising orders, organic orders, inventory status, and conversion relationships between Listings for key ASINs.
If an ASIN’s advertising sales increased while its organic orders, organic keywords, and organic sales also showed continuous improvement, it would be closer to the conclusion that “advertising may have improved the overall Listing performance.” Conversely, if advertising sales increased but organic orders did not change, or if orders were primarily converted to other Listings, the store’s advertising growth could not simply be interpreted as organic growth for the target product.
This case involved stockouts, inventory transfers, and cross-Listing conversions. Therefore, changes in orders for key ASINs had to be evaluated together with inventory and Listing status.
4. Check Search Terms, Advertising Structure, and Listing Status
When a seller asks, “Is this an advertising problem or a Listing problem?” the answer cannot be determined by looking only at campaign results. The diagnosis also needs to examine the advertising structure, search terms, and ASIN performance in sequence, while considering Listing relevance, value proposition communication, price, and inventory status to identify the source of conversion changes.
For example, if an ad receives impressions but has insufficient conversions, the issue may be a mismatch with search terms, insufficient Listing ability to convert traffic, or product competitiveness. If ad clicks and orders increase but organic rankings do not change, it is necessary to further confirm keyword coverage and whether organic orders have actually increased.
Based on the available materials, it has been confirmed that AI advertising generated sales and maintained stable efficiency. However, significant organic traffic growth, completely incremental advertising orders, and product-level profit improvement have not yet been fully verified. Therefore, conclusions at the Listing and organic keyword levels cannot be determined prematurely.
5. Finally Connect the Analysis to Product Profit Rather Than Stopping at the Advertising Report
Advertising sales do not equal product profit. To determine whether an ASIN has truly benefited, it is also necessary to consider the product selling price, advertising costs, inventory status, and other operating costs, and to evaluate whether the sales generated by advertising have produced sustainable profit.
The customer was particularly concerned about profitability after advertising orders were converted to other Listings. This means that profit diagnosis must be conducted at the product and Listing levels, rather than being replaced by the store’s average ACOS. Based on periodic data synchronization and advertising strategy adjustments, DeepBI provided an entry point for observing key products in subsequent validation. However, the current data was still insufficient to conclude that product-level profit had improved.
The Real Problem
Problem 1: ACOS Was Treated as the Complete Answer to Advertising Effectiveness
Cause: ACOS reflects only the ratio between advertising spend and advertising-attributed sales. It cannot show whether advertising orders were incremental or how advertising affected organic sales and overall profit.
Impact: If the budget is expanded solely because of low ACOS, situations such as order transfers, unchanged organic sales, or insufficient product-level profit may be overlooked.
Evidence: In this case, AI advertising had an ACOS of approximately 4.0% in June and approximately 3.8% during the first half of July. However, the available data was still insufficient to prove significant organic traffic growth, completely incremental orders, or product-level profit improvement.
Problem 2: Advertising Sales Contribution and Overall Store Growth Were Not Separated
Cause: AI advertising sales, total advertising sales, total store sales, and organic sales are different metrics. An increased advertising sales share only indicates that AI advertising contributed more to advertising sales; it cannot be directly equated with simultaneous growth in total store sales or organic sales.
Impact: Sellers may misinterpret order transfers between advertising campaigns as incremental orders, or mistake an increased advertising sales share for organic traffic growth.
Evidence: The share of AI advertising sales in total advertising sales increased from approximately 49% in June to approximately 57.6% during the first half of July. However, the organic sales share remained stable at approximately 68% during the same period, and the two statistical periods were not fully comparable.
Problem 3: ASIN, Inventory, and Listing Status Increased Attribution Difficulty
Cause: Some products experienced stockouts, inventory transfers, or cross-Listing conversions. Changes in inventory and Listing status simultaneously affected ad delivery, order attribution, organic rankings, and profit calculations.
Impact: Without analyzing key ASINs together with their operating status, it was difficult to determine which Listing received the orders generated by advertising or accurately evaluate the profitability of the target products.
Evidence: The customer had explicitly raised concerns about profit after advertising sales were converted to other Listings and had asked whether advertising strategies could be adjusted promptly in situations involving new products, inventory transfers, and stockouts. These factors show that store-level averages cannot replace product-level diagnosis.
Optimization Plan
1. Establish a Unified Observation Framework from Advertising to the Store
DeepBI completed multi-store integration guidance, authorization and management exception handling, and periodic data synchronization, enabling the customer to observe AI advertising sales, ACOS, total advertising sales, total store sales, and organic sales share under consistent definitions.
The focus of this step was not to pursue more reports, but to first clarify what each metric represented: ACOS was used to observe advertising investment efficiency; advertising sales share was used to observe AI advertising’s contribution within the advertising system; organic sales share was used to observe the store’s sales structure; and ASIN data was used to further assess product-level changes.
2. Move from Store Averages Down to Key ASINs
Subsequent diagnoses did not use the store’s average ACOS as the sole optimization basis. Instead, priority was given to key products with normal inventory, clear profitability, and stable operating conditions. Advertising orders, organic orders, advertising sales, organic sales, and keyword changes were reviewed separately for these products.
Products affected by stockouts, inventory transfers, or cross-Listing conversions should be separately marked with their data status to avoid using sales changes during abnormal periods to evaluate AI advertising effectiveness directly.
3. Adjust the Strategy Based on Advertising Structure and Periodic Data
Advertising strategy adjustments had already been completed during the service process. Going forward, search terms, advertising structure, ASIN conversion, and Listing performance should be considered together to determine whether an issue originated from ad delivery, the product page, or inventory status.
If ads receive clicks but conversions are insufficient, the match between search terms and the Listing should be examined. If advertising sales increase but the organic sales share does not change, organic orders and keyword rankings should continue to be monitored. If orders are converted to other Listings, the sales contribution and product profit of each Listing should be recalculated.
4. Establish Verifiable Organic Traffic and Profit Metrics
The next stage should not focus solely on “reducing ACOS.” Instead, multiple verification metrics should be established for key ASINs:
- AI advertising sales and its share of total advertising sales;
- Changes in advertising orders and organic orders;
- Organic sales share and changes in organic sales;
- Changes in the organic rankings of key keywords;
- Inventory status and Listing attribution for key ASINs;
- Product profit after deducting advertising costs and other operating costs.
Only when these metrics show continuous changes within clearly defined statistical periods can they provide a more reliable basis for evaluating the true business value of AI advertising.
Results
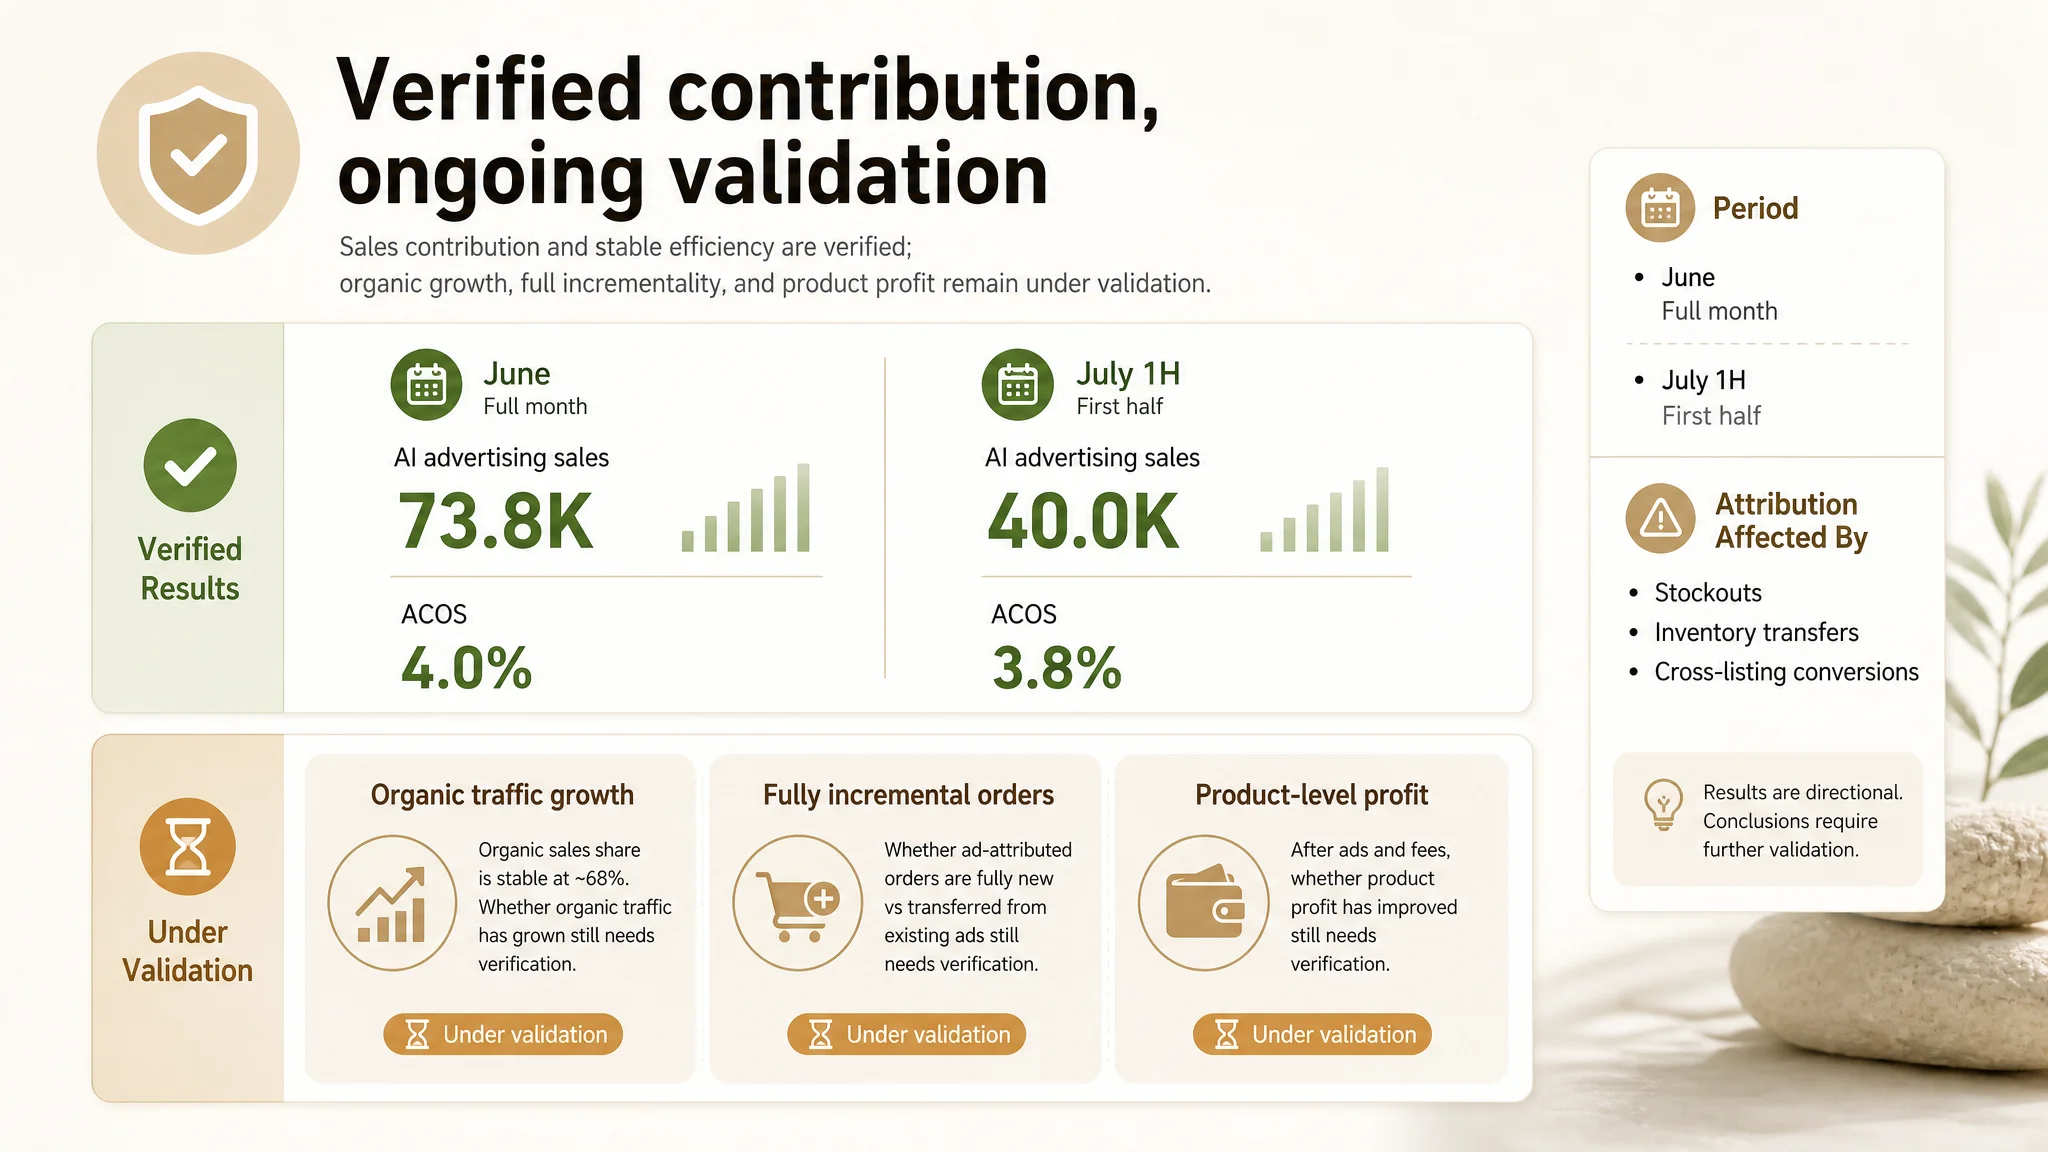
Based on the periodic data that has been completed, AI advertising has generated a clear sales contribution. However, the results are still part of an ongoing validation process rather than final proof of organic traffic growth or profit improvement.
- In the complete month of June, total store sales were approximately 47.25万, AI advertising sales were approximately 7.38万, and ACOS was approximately 4.0%;
- During the first half of July, total store sales were approximately 21.68万, AI advertising sales were approximately 4.00万, and ACOS was approximately 3.8%;
- The share of AI advertising sales in total advertising sales increased from approximately 49% in June to approximately 57.6% during the first half of July;
- The store’s organic sales share remained stable at approximately 68%;
- AI advertising generated sales, while its periodic delivery efficiency remained stable;
- Whether organic traffic grew significantly, whether advertising orders were entirely incremental, and whether product-level profit improved have not yet been fully verified.
It is important to note that June was a complete month, while July covered only the first half of the month. The two periods cannot be directly compared as complete monthly results. At the same time, stockouts, inventory transfers, and cross-Listing conversions also affected advertising attribution and profit assessment. Therefore, the most accurate conclusion at this stage is that AI advertising’s sales contribution and delivery efficiency have been validated on a periodic basis, while its impact on organic traffic, incremental orders, and product profit requires continued observation.
Case Summary
The real challenge in this case was not how to reduce ACOS from an already low figure, but how to determine the business value behind the advertising data.
AI advertising has generated sales and maintained a low ACOS during the current statistical periods. However, advertising sales, advertising sales share, organic sales share, and product profit each answer different questions and cannot replace one another. To determine whether advertising has genuinely improved store performance, sellers need to start with the advertising structure and search terms, drill down to key ASINs, and then cross-validate the findings against the Listing, inventory, organic orders, keywords, and profit.
In this process, DeepBI played a role in data integration, periodic diagnosis, and strategy adjustment. The current results prove that AI advertising has generated a sales contribution, but they should not be prematurely presented as a case of organic traffic growth, completely incremental orders, or profit improvement. For sellers, this clear diagnostic boundary is more helpful for making rational advertising optimization and renewal decisions.
Key Takeaways for Sellers
Takeaway 1: Low ACOS Does Not Equal High Incrementality
An excessively high Amazon advertising ACOS requires optimization, but a low ACOS does not necessarily mean that advertising has created incremental value. When evaluating advertising effectiveness, sellers should review advertising sales, organic sales, order structure, and key ASIN performance together at a minimum.
Takeaway 2: Advertising Problems and Listing Problems Must Be Separated Through Data Analysis
If an ad receives impressions but does not convert, the issue may lie in the search terms, ad structure, or the Listing’s ability to convert traffic. If advertising sales increase while organic sales remain unchanged, it is necessary to further determine whether advertising is merely capturing existing demand. Do not identify the source of a problem based solely on one ACOS figure.
Takeaway 3: Organic Traffic and Profit Require Continuous, Product-Level Validation
A stable organic sales share only indicates that the sales structure is temporarily stable; it does not directly prove organic traffic growth. Sellers should select key ASINs with normal inventory and clear profitability, continuously monitor organic keywords, organic orders, advertising orders, and product profit, and then decide whether to expand ad spend or renew the service.
For sellers operating multiple stores and ASINs, the focus of Amazon advertising data analysis is not to obtain more isolated metrics, but to establish a complete diagnostic chain from advertising investment to sales contribution, organic traffic, and product profit.